Environmental Engineering Reference
In-Depth Information
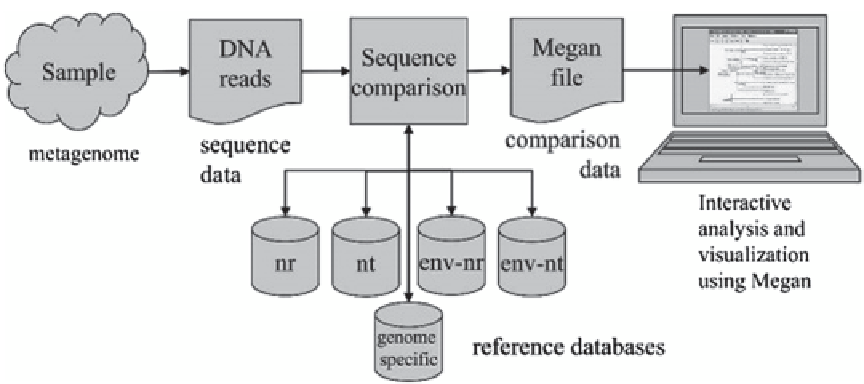
Fig. 3.6
For a given sample of organisms, a randomly
selected collection of DNA fragments is sequenced. The
resulting reads are then compared with one or more refer-
ence databases using an appropriate sequence comparison
program such as BLAST. The resulting data are processed
by MEGAN to produce an interactive analysis of the taxo-
nomical content of the sample. (Reproduced from http://
ab.inf.uni-tuebingen.de/software/megan5/)
datasets. This can be done either as a pie chart,
a bar chart or as a heat map. To construct such a
view using MEGAN, first, all the datasets must
be individually opened in the program. Using
a provided “compare” dialog, one can then set
up a new comparison document containing the
datasets of interest. The following figure shows
the taxonomic comparison of all eight marine da-
tasets. Here, each node in the NCBI taxonomy
is shown as a bar chart indicating the number of
reads (normalized, if desired) from each dataset
that have been assigned to the node (Fig.
3.7
).
hits that support the assignment of a read to a
node, and to export all reads (and their matches,
if desired) that were assigned to a specific part
of the NCBI taxonomy. Additionally, one can se-
lect a set of taxa and then use MEGAN to gen-
erate different types of charts for them. (http://
ab.inf.uni-tuebingen.de/software/megan5/ Dated
5/16/2014)
MEGAN5 also provides a number of new
plots and charts including a co-occurrence plot,
space-filling radial trees, etc.
b. Taxonomic analysis
MEGAN can be used to interactively explore the
dataset. The following figure shows the assign-
ment of reads to the NCBI taxonomy (Fig.
3.8
).
Each node is labeled by a taxon and the number
of reads assigned to the taxon. The size of a node
is scaled logarithmically to represent the number
of assigned reads. Optionally, the program can
also display the number of reads summarized by
a node, that is, the number of reads that are as-
signed to the node or to any of its descendants in
the taxonomy. The program allows one to inter-
actively inspect the assignment of reads to a spe-
cific node, to drill down to the individual BLAST
3.5
Conclusion
Pathway Analysis and Comparative Metagenom-
ics is a rapidly emerging field. Therefore, time
saving and comprehensible tools are needed to
study various sequences and datasets related to
microorganisms. In this chapter, we have dis-
cussed some really good, user-friendly tools which
provide a better understanding of relationships
among individual microorganisms' pathways as
well as in the community of microorganisms.
Pathway Tool, the combination of four different
softwares, provides the user with the facility for
making a whole new pathways-related database
Search WWH ::

Custom Search