what-when-how
In Depth Tutorials and Information
lined by active osteoblasts. Six cases showed mild fibro-
blast proliferation which was focal. Osteoclastic bone
resorption was present in cancellous bone.
20
In bone
specimens removed by core decompression, Hofman
et al. observed that the marrow was filled with a pale-
to dark-staining homogeneous fluid, consistent with
bone marrow edema. As also observed by McCarthy,
fragmented necrotic fat cells and the remnants of hemo-
poietic marrow showed necrosis. In some areas hemo-
poietic or fatty marrow had been replaced by fibroblast
proliferation, a fibrous matrix as noted by McCarthy,
and new dilated vessels, suggesting an active repair
process.
21
However, this picture is not that of avascular
necrosis.
Clinical laboratory results are normal with no specific
bone biomarker abnormalities including bone-specific
alkaline phosphatase, osteocalcin or c-telopeptide levels.
There are some patients who have elevated ESR, urinary
hydroxyproline and fluoride excretion.
3
Of interest, pro-
collagen type-I N-terminal propeptide and C-terminal
crosslinking telopeptide were 4×-16× higher in tissue
aspirates from the femoral head compared to the serum
levels.
22
IMAGING IN TRANSIENT
OSTEOPOROSIS
The radiographic evaluation of the painful hip or
other joint usually progresses from standard X-rays
to bone scintigraphy to MRI. MRI with contrast is the
modality of choice; isotope scintigraphy does not pro-
vide specific information in this situation.
Radiographic Evaluation
Standard radiographs show demineralization within
3 to 8 weeks after the onset of symptoms. Changes
apparently include patchy osteoporosis in the proxi-
mal femur without destruction of the joint, fractures,
or signs of avascular necrosis.
3
For this reason, radio-
graphs lack specificity for TMO and lack sensitivity as
changes are only apparent several weeks after symptom
onset.
23
Radiographs taken between week 4 and 16 may
reveal diffuse periarticular osteopenia involving the
upper femur (
Figure 39.3
).
22
Restoration of bone den-
sity is apparent on radiographs over a period of 6-12
months.
7
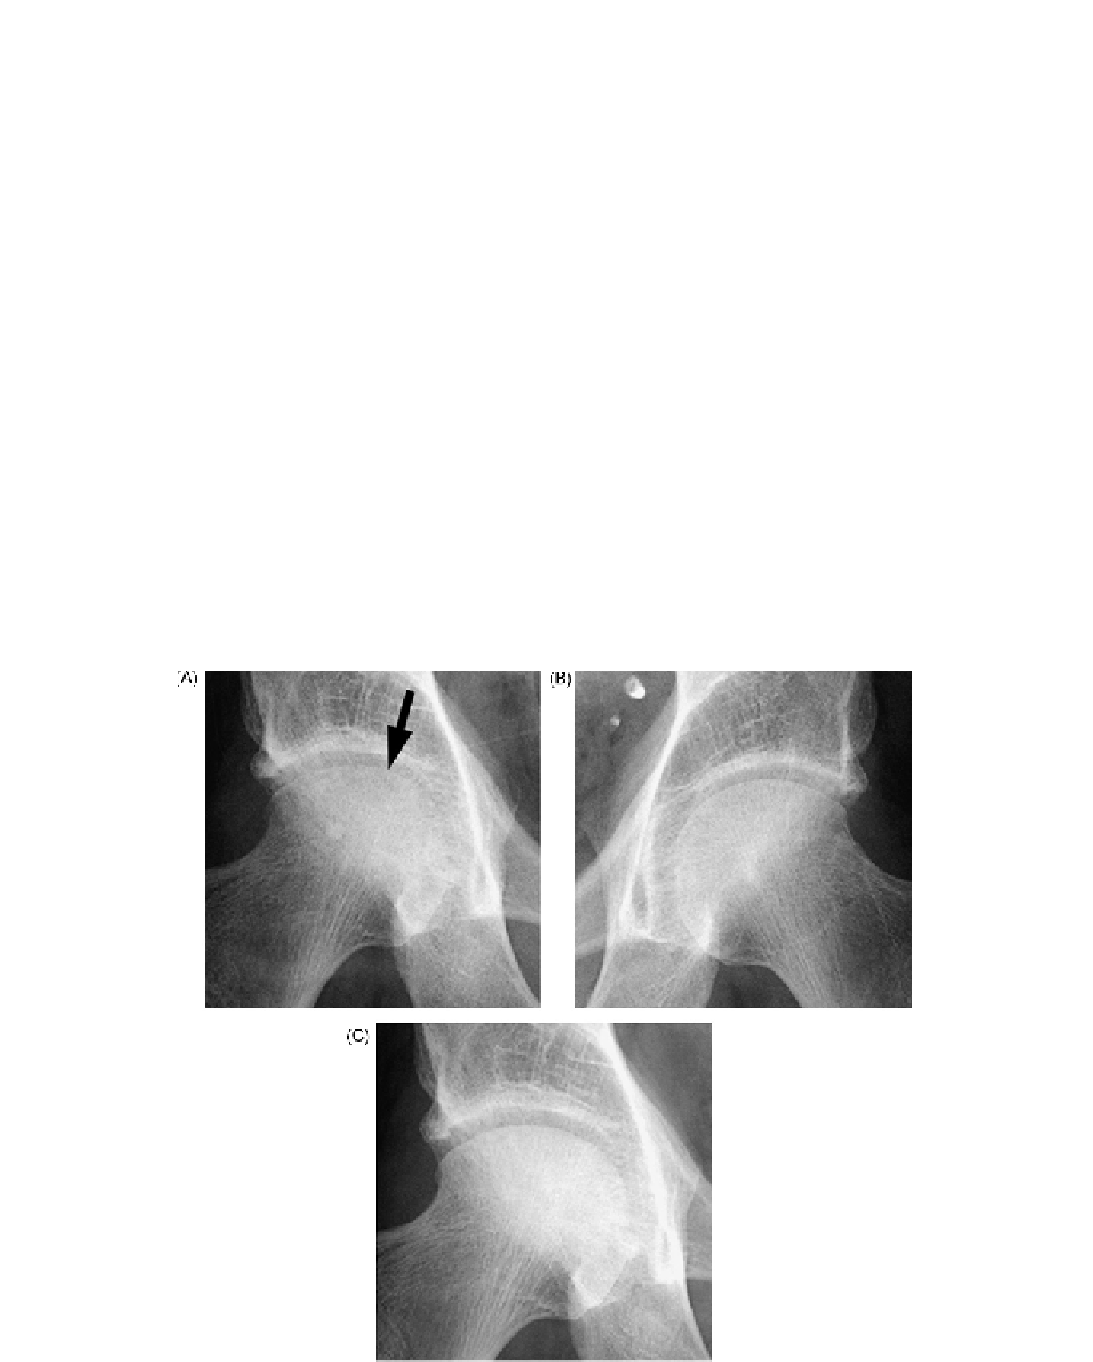
FIGURE 39.3
X-ray of transient edema showing subchondral line of bone resorption (arrow).