Extracting the Process Image
As you saw earlier in this topic, when a process is launched the executable file is read into memory. One of the pieces of information that you can get from the process details (via lspd.pl) is the offset within a Windows 2000 memory dump file to the Image Base Address. As you saw, lspd.pl will do a quick check to see whether an executable image can be found at that location. One of the things you can do to develop this information further is to parse the PE file header and see whether you can extract the entire contents of the executable image from the Windows 2000 memory dump file. Lspi.pl lets you do this automatically.
Lspi.pl is a Perl script that takes the same arguments as lspd.pl and lspm.pl and locates the beginning of the executable image for that process. If the Image Base Address offset does indeed lead to an executable image file, lspi.pl will parse the values contained in the PE header to locate the pages that make up the rest of the executable image file.
Okay, so you can run lspi.pl against the dd.exe process (with the PID of 284) using the following command line:
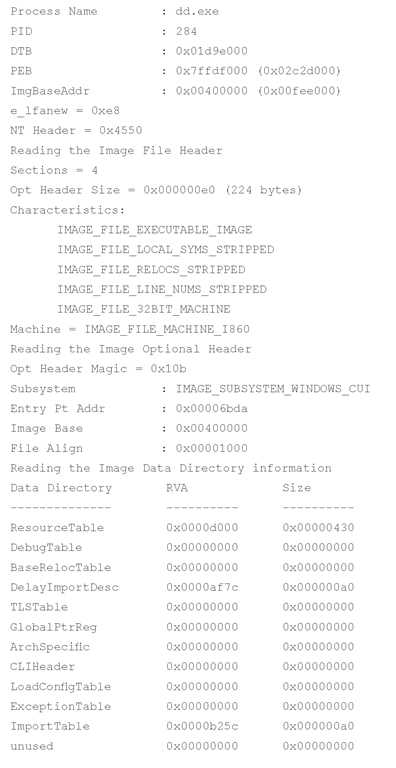
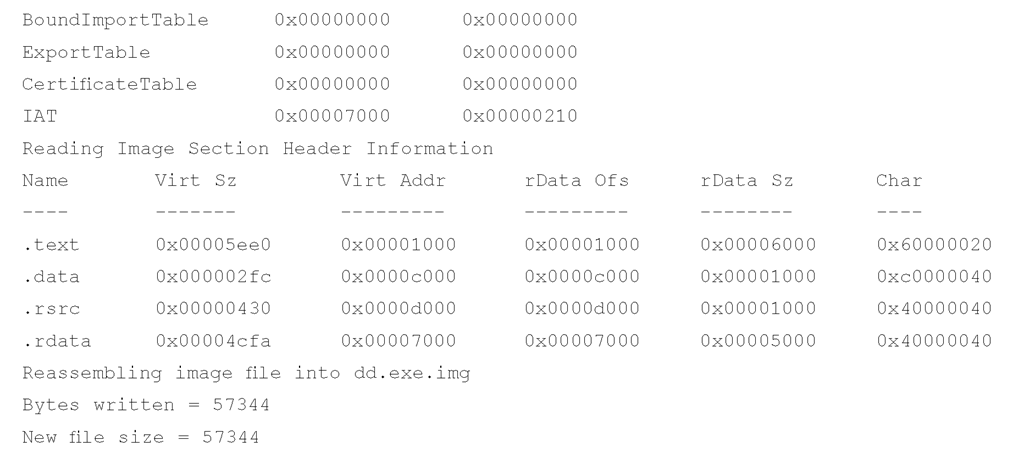
The output of the command appears as follows:
As you can see, the output of lspi.pl is pretty verbose, and much of the information displayed might not be readily useful to (or understood by) an investigator unless that investigator is interested in malware analysis.For now, the important elements are the table that follows the words "Reading Image Section Header Information" and the name of the file to which the executable image was reassembled. The section header information provides you with a road map for reassembling the executable image because it lets you know where to find the pages that make up that image file. Lspi.pl uses this road map and attempts to reassemble the executable image into a file. If it’s successful, it writes the file out to the file based on the name of the process, with .img appended (to prevent accidental execution of the file). Lspi.pl will not reassemble the file if any of the memory pages have been marked as invalid and are no longer located in memory (e.g., they have been paged out to the swap file, pagefile.sys). Instead, lspi.pl will report that it could not reassemble the complete file because some pages (even just one) were not available in memory.
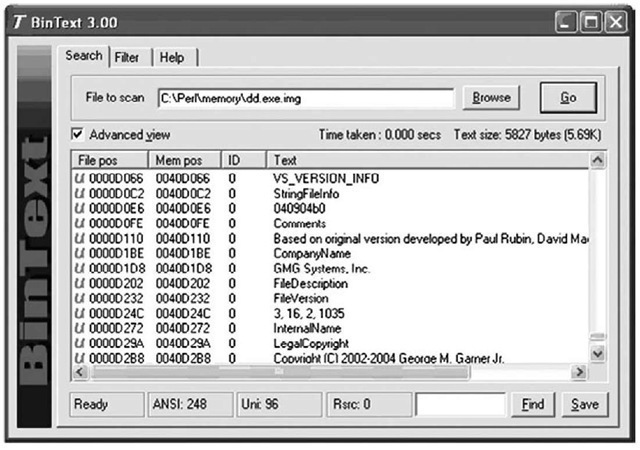
Now, the file you extract from the memory dump will not be exactly the same as the original executable file. This is because some of the file’s sections are writeable, and those sections will change as the process is executing. As the process executes, various elements of the executable code (addresses, variables, etc.) will change according to the environment and the stage of execution. However, there are a couple of ways you can determine the nature of a file and get some information about its purpose. One of those ways is to see whether the file has any file version information compiled into it, as is done with most files created by legitimate software companies. As you saw from the section headers of the image file, there is a section named .rsrc, which is the name often used for a resource section of a PE file. This section can contain a variety of resources, such as dialogs and version strings, and is organized like a file system of sorts. Using BinText, you can look for the Unicode string VS_VERSION_INFO and see whether any identifying information is available in the executable image file. Figure 3.21 illustrates some of the strings found in the dd.exe.img file using BinText.
Figure 3.21 Version Strings Found in dd.exe.img with BinText
Another method of determining the nature of the file is to use file hashing. You’re probably thinking, "Hey, wait a minute! You just said the file created by lspi.pl isn’t exactly the same as the original file, so how can we use hashing?" Well, you’re right … up to a point. We can’t use MD5 hashes for comparison, because as we know, altering even a single bit— flipping a 1 to a 0—will cause an entirely different hash to be computed. So, what can we do?
In summer 2006, Jesse Kornblum released a tool called ssdeep (http://ssdeep.sourceforge.net) that implements something called context-triggered piecewise hashing, or fuzzy hashing. For a detailed understanding of what this entails, be sure to read Jesse’s DFRWS 2006 paper ( http://dfrws.org/2006/proceedings/12-Kornblum.pdf ) on the subject. In a nutshell, Jesse implemented an algorithm that will tell you a weighted percentage of the identical sequences of bits the files have in common, based on their hashes, and computed by ssdeep. Because we know that in this case, George Garner’s version of dd.exe was used to dump the contents of RAM from a Windows 2000 system for the DFRWS 2005 Memory Challenge, we can compare the dd.exe.img file to the original dd.exe file that we just happen to have available.
Tip:
Responders may often be confronted with systems that employ some sort of encryption of either a specific volume or the entire disk. I’ve acquired a number of these systems, and when I have to conduct that acquisition with the intention of performing analysis (as opposed to simply acquiring an image), I’ve opted to perform a live acquisition of the hard drive. In May 2007, Brian Kaplan wrote a thesis paper titled "RAM is Key: Extracting Disk Encryption Keys from Volatile Memory." Along with that paper, Brian also released a proof of concept tool for extracting Pretty Good Privacy (PGP) Whole Disk Encryption (WDE) keys from a memory dump. The paper and proof of concept tool are available from www.andrew.cmu.edu/user/bfkaplan/#KeyExtraction.
Memory Dump Analysis and the Page File
So far, we’ve looked at parsing and analyzing the contents of a RAM dump in isolation— that is, without the benefit of any additional information. This means tools such as lspm.pl that rely solely on the contents of the RAM dump will provide an incomplete memory dump, because memory pages that have been swapped out to the page file (pagefile.sys on Windows systems) will not be incorporated in the resultant memory dump. To overcome this deficiency, in spring 2006 Nicholas Paul Maclean published his thesis work, "Acquisition and Analysis of Windows Memory" (at the time of this writing, I could not locate an active link to the thesis), which explains the inner workings of the Windows memory management system and provides an open source tool called vtop (written in Python) to reconstruct the virtual address space of a process.
In this paper, Jesse demonstrates the nuances of page address translation and how the page file can be incorporated into the memory analysis process to establish a more complete (and accurate) view of the information that is available.
Pool Allocations
When the Windows memory manager allocates memory, it generally does so in 4 KB (4096 bytes) pages. However, allocating an entire 4 KB page for, say, a sentence copied to the Clipboard would be a waste of memory. So, the memory manager allocates several pages ahead of time, keeping an available pool of memory. Andreas Schuster has done extensive research in this area, and even though Microsoft provides a list of pool headers used to designate commonly used pools, documentation for any meaningful analysis of these pools is simply not available. Many of the commonly used pool headers are listed in the pooltag. txt (www.microsoft.com/whdc/driver/tips/PoolMem.mspx) file provided with the Microsoft Debugging Tools, and Microsoft provides a Knowledge Base article that describes how to locate pool tags/headers used by third-party applications (http://support.microsoft.com/ default.aspx?scid=kb;en-us;298102). Andreas used a similar method to determine the format of memory pools used to preserve information about network connections in Windows 2000 memory dumps (http://computer.forensikblog.de/en/2006/07/finding_network_socket_ activity_in_pools.html); he searched for the pool header in the tcpip.sys driver on a Windows 2000 system and was able to determine the format of network connection information within the memory pool.
The downside to searching for memory pool allocations is that although the pool headers do not seem to change between versions of Windows, the format of the data resident within the memory pool changes, and there is no available documentation regarding the format of these memory pools.
Summary
By now it should be clear that you have several options for collecting physical or process memory from a system during incident response. In last topic, we examined a number of tools for collecting various portions of volatile memory during live response (processes, network connections, and the like), keeping in mind that there’s always the potential for the Windows API (on which the tools rely) being compromised by an attacker. This is true in any case where live response is being performed, and therefore we might decide to use multiple disparate means of collecting volatile information. A rootkit can hide the existence of a process from most tools that enumerate the list of active processes (tlist.exe, pslist.exe), but dumping the contents of RAM will allow the investigator to list active and exited processes as well as processes hidden using kernel-mode rootkits.
Solutions Fast Track
Collecting Process Memory
- A responder may be presented with a situation in which it is not necessary to collect the entire contents of physical memory; rather, the contents of memory used by a single process would be sufficient.
- Collecting the memory contents of a single process is an option that is available only for processes that are seen in the active process list by both the operating system and the investigator’s utilities. Processes hidden via some means might not be visible, and the investigator will not be able to provide the process identifier to the tools he is using to collect the memory used by the process.
- Dumping process memory allows the investigator to collect not only the memory used by the process that can be found in RAM, but also the memory located in the page file.
- Once process memory has been collected, additional information about the process, such as open handles and loaded modules, can then be collected.
Dumping Physical Memory
- Several methodologies are available for dumping the contents of physical memory. The responder should be aware of the available options as well as their pros and cons so that she can make an intelligent choice as to which methodology should be used.
- Dumping the contents of physical memory from a live system can present issues with consistency because the system is still live and processing information while the memory dump is being generated.
- When dumping the contents of physical memory, both the responder and the analyst must keep Locard’s Exchange Principle in mind.
Analyzing a Physical Memory Dump
- Depending on the means used to collect the contents of physical memory, various tools are available to extract useful information from the memory dump. The use of strings.exe, BinText, and grep with various regular expressions has been popular, and research conducted beginning in spring 2005 reveals how to extract specific processes.
- Dumps of physical memory contain useful information and objects such as processes, the contents of the Clipboard, and network connections.
- Continuing research in this area has demonstrated how the page file can be used in conjunction with a RAM dump to develop a more complete set of information.
Frequently Asked Questions
Q: Why should I dump the contents of RAM from a live system? What use does this have, and what potentially useful or important information will be available to me?
A: As we discussed in next topic, a significant amount of information available on a live system can be extremely important to an investigation. This volatile information exists in memory, or RAM, while the system is running. We can use various third-party tools to collect this information, but it might be important to collect the entire contents of memory so that we not only have a complete record of information available, but also can "see" things that might not be "visible" via traditional means. You might also find information regarding exited processes as well as process remnants left over after the system was rebooted.
Q: Once I’ve dumped the contents of RAM, what can I then do to analyze them?
A: Investigators have historically used standard file-based search tools to "analyze" RAM dumps. Strings.exe and grep searches have been used to locate passwords, e-mail addresses, URLs, and the like within RAM dumps. Tools now exist to parse RAM dumps for processes, process details (command lines, handles), threads, and other objects as well as extract executable images, which is extremely beneficial to malware analysis as well as more traditional computer forensic examinations.
Q: I have an issue in which a person is missing. On examination of a computer system in his home, I found an active instant messaging (IM) application window open on the desktop. When I scrolled back through the window and reviewed the conversation, it became clear to me that useful information could be available from that process. What can I do?
A: If the issue you’re faced with is primarily one that centers around a single visible process, dumping the entire contents of physical memory might not be necessary. One useful approach would be to dump the contents of process memory, then use other tools to extract specific information about the process, such as loaded modules, the command line used to launch the process, or open handles. Once all the information is collected, the next step could be to save the contents of the IM conversation. After all pertinent information has been collected, searching the contents of process memory for remnants of a previous conversation or other data might provide you with useful clues.


