Memoryze
Mandiant’s Memoryze tool provides the analyst with the ability to parse and analyze memory dumps from several versions of Windows. To install Memoryze, download the MSI file from the Mandiant Web site (mentioned previously in this topic) and install it. I chose to install it in the D:\Mandiant directory. Then, to install Audit Viewer, download the zipped archive, and be sure that you’ve downloaded the dependencies (i.e., Python 2.5 or 2.6, wxPython GUI extensions) as described at the Mandiant Web site (if you’ve already installed and tried Volatility, you already have Python installed). I chose to unzip the Audit Viewer files into the directory D:\Mandiant\AV
Mandiant’s Audit Viewer is a GUI tool that provides the analyst with a graphical interface into the XML files created by using Memoryze to parse memory dumps. To launch Audit Viewer, double-click the AuditViewer.py file in the directory where you unzipped the archive downloaded from the Mandiant site. As you’ve installed the wxPython modules, you will see the Audit Viewer GUI open, at which point you will need to configure the tool by changing the Memoryze Install Directory (if necessary), selecting the Running on image checkbox, and providing the Path to image file, as Figure 3.11 illustrates.
Figure 3.11 Audit Viewer User Interface Showing Configuration Changes
Once you’ve made the necessary changes, click the Open Audit button at the top of the Audit Viewer user interface, and navigate to the directory where the XML audit files were created. Once the directory has been selected, Audit Viewer will parse the available files and populate the Processes tree in the user interface, as shown in Figure 3.12.
Figure 3.12 Audit Viewer User Interface Showing Processes Tree
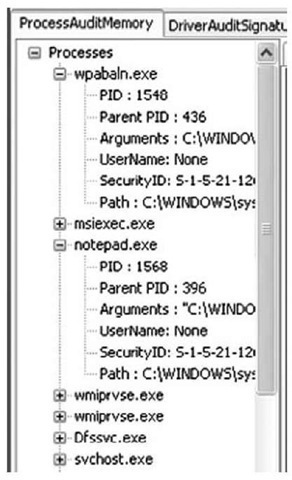
Figure 3.12 also illustrates two processes expanded to show the PID, PPID, arguments (or command line), as well as other information about each process. To dig deeper into each process, double-click the process name in the Processes tree, and then view the contents of the various tabs (Files, Directories, etc.) visible in the Audit Viewer user interface, as Figure 3.13 illustrates.
Figure 3.13 Audit Viewer User Interface Showing Process Detail Tabs
Memoryze and Audit Viewer provide a number of additional options to the analyst. For example, based on your findings in Audit Viewer, you may decide that you’d like to acquire an image of a process executable from the image file. To do so, use the processdd.bat batch file as follows:
You can also use other batch files provided with Memoryze to perform rootkit and hook detection, as well as search for drivers (www.mandiant.com/software/usememoryze.htm). The Mandiant M-unition blog (http://blog.mandiant.com/) provides additional examples of how to use Memoryze and Audit Viewer, such as how to integrate the two tools into Guidance Software’s EnCase forensic analysis application.
HBGary Responder
HBGary’s Responder product is a commercial GUI memory dump analysis tool that is described on the company Web site (www.hbgary.com) as a "live memory and runtime analysis software suite used to detect, diagnose, and respond to today’s advanced computer threats". As with other analysis tools, the Responder products (Professional and Field editions) allow a responder to parse and analyze a memory dump without having to utilize the potentially compromised or infected system’s API. Although Responder was written with malware analysis in mind, it is also a fast and capable tool that provides a great deal of functionality with respect to incident response, and is very easy for responders to use to get the information they need quickly.
Note
An evaluation copy of Responder Professional Edition 1.3.0.377 was used in the examples listed in this section of the topic. However, the functionality presented and observed in this section is inherent to both the Professional and Field Edition products. We will not conduct a comprehensive review of the Responder Professional product (the Professional product includes binary disassembly, control flow graphing, and reverse engineering capabilities), as doing so is beyond the scope of this topic and we are focusing on aspects of the product that most directly pertain to the memory dump analysis pursuant to incident response activities.
All you need to do to begin analyzing a memory dump with Responder Pro is to create a case and then import a physical memory snapshot by selecting File from the menu bar, then Import, and then Import a Physical Memory Snapshot. For this example, we’ll use the first Windows 2000 memory dump from the DFRWS 2005 Memory Challenge; however, like Memoryze, Responder works with memory dumps from Windows 2000, all the way up through the latest versions of Windows.
When importing a memory dump "snapshot" file into a Responder case, an option is available to "extract and analyze all suspicious binaries". The rules that the Responder product uses to determine what constitutes "suspicious" are in a text-based file that you can open and review, and to which you can even add or remove comments, reducing false positives; you also can add entries to the file based on experience, thereby increasing the product’s effectiveness.
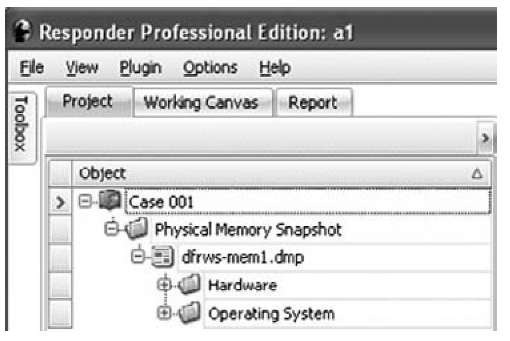
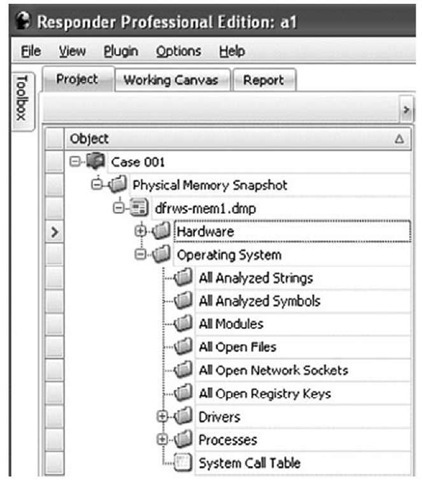
Once the memory dump file has been imported and parsed, Responder will show in the left-hand pane the memory dump file with two folders, Hardware and Operating System, as Figure 3.14 illustrates.
Figure 3.14 Memory Dump File Imported into a Responder Project
Expanding the folder beneath the Hardware folder will display the Interrupt Table. Expanding the Operating System folder will display a great deal of additional information, including Processes and All Open Network Sockets (in part, what responders may be most interested in), as shown in Figure 3.15.
Figure 3.15 Expanded Operating System Folder in Responder User Interface
You can then expand the Processes folder to see all of the active processes extracted from the memory dump, or double-click the Processes folder to have the processes and detailed information about each process visible in the right-hand pane of the Responder user interface, as shown in Figure 3.16.
Figure 3.16 Excerpt of Processes Listed with Details in Responder User Interface
The Responder user interface provides a good deal of information that is immediately useful to you. You can also adjust the columns by selecting them and dragging them to a new location within the same view pane. Also, you can export information (this functionality is not supported in the evaluation version) from the view pane to various formats by clicking the appropriate icon at the top of the view pane, as Figure 3.17 illustrates.
Figure 3.17 Selecting to Export Data in Responder User Interface 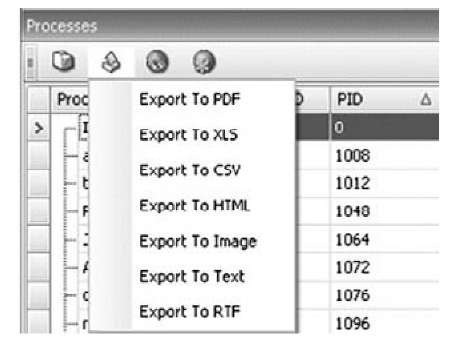
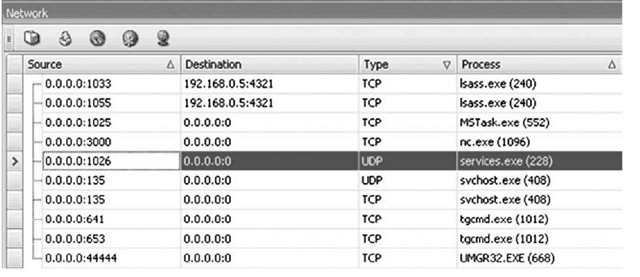
Double-clicking the All Open Network Sockets folder will open the Network tab in the right-hand view pane, similar to the output of netstat.exe, as shown in Figure 3.18.
Figure 3.18 Open Network Sockets from Memory Dump in Responder User Interface
You can also view the open file handles for all processes by double-clicking the All Open Files folder, as Figure 3.19 illustrates.
Figure 3.19 Partial Listing of Open Files from Responder User Interface
You can view open file handles for a specific process by expanding the tree for each process and selecting Open Files. You can do the same for open network sockets and open Registry keys.
In addition to being able to quickly view all of this information, both on a memory dump-wide format as well as on a per-process format, you can parse executable images (.exe and .dll files) for strings, as well as search for specific items within the memory dump using substrings, regular expressions, or exact matches. Having the ability to sort items visible in columns also allows you to identify suspicious processes or modules (i.e., DLLs) much more quickly.
Parsing Process Memory
We discussed the need for context for evidence earlier in this topic, and you can achieve this, in part, by extracting the memory used by a process. In the past, investigators have used tools such as strings.exe or grep searches to parse through the contents of a RAM dump and look for interesting strings (passwords), IP or e-mail addresses, URLs, and the like. However, when you’re parsing through a file that is about half a megabyte in size, there isn’t a great deal of context to the information you find. Sometimes an investigator will open the dump file in a hex editor and locate the interesting string, and if she saw what appeared to be a username nearby, she might assume that the string is a password. However, investigating a RAM dump file in this manner does not allow the investigator to correlate that string to a particular process.Had we collected the contents of physical memory during the example, we would have had no way to definitively say that a particular IP address or other data, such as a directory listing, was tied to a specific event or process. However, if we use the information provided in the process structure within memory and locate all the pages the process used that were still in memory when the contents were dumped, we could then run our searches and determine which process was using that information.
The tool lspm.pl allows you to do this automatically when working with Windows 2000 memory dumps. Lspm.pl takes the same arguments as lspd.pl (the name and path of the dump file, and the physical offset within the file of the process structure) and extracts the available pages from the dump file, writing them to a file within the current working directory. To run lspm.pl against the dd.exe process, use the following command line:
The output looks like this:
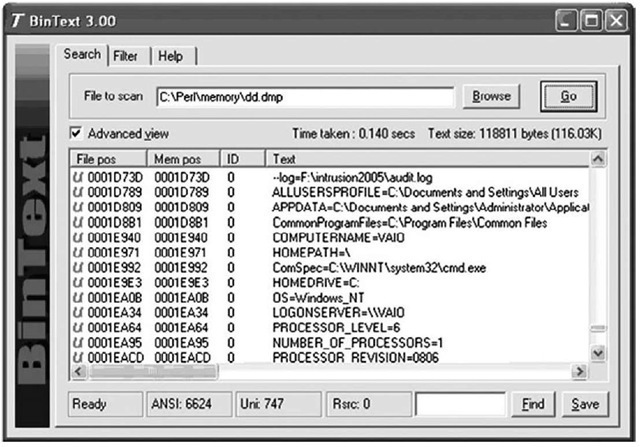
Now you have a file called dd.dmp that is 1,523,712 bytes in size and contains all the memory pages (372 in total) for that process that were still available when the dump file was created. You can run strings.exe or use BinText (illustrated in Figure 3.20) from Foundstone. com to parse through the file looking for Unicode and ASCII strings, or run grep searches for IP or e-mail addresses and credit card or Social Security numbers.
Figure 3.20 Contents of Process Memory in BinText
In Figure 3.20, you can see some of the Unicode strings contained in the memory used by the dd.exe process, including the name of the system and the name of the LogonServer for the session. All of this information can help further your understanding of the case; an important aspect of this capability is that now you can correlate what you find to a specific process.
Volatility incorporates this same functionality in the memdmp command. As mentioned previously in the topic, you can use the volatility memdmp command to dump the addressable memory for a process from a Windows XP memory dump, as follows:
Tip::
You can use Volatility to collect process memory for processes that are hidden by rootkits, even those hidden using direct kernel object manipulation (DKOM) techniques.Specifically, DKOM techniques "unlink" the EProcess block for the hidden process from the doubly linked active process list that the operating system "sees." However, using Volatility to examine a Windows XP raw memory dump or hibernation file, you can search for processes that are not part of that doubly linked list (discussed later in the topic), and then use the memdmp command to retrieve the memory used by the process from the memory dump file.



![tmp13-125_thumb[2][2][2][2] tmp13-125_thumb[2][2][2][2]](http://what-when-how.com/wp-content/uploads/2011/09/tmp13125_thumb2222_thumb.jpg)
