Winen
Guidance Software also released its own tool for collecting the contents of physical memory, called winen.exe. Like some of the other tools, winen.exe is a CLI tool, but unlike the other tools, the memory dump is not collected in raw, dd-style format; instead, it is collected in the same proprietary imaging format used by the EnCase image acquisition tool, commonly referred to as Expert Witness Format (or EWF, for short). Most available analysis tools require that the memory dump be in a raw, dd-style format, so memory dumps collected using winen.exe must be converted to a raw format prior to being parsed. As Lance Mueller points out in his blog (www.forensickb.com/2008/06/new-version-of-encase-includes-stand.html), you can run winen.exe by simply providing various options at the console (i.e., typing winen at the command prompt and then providing responses to the queries) or by providing the path to a configuration file with the necessary information via the —f switch. Winen.exe has a total of six required options, the settings for which can be provided via the command line or in a configuration file: the path to the output file(s), the compression level, the examiner’s name, the evidence name, the case number, and the evidence number. An example configuration file is included in the home directory when you download and install EnCase.
Richard McQuown provides additional information about the use of winen.exe in his ForensicZone blog (http://forensiczone.blogspot.com/2008/06/winenexe-ram-imaging-tool-included-in.html), as well as a link to a user manual file for winen.exe (you must have access to the EnCase User Forum and be logged in to obtain the PDF document at https:// support.guidancesoftware.com/forum/downloads.php?do=file&id=478).
You can then convert the resultant memory dump to a raw format by opening the memory dump file in FTK Imager and choosing Create Disk Image from the menu (http://windowsir.blogspot.com/2008/06/memory-collection-and-analysis-part-ii.html), or by opening the memory dump in EnCase and choosing Copy/UnErase from the EnCase menu.
Guidance also has a version of winen.exe for 64-bit versions of the Windows operating system, called winen64.exe. As with the 32-bit version of the tool, winen64.exe allows a responder to dump the contents of physical memory in an EWF format dump file.
Fastdump
Consulting company HBGary released a copy of its tool for collecting the contents of physical memory, called fastdump (www.hbgary.com/download_fastdump.html). Although fastdump. exe (Version 1.2 is available at the time of this writing) is free, as with Nigilant32 and some of the other available tools it is not able to collect memory contents from Windows 2003 SP1 and later systems, including Vista. You can use this tool only to collect the contents of physical memory from Windows XP and Windows 2003 (no service packs installed) systems.
To address this issue, HBGary also released a commercial version of the tool, called FastDump Pro (fdpro.exe), which is available from the same Web page as fastdump.exe, albeit for a fee. The commercial version supports all versions of Windows, including 32- and 64-bit versions, and will also reportedly dump memory from systems with more than 4 GB of RAM.
Fdpro.exe also has an .hpak-style format, which is described as follows:
"HPAK is an HBGary proprietary format which is capable of several key features, namely the ability to store and archive the RAM and Pagefile in a single archive. HPAK format also supports compression using the gzip format. This is useful during instances where space on the collecting device/system is limited."
One of the limitations of most of the available tools for dumping physical memory is that they allow access only to physical memory, and do not incorporate the page file. Not only does fdpro.exe provide access to a wide range of Windows operating systems (including 64-bit versions) and memory capacities (i.e., greater than 4 GB), but also (as with Mandiant’s Memoryze tool) the tool will incorporate the page file in the collection process, which then allows that data to be incorporated into the analysis process, as well (we will discuss the HBGary Responder product later in this topic). As you will see later in this topic, contents of memory that have been swapped out to the page file may contain information pertinent to your response and analysis.
Warning::
It is important to point out that proprietary formats for data collection often lead to the requirement to use one particular tool for data analysis. Memory dumped using winen.exe, for example, must be converted to a raw format prior to being analyzed using other tools (although EnScripts are available to perform some limited parsing of the dump file). The same holds true with HBGary’s .hpak format, as well; at this point, only HBGary’s Responder product can be used to analyze an .hpak format memory dump. This is something you must keep in mind when deciding which tool to use.
F-Response
Finally, 2008 heralded the coming of a new age in incident response with Matt Shannon’s release of F-Response. F-Response is an acquisition-tool-agnostic framework that uses the iSCSI protocol to provide raw access to disks over the network. Matt designed and wrote F-Response so that the access is read-only; write operations to the remote disk are buffered and silently dropped. The three editions of F-Response (Field Kit, Consultant, and Enterprise) are all deployed differently, but all allow you to "see" drives on remote systems (e.g., in another room, on another floor, or even in another building) as mounted drives on your own system. F-Response is acquisition-tool-agnostic in the sense that once you’re connected to the remote system and can "see" the drive, you can use any tool you want (dd.exe, ProDiscover, FTK Imager, etc.) to acquire an image of that drive. You can deploy F-Response on Mac OS X, Linux, and Windows systems, and on Windows systems it has the added benefit of providing remote, read-only access to physical memory. At the SANS Forensic Summit in October 2008, during his presentation with Aaron Walters, Matt announced the release of F-Response 2.03, which provides remote, real-time, read-only access to a Windows system’s physical memory, for all versions of Windows, including XP and Vista. Once the connection to the remote system is set up, a responder can then use tools such as dd.exe or FTK Imager to acquire a copy of physical memory.
F-Response’s capability (Version 2.06 beta was used in this example) for obtaining a copy of physical memory from a remote Windows system has tremendous implications for incident response, particularly when deploying the Enterprise Edition (see the "F-Response Enterprise Edition (EE)" sidebar for more information on deploying this capability in an enterprise environment). Matt has several videos linked to the F-Response blog (www.f-response.com/index.php?option=com_content&task=blogsection&id=4& Itemid=9) that demonstrate uses and aspects of the F-Response tool, such as illustrating how to acquire specific data, for example, by accessing a live Microsoft Exchange server.
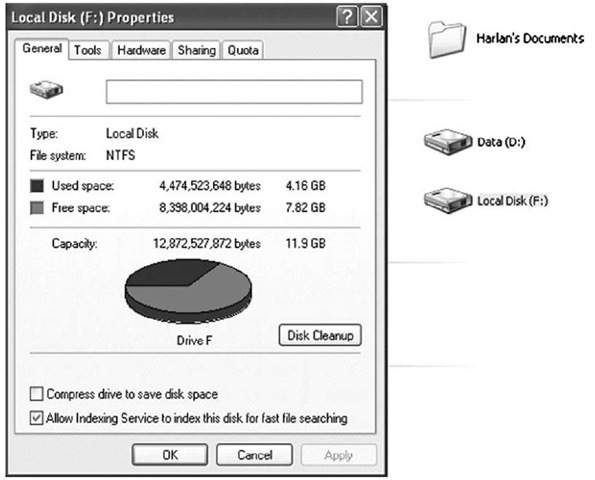
At the SANS Forensic Summit in October 2008, Matt announced that F-Response would provide remote, read-only access to drives on Windows systems and to physical memory. Upon a successful connection, remote drives appear on the responder’s system with the familiar drive icon, as Figure 3.3 illustrates.
Figure 3.3 Remote Windows System Drive Connected to As F:\
Tools & Traps…
F-Response Enterprise Edition (EE)
You can deploy F-Response Enterprise Edition (EE) agents in a proactive fashion. Deploying the EE agents ahead of time can significantly speed response time, as the agents install as a Windows service, but by default do not start automatically when the system is booted.
You also can install the agent in a stealthy manner, using tools such as psexec.exe (http://technet.microsoft.com/en-us/sysinternals/bb897553.aspx) or xcmd.exe (http:// feldkir.ch/xcmd.htm). The PDF document "Remote (Stealth) Deployment of F-Response EE on Windows Systems," located in the ch3 directory on the media that accompanies this topic, clearly illustrates the necessary steps for deploying F-Response EE remotely (or in a stealthy manner) over the network.
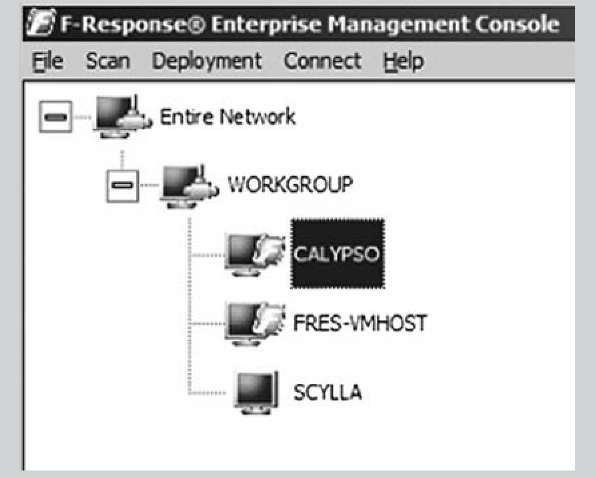
In spring 2009, Matt Shannon released the F-Response Enterprise Management Console, or FEMC. The FEMC is a GUI-based tool that completely removes all of the effort required to manually deploy the Enterprise Edition. Clicking through the user interface, a responder (or consultant) can locate systems in the domain (or workgroup) on which to install F-Response EE, as Figure 3.4 illustrates.
Figure 3.4 FEMC User Interface Populated with Systems
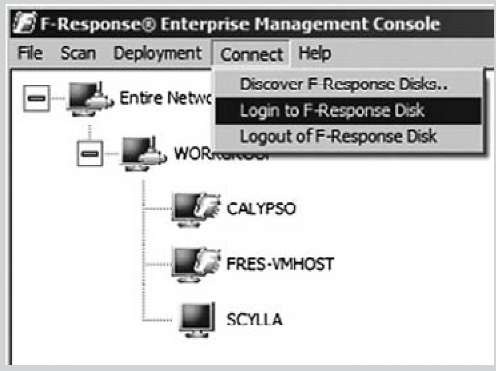
Once systems have been located and selected, deploying and starting the F-Response service is nothing more than a couple of mouse clicks away, as illustrated in part in Figure 3.5. This is the case whether you want to install it on one system or on a dozen systems.
Figure 3.5 Logging in to F-Response EE via the FEMC User Interface
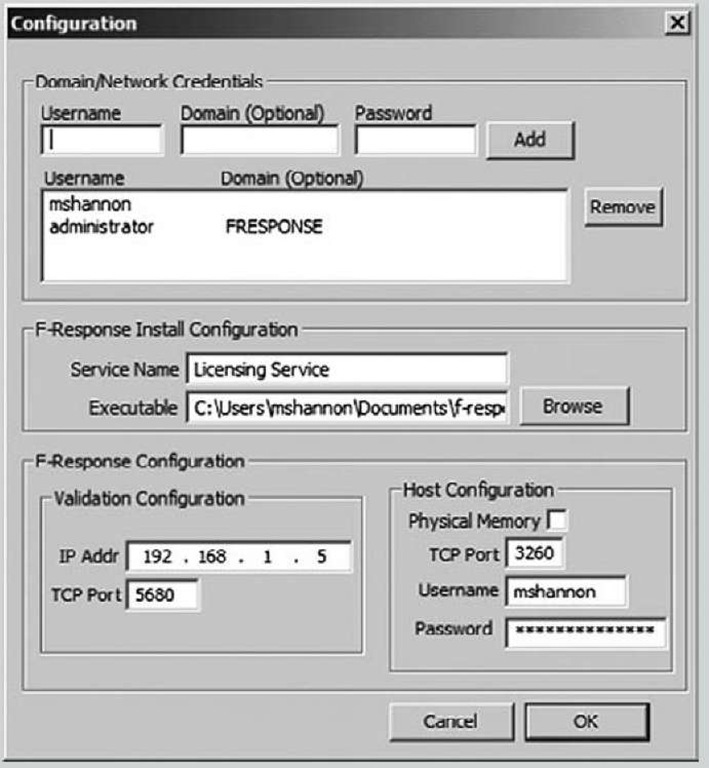
All the responder needs to do is select the systems onto which she wishes to deploy F-Response, and then with a couple of mouse clicks deploy the agent automatically. Even the configuration of the .ini file is handled automatically through the user interface, as Figure 3.6 illustrates.
Figure 3.6 Configuring F-Response EE via the FEMC User Interface
Information entered into the Domain/Network Credentials section of the Configuration dialog shown in Figure 3.6 is available throughout the duration of the session, but is not saved or preserved in any way when the FEMC is closed.
Working with the FEMC, it actually took me more effort to play BrickBreaker on my BlackBerry than it does to deploy F-Response EE across several systems, connect to each, and then completely uninstall the agent. The FEMC pushes the functionality of an extremely powerful and valuable tool forward by a quantum leap (not to take anything away from Scott Bakula…).
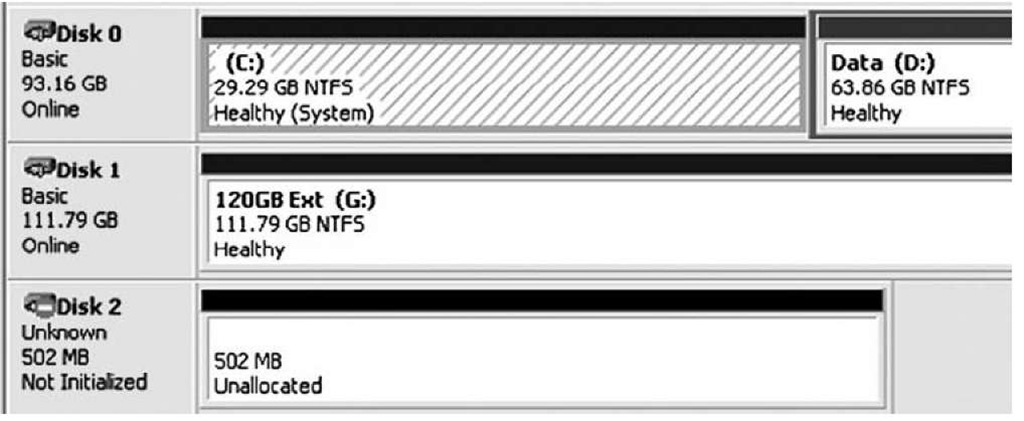
As physical memory (RAM) does not contain a partition table, the responder’s system will not recognize the connection to the remote system’s physical memory as a drive. However, the connection can be seen through the Disk Management Microsoft Management Console (MMC), as Figure 3.7 shows.
Figure 3.7 F-Response EE Connection to Remote RAM Seen via Disk Management MMC
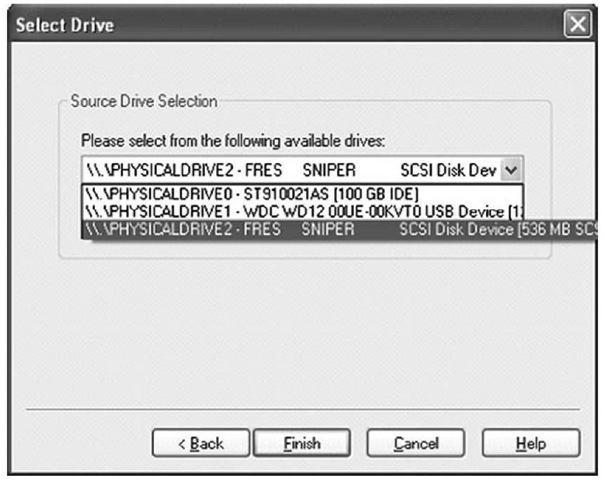
Once the connection to the remote system’s RAM has been verified, you can use tools such as FTK Imager to perform a memory dump. Figure 3.8 illustrates selecting the remote system’s RAM via FTK Imager.
Figure 3.8 Selecting a Remote System’s RAM via FTK Imager
Figure 3.9 illustrates the selected RAM from Figure 3.8 as it appears in the FTK Imager Evidence Tree.
Figure 3.9 Selected RAM in FTK Imager Evidence Tree
The RAM from the remote system can now be acquired using FTK Imager. Other tools can also be used; F-Response is a tool-agnostic framework, as it does not require that you use a specific tool. A responder can use EnCase, X-Ways Forensics, or even versions of dd.exe to dump RAM from the remote system. Again, the connection is read-only, and as illustrated in Figures 3.8 and 3.9, the remote system’s RAM appears on the responder’s system as a \\.PhysicalDrive object (i.e., \\.PhysicalDrive2 or \\.PhysicalDrive3).
Note
At the SANS Forensic Summit in October 2008, Aaron Walters and Matt Shannon gave a presentation that incorporated the use of F-Response and the Volatility Framework in something called "Voltage" (http://volatilesys-tems.blogspot.com/2008/10/voltage-giving-investigators-power-to.html). Although not available at the time of this writing, Voltage is described as providing an unprecedented level of real-time, read-only, remote access, automation, and visualization to temporally relevant information that has not been available to date. For all the fancy words, Voltage provides a responder with the capability to quickly reach out to remote systems, identify systems that may have malware installed and running, and then collect a sample of physical memory, all without modifying the artifacts on the remote system.
Section Summary
John Sawyer posted to the SANS Forensics blog (http://sansforensics.wordpress. com/2008/12/13/windows-physical-memory-finding-the-right-tool-for-the-job/) on December 13, 2008, listing some of the various tools available for collecting (as well as analyzing) memory dumps from Windows systems, along with brief descriptions of each of them. In addition to John’s blog post, other posts (to blogs and discussion lists) have made comments and addressed concerns about the availability and use of the various tools for dumping memory from Windows systems.This very thing happened between the time I submitted this topic for technical review and the time I received the tech editor’s comments—in the ensuing time, HBGary had released FastDump Pro and announced its availability to the public. I firmly believe that the landscape of memory dumping (and analysis) tools will change, doing so in relatively short order.
So far in this section you’ve seen some of the tools available for dumping the contents of physical memory from Windows systems, but little else. In an effort to provide more of a side-by-side comparison of some of these tools, I ran some of my own limited testing. Using the command lines (in the case of Memoryze, the memorydd.bat file) for each tool discussed previously in this topic that might be run from a CD or USB thumb drive, I ran each of them (with the exception of winen.exe) on a Dell Latitude D820 system with 4 GB of RAM installed, running Windows XP Service Pack 3. My testing process was to simply boot the system, run one of the tools, and once the tool had completed its dump of memory, reboot the system to run the next tool. In doing so, I saved the memory dumps so that I could see the sizes of each of them in relation to the dumps produced by other tools; my final results appear as follows, listed by the size in bytes and the output filename:
As you can see, I included the name of the tool and some additional identifying information from the command line in the name of the output dump file. Also, it’s clear that there are some variations in the sizes of the resultant dumps, likely due to the process each tool used. As expected, the exception to this is the .hpak format dump file produced by FastDump Pro, as the -page switch had been used to incorporate the page file in the dump process. The file size would likely have been significantly larger had there been greater activity on the system, and had the system been allowed to run longer.
It should be clear at this point that the tool you should use to collect the contents of physical memory really depends on a number of factors, including the version of Windows (not only Windows XP versus Vista, but also 32- versus 64-bit), the amount of physical memory installed in the system, and your analysis tools.
Warning::
As with using any tools that you’ve downloaded from the Internet, be sure that you’ve tested the tools and you’ve read and that you understand the license agreement regarding their use. Some tools, although extremely powerful and useful, cannot be used by consultants. Also, you need to be aware of the artifacts left by various tools.Winen.exe does something similar, in that it will write its driver (winen_.sys) to the same directory from which the file is run, and will create a Services subkey within the Registry. The key here, as with all live-response activities, is not to avoid using a tool because it leaves "footprints" or artifacts of its use, but rather to understand this fact and incorporate that understanding into your methodology and documentation.

![tmp13-84_thumb[2] tmp13-84_thumb[2]](http://what-when-how.com/wp-content/uploads/2011/09/tmp1384_thumb2_thumb.jpg)
