System Time
One of the first pieces of information you want to collect when you’re investigating an incident is the system time. This will give a great deal of context to the information collected later in the investigation, and will assist in developing an accurate timeline of events that have occurred on the system.
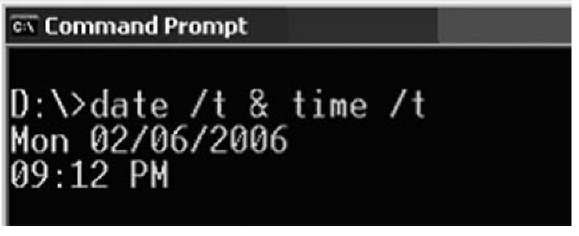
Figure 1.1 illustrates the most well-known means of displaying the system time.
Figure 1.1 Displaying the System Date and Time on Windows XP
Notes from the Underground
Getting the System Time
You can get the system time using a simple Perl script, such as:
This script displays the system time in local format, based on the time zone and daylight saving information that the system has set, but the time can also be displayed in GMT format using a script such as:
The systime.pl Perl script located on the media that accompanies this topic demonstrates how the system time can be retrieved using the Windows application program interface (API). The systime.exe file is a stand-alone executable compiled from the Perl script using Perl2Exe.
Another method for retrieving this information is to use Windows Management Instrumentation (WMI) to access the Win32_OperatingSystem class and display the LocalDateTime value.
Not only is the current system time important for the investigator, but the amount of time that the system has been running, or the uptime, can also provide a great deal of context to the investigation. For example, noting the amount of time the system has been running compared to the amount of time a process has been running can provide you with an idea of when an exploit or compromise attempt might have been successful (more on retrieving information about processes later in this topic).
In addition, the investigator should also record the real time, or wall time, when recording the system time. Having both allows the investigator to later determine whether the system clock was inaccurate. Information about the "clock skew" provides a better understanding of the actual time at which events recorded in log files occurred. This information can be invaluable when you’re trying to combine time stamps from more than one source.
Another piece of time-related information that could be important is the time zone settings for the computer. Windows systems using the NTFS file system store file times in Universal Coordinated Time, or UTC for short, which is analogous to Greenwich Mean Time (GMT) format. Systems using the FAT file system store file times based on the local system time. This is more important to keep in mind during postmortem analysis (discussed later in this topic), but it can become extremely important when you’re performing live response remotely, particularly across time zones.
Tools & Traps
Tools and Licensing
Throughout this topic, we’re going to be discussing various tools that you can use for data collection from live systems. Some of these tools are native to the system, and others are third-party tools available on the Internet. In most cases, I try to provide links to where you can find those tools, but Web links come and go. One thing you need to be familiar with when using third-party tools are the licenses you agree to when you download the tool for use. Some license agreements state that you can use the tool all you want, unless you are a consultant and are using the tool in your capacity as a consultant. The tools available from Microsoft/Sysinternals have been updated over the past year or so to include a graphical end-user license agreement (EULA) dialog the first time you run the tool. This means that not only do you have to accept the EULA, but if you’re running the tool in a batch file on a system on which you’ve never run that tool, you need to be sure to include the /accepteula switch in the command line. If you don’t, the batch file will hang. Also, when you accept the EULA, through either the dialog or the command-line switch, the tool will create a Registry key to record the fact that you accepted the EULA.
Logged-on Users
During an investigation, you may want to know which users are logged on to the system. This includes people who are logged on locally (via the console or keyboard) as well as remotely (such as via the net use command or via a mapped share). This information allows you to add context to other information you collect from a system, such as the user context of a running process, or the owner or last access times of a file. This information is also useful to correlate against the Security Event Log, particularly if the appropriate auditing (auditing of logon and logoff events, etc.) has been enabled.
PsLoggedOn
Perhaps the best-known tool for determining logged-on users is psloggedon.exe (http:// technet.microsoft.com/en-us/sysinternals/bb897545.aspx). This tool shows the investigator the name of the user logged on locally (at the keyboard) as well as users who are logged on remotely, such as via a mapped share.
As shown in Figure 1.2, psloggedon.exe shows users logged on to the system remotely. To set up this demonstration, I logged in to a Windows 2000 system (Petra) from my Windows XP system and then ran the command on the Windows 2000 system.
Figure 1.2 Output of psloggedon.exe on Windows 2000
Net Sessions
The net sessions command is native to Windows systems (through the net.exe executable file), and you can use it to see not only the username used to access the system via a remote login session, but also the IP address and the type of client from which it is accessing the system. Figure 1.3 illustrates the output of the net sessions command run on a Windows 2003 system.
Figure 1.3 Output of the net sessions Command on Windows 2003
The net sessions output illustrated in Figure 1.3 shows two Windows XP systems logged in to a Windows 2003 system using the Administrator account. Neither session has any files open, but neither has been active for very long (as illustrated by the times listed in the "Idle time" column of the output).
LogonSessions
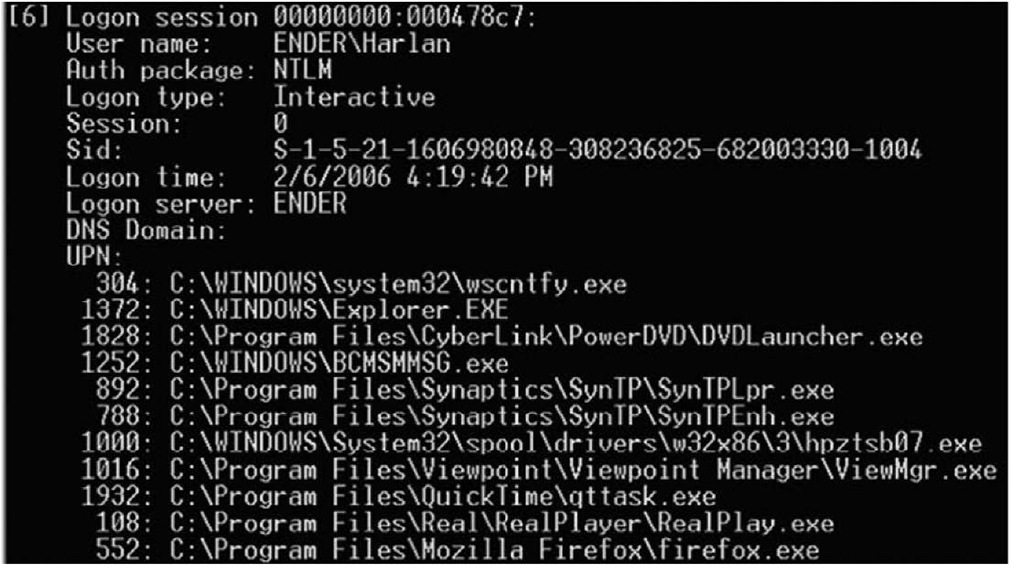
Logonsessions.exe (http://technet.microsoft.com/en-us/sysinternals/bb896769.aspx) is a CLI tool available from Microsoft that lists all the active logon sessions on a system. Figure 1.4 illustrates a portion of the output of logonsessions.exe on a Windows XP system (the system name is Ender).
Figure 1.4 Output of logonsessions.exe on Windows XP
Logonsessions.exe provides a great deal more information than the other tools, as illustrated in the output excerpt displayed in Figure 1.4. For example, it lists the authentication package used (it might be important to your investigation that the Kerberos authentication package was used instead of LAN Manager), type of logon, active processes, and so on.
Tip::
The logonsess.txt file located in the \ch1\dat directory on the media that accompanies this topic contains the output of logonsessions.exe from the Windows 2003 system illustrated in Figure 1.3.
Another useful utility you’ll find handy is netusers.exe, a free utility from Somarsoft.com. Using the -local and -history switches with netusers.exe, you can retrieve a brief report of the last time all local users logged on to the system. The last logon time is maintained in the Registry; we’ll discuss specifics of this Registry information in next topic. Netusers.exe allows you to retrieve this information from a live system.
Keep in mind, however, that these tools will not show you whether someone is logged on via a backdoor. Backdoors and Trojans such as the infamous SubSeven allow users to "log in" to the Trojan via a raw Transmission Control Protocol (TCP) connection, bypassing the Windows authentication mechanisms. As such, these connections will not show up when you’re using tools such as psloggedon.exe. Having the output of these tools, however, can be instrumental in showing that a user you discover later on did not show up in the list. It can also be used to demonstrate hidden functionality, even if the mechanism for that functionality is never found.
Open Files
If the output of psloggedon.exe shows you that users are logged in to the system remotely, you will also want to see what files they have open, if any. Many times when a person accesses a system remotely, he might be looking for something specific and opening files. A user in a corporate environment could have a share available and allow other users to view images, download songs, and so on. Poorly protected Windows systems, such as Windows 2000 systems that are connected to the Internet with no Administrator password (and no firewall), can be "visited" and files searched for, accessed, and copied. The net file command, psfile.exe (http:// technet.microsoft.com/en-us/sysinternals/bb896649.aspx), and the openfiles.exe (native to Windows XP Pro and Windows 2003) tools will all show files that are opened on a system via a remote connection.
Network Information (Cached NetBIOS Name Table)
Sometimes when intruders gain remote access to a system, they want to know what other systems are available on the network and can be "seen" (in the network-centric sense) by the system they’ve compromised. I’ve seen this happen often in investigations, in a variety of ways; sometimes batch files have been created on the system and executed, and other times the intruder has launched net view commands via SQL injection (by using a browser to send commands to the system through the Web and database servers). When connections are made to other systems using NetBIOS communications (the same as are used for logins, connecting to shares, and the like), the systems will maintain a list of other systems they’ve "seen." By viewing the contents of the cached name table, you might be able to determine other systems that have been affected.
Let’s look at an example. My home "network" consists of one laptop and several VMware sessions that appear as stand-alone systems on a virtual network. To demonstrate the caching of NetBIOS names, I started my Windows 2000 VMware session and logged in to view the IP address that was assigned via Dynamic Host Configuration Protocol (DHCP). I then went back to the host operating system (Windows XP Pro SP2), and in a command prompt I typed nbtstat -A 192.168.1.22 to view the "remote" system’s name table. I then typed nbtstat -c to view the cached NetBIOS names on the host operating system. Figure 1.5 shows what I saw.
Figure 1.5 NetBIOS Name Table Cache
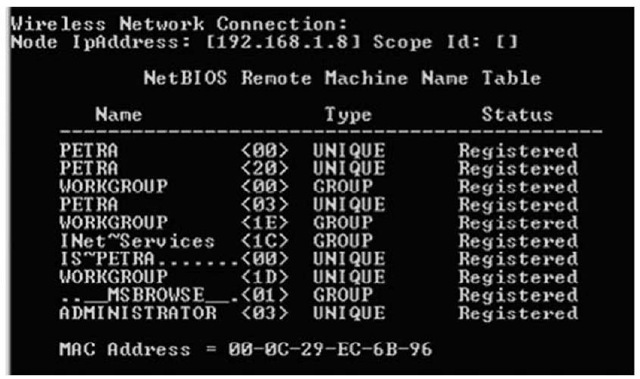
At this point, you might be thinking "So what? Why is this important?" Well, if I were an attacker and had gained access to one system, I might be interested in gaining access to other systems as well. To do so, I would need to see what systems are on the network and what vulnerabilities they have. Essentially, I’d be looking for easy targets. Now, if I were to start scanning for vulnerabilities, I might alert someone to what was going on. Also, to scan for vulnerabilities, I would need to copy my tools to the system I had already compromised, and that could alert someone to my activities. However, I can use nbtstat.exe to locate potentially vulnerable systems. For example, Figure 1.6 shows the output of the command I ran to populate the NetBIOS name cache.
Figure 1.6 Output of nbtstat -A 192.168.1.22
From the output of the nbtstat command displayed in Figure 1.6, we can see that the administrator is logged in, and we can see that the system is running the Internet Information Server (IIS) Web server. Penetration testers and attackers alike will use the information in the NetBIOS (http://en.wikipedia.org/wiki/NetBIOS) name table on any system they are able to compromise, to locate other vulnerable systems. Microsoft Knowledge Base articles 163409 (http://support.microsoft.com/kb/q163409) and 119495 (http://support.microsoft.com/ kb/119495/EN-US) provide a great deal of information regarding the information available in the name table.
Network Connections
As soon as possible after an incident is reported, the investigator should collect information regarding network connections to and from the affected system. This information can expire over time, and if too much time passes, it will be lost. An investigator might approach a system and, after an initial look, determine that the attacker is still logged in to and accessing the system. Or she could find that a worm or an Internet Relay Chat (IRC) bot (malicious software that, once installed on a system, makes an outbound connection to an IRC server to await commands) is communicating out from the system, searching for other systems to infect, updating itself, or logging in to a command and control server. This information can provide important clues and add context to other information that the investigator has collected. Not every system will have a firewall installed and even fewer will have a firewall configured to log successful connections into and out of the system. Nor will every system have an application such as Port Reporter (http://support.microsoft.com/kb/837243) installed to record and log network connection information. The investigator must be prepared to react quickly and collect the information she needs in an efficient, timely manner.
I’ve been involved in several cases where I have been provided with image files acquired from a system, and the client has asked, "Was sensitive data copied from the system?" Without at least some network-based information, the answer will invariably be "There’s no way to tell." I have also been in numerous situations where having some information about network connections would greatly reduce what I have to look for, particularly when what alerted the client to the incident in the first place really had nothing to do with the compromise we ended up discovering. In one particular situation, a timeline analysis of the system image showed that the intruder was accessing the system via a backdoor at the same time that two different administrators were accessing the system to remediate two separate issues. Having information about network connections going to and from the system would have been extremely helpful in locating the core intrusion.
Netstat
Netstat is perhaps the most well-known tool for collecting information regarding network connections on a Windows system. This CLI tool is straightforward and easy to use and provides a simple view of TCP and User Datagram Protocol (UDP) connections and their state, network traffic statistics, and the like. Netstat.exe is a native tool, meaning that it is provided as part of the operating system distribution.
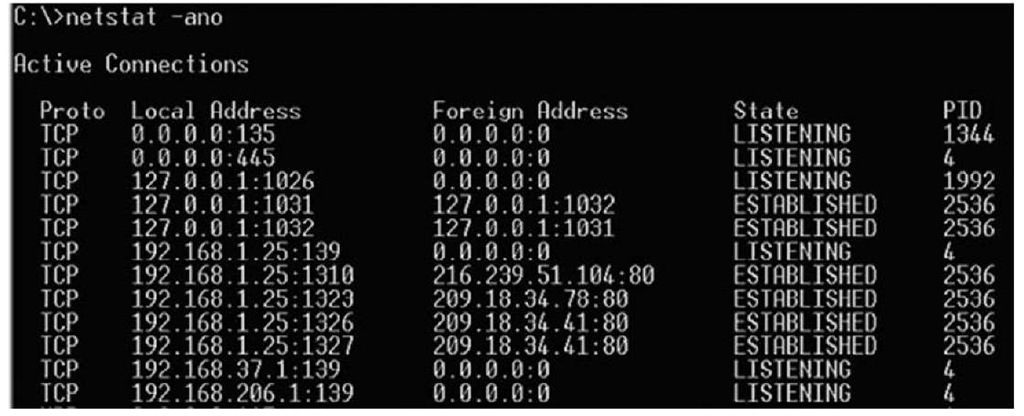
The most common way to run netstat is with the -ano switches, which tell the program to display the TCP and UDP network connections, the listening ports, and the identifiers of the processes (the PIDs) using those network connections. Figure 1.7 illustrates the output of the netstat -ano command.
Figure 1.7 Excerpt from the Output of the netstat -ano Command on Windows XP
Tip::
Under normal circumstances, Windows 2000 does not respond to the -o switch when running netstat.exe. However, Microsoft Knowledge Base article 907980 provides access to a hotfix that allows the version of netstat.exe on Windows 2000 to list the PID for the process that "owns" the network connection listed in the output.
The output of the netstat -ano command illustrated in Figure 1.7 shows the active network connections, the state of each connection, and, on the far right, the PIDs of the processes using the ports. What you’re looking for in the output of netstat are any unusual connections. For example, it is not unusual on many user systems to see connections going out from a high client port to a remote system, connecting on port 80. The PID of the process using this connection will usually map back to a Web browser. However, the investigator can be easily fooled. I have investigated cases where the tool wget.exe was used to connect to remote systems on port 80 and download malware and hacker utilities. By themselves and without further scrutiny, these connections would look to the investigator (and to an IDS) like legitimate Web-surfing traffic.
Tip::
Microsoft Knowledge Base article 137984 (http://support.microsoft.com/kb/ 137984) is older but provides descriptions of the states listed in the output of netstat.exe.
Using netstat with the -r switch will display the routing table and show you whether any persistent routes are enabled on the system. This could provide some very useful information to an investigator or even simply to an administrator troubleshooting a system. I’ve seen systems that have been set up to transfer files to another location as part of a business process, and the only way that process would work was if a persistent route was enabled on the system, since the persistent route redirected certain traffic out over a virtual private network (VPN) connection rather than through the normal routes out of the infrastructure. In troubleshooting an issue that really wasn’t making much sense to me, I ran across a persistent route and told one of the system engineers about it. This information jogged his memory a bit, and we were able to track down and resolve the issue.
Process Information
An investigator will always want to know what processes are running on a potentially compromised system. Note the word always. When viewing the running processes in the Task Manager, you can see some information about each process. However, during an investigation you will want to collect much more information that’s not visible in the Task Manager. You will want:
■ The full path to the executable image (.exe file)
■ The command line used to launch the process, if any
■ The amount of time that the process has been running
■ The security/user context in which the process is running
■ Which modules the process has loaded
■ The memory contents of the process
The Task Manager view provides some of this information, but it does not provide everything. For instance, some malware installs itself under the name svchost.exe, which is the name of a legitimate process on Windows systems (see the "Svchost" sidebar). The executable image for this process is located in the system32 directory and is protected by Windows File Protection (WFP; see the "Windows File Protection" sidebar for more information). This means that as long as WFP is running and hasn’t been tampered with, attempts to replace or modify a protected file will cause the new file to be automatically replaced by a "known good" copy from the cache and an Event Log entry to be generated.
Why is this important? If you’re looking at the list of processes in the Task Manager, how are you going to tell which process is "suspicious"? An easy way to find suspicious processes is to view the full path to the executable image file (svchost.exe running from something other than C:\Windows\system32 is going to be suspicious) and/or the command line used to launch the process, as inetinfo.exe launched with the arguments —L -d -p 80 —e cmd.exe should be suspicious to most administrators and investigators; this command line indicates the use of netcat as a backdoor. Many bits of malware disguise themselves by using names of legitimate files. For example, the W32/Nachi worm places a copy of a Trivial File Transfer Protocol (TFTP) utility in the C:\Windows\system32\Wins directory and names it svchost. exe. When this program is running, there is no way in the Task Manager to really distinguish it from the legitimate version of svchost.exe.
Are You Owned?
Windows File Protection
Windows File Protection, or WFP, was added to Windows in Windows 2000 and is present in Windows XP and 2003 as well. In a nutshell, WFP "protects" critical system files from being modified or deleted accidentally. Assuming that the system hasn’t been compromised to the point where WFP can be subverted, if an attempt is made to modify or delete a protected file the system will "wake up" and automatically replace that file with a known good copy from cache. An event ID of 64001 (http:// support.microsoft.com/default.aspx?scid=kb;en-us;236995) is then generated and written to the Event Log.
Microsoft Knowledge Base article 222193 (http://support.microsoft.com/kb/222193/ EN-US), titled "Description of the Windows File Protection feature," provides a more in-depth explanation of the feature along with various Registry keys associated with WFP.
Now let’s take a look at some tools you can use to view more detailed information about processes.


