Abstract
This article presents application of modal analysis for the computation of data base of biological objects set and extraction of three dimensional geometrical features. Traditional anthropometric database contains information only about some characteristic points recorded as linear or angular dimensions. The current face recognition systems are also based on the two-dimensional information. Such biometric systems are used obviously during passenger control on the airport or boundary crossing. To increase level of security the methods need to operate on three-dimensional data. In the article authors present method of 3D modal analysis for decomposition, extraction features and individual coding of analyzed objects sets. Authors apply empirical modal analysis PCA (Principal Component Analysis) for two types of 3D data: human femur bones and human faces. Additionally for face recognition, as support information, the thermal (infrared) images was tested. In this paper the results of PCA analysis of each type of database were presented and discussed.
Introduction
Many engineering CAD technologies have an application not only in mechanical design but also in different disciplines like biomechanics, bioengineering, biometrics, etc. This interdisciplinary research takes advantage of reverse engineering, 3D modeling and simulation, modal analysis and other techniques. The 3D virtual models have a numerous applications such as visualization, medical diagnostics (e.g. virtual endosco-pies), pre-surgical planning, FEM analysis, CNC machining, Rapid Prototyping, advanced digital calculations, etc. Several engineering technologies can be used for advanced analysis of biological objects. In further topics the two applications, an-thropometric (femur bones) and biometric (human faces) of three-dimensional models will be presented and discussed. For biometric database the thermal (infrared) images was tested as support information.
Biometric Technology
With the expansion of international traffic and globalization of the world, the necessity of research of new methods in security systems is increasing. The security and access systems are very important and rapidly advancing, not only in computer vision. Such systems are used obviously during passenger control on the airport or boundary crossing [5]. Biometrics identify people by measuring some aspects of individual anatomy or physiology – such as hand geometry or fingerprint, some deeply ingrained skill, or other behavioral characteristic – handwritten signature, or something that is a combination of the two – voice [1]. In generally the biometrics can be sorted into two types [2]: a) physical – face, fingerprint, hand/finger, iris, ear, retinal, DNA, vein, blood pulse, dental, lips, nail; b) behavioral – voice, gait, tapping, signature, keystroke dynamics, mouse dynamics. The face recognition method is the oldest and the most "natural" method of identification person’s. Recognizing people by their facial features is going back at least to our early primate ancestors [6].
The disadvantage of the most commonly used recognition techniques is their insufficient reliability [3]. A 2D dimensional photo cannot be measured like a landscape and simply doesn’t contain the same amount of information as the 3D photo. This problem is especially essential for twins, when the similarity of face shape is very high.
Facial identification reads the peaks and valleys of facial features. These peaks and valleys are known as nodal points (80 nodal points exist in a human face, but usually only 15-20 are used for identification – known as „Golden triangle" region between the temples and the lips [4].
Anthropometric Database
Traditional anthropometric database contains information only about some characteristic points (other parameters are not collected). The set of the bones is described only in two-dimensional space, by the collection of linear and angular dimensions (Fig. 1). Three-dimensional knowledge about mean geometry of the bones does not exist. For using CAx tools the 3D geometrical model is required. The problem is insufficient information in existing databases.
Methods
In presented research the modal method is used for statistical analysis and to minimize the number of parameters which describe 3D objects. One of the methods based on modal decomposition is PCA (Principal Component Analysis, known also as POD – Proper Orthogonal Decomposition). The empirical modes (PCA) are optimal from the viewpoint of information included inside each of the modes (Holmes, Lumley and Berkooz, 1998). In PCA analysis the 2D and 3D data can be used. This analysis requires the same position, orientation and topology of the data for all objects. To achieve this, each object in database must be registered.
Acquisition of Input Data – 3D Scanning
For obtain the 3D input data the 3D scanning system (the structural light scanner) was used. The two groups of biological models were measured: set of human faces and set of femur bones. Each input object was scanned and 3D surface model was computed.
To increase the accuracy of PCA analysis, each face was described (Fig.1.) by individual point cloud (40k points) instead of few markers from "Golden triangle" area.
Fig. 1. Data acquisition process (from left): hardware configuration, captured image, 3D curve network, input data set (points cloud)
Fig. 2. An example of the models in database (from the left): 3D faces, 2D thermal images
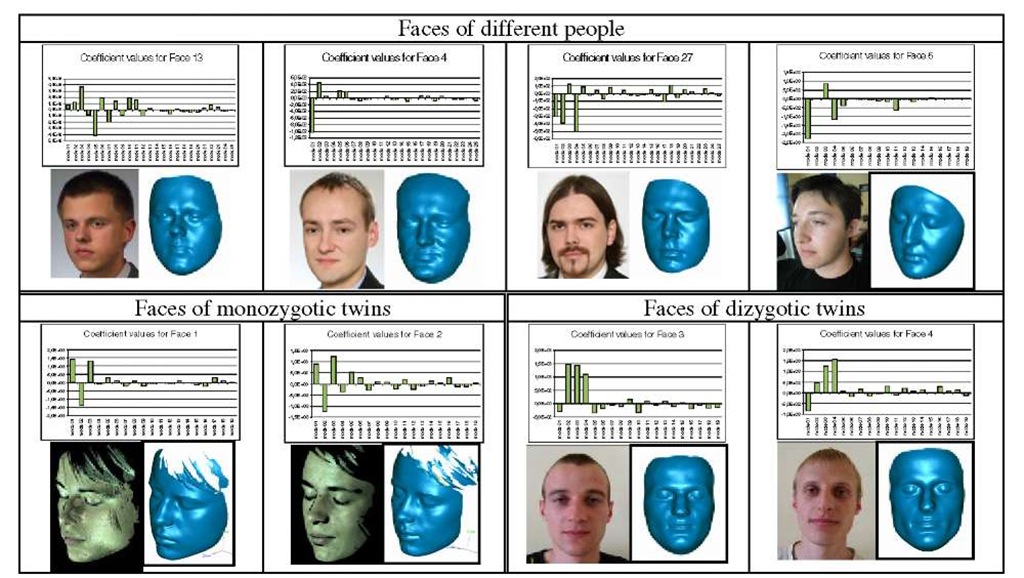
Database for biometric PCA analysis is prepared onto the multiple human faces. There are 39 faces (Fig. 2.) with neutral expression of different persons. To improve sensitivity of presented method, three sets (6 faces) of the twin’s faces in the database were included. There are two sets of identical – monozygotic twins and one set of fraternal – dizygotic twins.
Second part of input data for biometric database is set of two-dimensional infrared images (thermal images). In this research the thermal images of 17 different persons were collected (Fig. 2.). For acquisition of infrared images the thermal camera was used. All pictures were collected in the same conditions of the measurement: room (+220C) and camera settings: matrix VOx 320×240 pixels, thermal resolution +/0.030C, range of measured temperature: 26-400C.
To create an authentic 3D anthropometric database (second 3D database for PCA analysis), the set of real femur bones was used. In this work 15 femur bones were used (6 female and 9 male – bones obtained from Poznan University of Medical Science). Each bone (Fig.3.) was described by individual point cloud (1.5mln points) and triangle surface grid (30k elements).
Data Registration
The Principal Component Analysis requires the same position, orientation and topology of the data input (the same number of nodes, matrix connection, etc.) for all objects. To achieve this, each new object added to database must be registered.
Fig. 3. Data acquisition (from left): input femur bones, measurement process, final triangle surface grid
For face the origin point of coordinate system is arranged in cross section of two lines: vertical middle line on the face, horizontal – eyes line. The registration is made in two steps. First step (preliminary registration) is the rigid registration. It consists of simple, affine geometrical transformation of object in three-dimensional space (rotation and transformation). For control of this process three points are used: two points in the centers of the eyes, one on the top of the nose. The second step is connected with curves extraction. Independently from face size, always 201 curves on face are only. To achieve this, scaling of space between curves is used. For infrared images only the first step of registration was done.
The registration of bones is made also in two steps. First step (preliminary registration) is similar rigid registration. The second step is the viscous fluid registration. For this registration the modified Navier-Stokes equation in penalty function formulation (existing numerical code [9]; source segment [8]) is used (4):
where p – is fluid density, Vi – velocity component, Re – Reynolds number, X -bulk viscosity. In this application, parameters £ and X are used to control the fluid compressibility, f is the base object and g is the target object (input model). The object is described by the grid nodes. The displacements of the nodes are computed from integration of the velocity field. Computed flow field provides information about translations of the nodes in both sections. After computation we obtain dislocation of nodes of the base grid onto new geometry (Fig. 4.).
Fig. 4. Grid deformation (from the left): base object (base grid), new object inserted to database, base grid on geometry of the new objects
Principal Component Analysis – Empirical Modes
PCA transformation gives orthogonal directions of principal variation of input data. Variation is described by eigenvalue related to the first principal component. The second principal component, describe the next in order, orthogonal direction in the space with the most large variation of data. Usually only few first principal components are responsible for a majority variations of the data. Data projected onto other principal components often has small amplitude, lower than value of measurement noise. Therefore they can be deleted, without danger of decreasing the accuracy. The used algorithm is based on statistical representation of the random variables.
The shape of the each object is represented in the data base as the set of 3D point clouds. Each point clouds is described by a vector (1):
where sij = ((, y, z) describes coordinates of the points in Cartesian system, M is the number of the faces which are in database, N is the number of the points in single point cloud. In the next step the mean shape S and covariance matrix C are computed (2):
The difference between mean and object that is in data base are describe by the deformation vector Si = Si — S . The statistical analysis of the deformation vectors gives us the information about the empirical modes. Modes represent the geometrical features (shape) but also can carry other information like texture, map of temperature and others. Only few first modes carry most information, therefore each original object Si is reconstructed by using some K principal components (3):
where is an eigenvector representing the orthogonal mode (the feature computed from data base), aki is coefficient of eigenvector.
Modal Decomposition of 3D Objects – Empirical Modes (PCA)
The numerical experiment of modal decomposition is prepared onto three sets of input data: a) 3D human faces, b) 2D thermal images of human faces, c) 3D human femur bones. In the next sections results of PCA analysis of the input data sets are presented.
PCA Analysis of Human Faces – Biometric Database
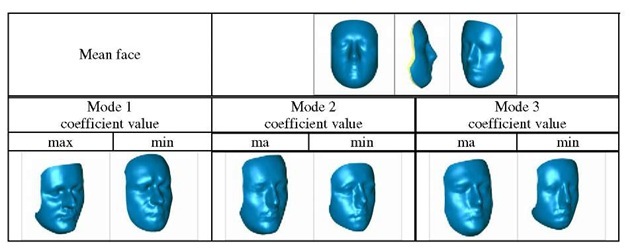
For prepared database of human faces the PCA analysis was performed. The result of this operation is the mean face, nineteen modes and a set of coefficients (Fig. 5.).
For presented analysis the eighteen modes include one hundred percent of information about decomposed geometry (Table 1.). Nineteenth and furthers modes contains only a numerical noise. Modes describe the features of the faces. Two first modes characterize global transformation: first mode the changing of the face size in vertical direction and deep of eyes, second mode changing the size in horizontal direction. Further modes describe more complex, local deformations.
Fig. 5. Visualization of the mean face and first three empirical modes Table 1. Participation of the first 10 modes of PCA decomposition of 3D faces
|
Number of |
Participation |
Total participation |
|
the mode |
of the mode [%] |
of the modes [%] |
|
1 |
41.3730939 |
41.3730939 |
|
2 |
20.4650772 |
61.8381711 |
|
3 |
14.1903043 |
76.0284753 |
|
4 |
8.6513257 |
84.6798011 |
|
5 |
3.4490109 |
88.1288119 |
|
6 |
2.5576350 |
90.6864469 |
|
7 |
2.1880060 |
92.8744530 |
|
8 |
1.3711281 |
94.2455811 |
|
9 |
1.1804560 |
95.4260371 |
|
10 |
0.9962907 |
96.4223278 |
Fig. 6. Face "ID code" for few faces from database and for faces of two types of twins (for each object is presented – graph of coefficient values, original photo and 3D face model)
Fig. 7. Visualization of the mean face and first four empirical modes of infrared images
Each face in database has unique set of coefficient values – "ID code" (Fig. 6.). As the authorization key the set of coefficient values for the faces can be used. Each key describes individual shape of face and can be decoded and compared with the original data of user to obtain access to restricted area or data files. Also identical (for human eye view) monozygotic twins might be distinguished using these "faceprints" as well as traditional fingerprints [7].
As a support for three-dimensional face recognition, additional information – the thermal images – was used [10]. The two-dimensional infrared images can be added to database as a fourth dimension.
For prepared infrared images of human faces the PCA analysis was done. The result of this operation is the mean face (Fig. 7.), seventeen modes and set of coefficients.
Table 2. Participation of the first 10 modes PCA decomposition of thermal images
|
Number of |
Participation |
Total participation |
|
the mode |
of the mode [%] |
of the modes [%] |
|
1 |
26.4191478 |
26.4191478 |
|
2 |
16.7302890 |
43.1494367 |
|
3 |
10.9104597 |
54.0598965 |
|
4 |
8.3397586 |
62.3996550 |
|
5 |
6.5525733 |
68.9522283 |
|
6 |
5.6298384 |
74.5820668 |
|
7 |
4.4142731 |
78.9963398 |
|
8 |
3.6441677 |
82.6405075 |
|
9 |
3.3063140 |
85.9468215 |
|
10 |
2.7908036 |
88.7376251 |
Fig. 8. Thermal faceprint for few faces from infrared database (for each object is presented -graph of coefficient values, original photo and thermal image)
For presented analysis the sixteen modes include one hundred percent of information about decomposed thermal images (Table 2.). Seventeenth mode contains only a numerical noise.
Similarly to 3D data, each infrared image of the face in database has unique set of coefficient values – "thermal faceprints" (Fig. 8.). This additional information can be associated with 3D data to increase the level of security and can complicate the trials of fake the system.
PCA Analysis of Femur Bones – Anthropometric Database
For prepared database of bones the PCA analysis was done. The result of this operation is the mean object, fifteen modes and coefficients. The first fourteen modes include 100% of information about decomposed geometry (Table 3). Fifteenth and further modes contain only a numerical noise and they are not used for further calculations.
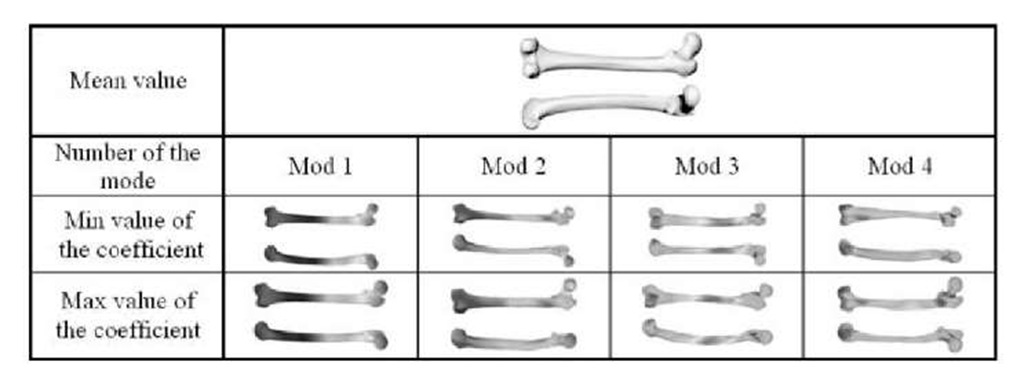
Modes describe the features of the femur bones (Fig. 9.). The first mode describe transformation of the length of the femur bone. Second mode represent position conversion of the head of the bone, third describe change the arc of the shaft (body). Further modes describe more complex deformations.
Fig. 9. 3D visualization of mean value and first eight modes of femur bones (anterior and posterior view)
Table 3. Participation of the first 10 modes in face PCA decomposition
|
Number of the mode |
Participation of the mode [%] |
Total participation of the modes [%] |
|
1 |
74.9212416 |
74.9212416 |
|
2 |
10.5438352 |
85.4650767 |
|
3 |
4.2699519 |
89.7350286 |
|
4 |
3.3128685 |
93.0478971 |
|
5 |
1.6659793 |
94.7138765 |
|
6 |
1.4234329 |
96.1373093 |
|
7 |
1.0359034 |
97.1732127 |
|
8 |
0.6781645 |
97.8513772 |
|
9 |
0.5866122 |
98.4379894 |
|
10 |
0.4796167 |
98.9176061 |
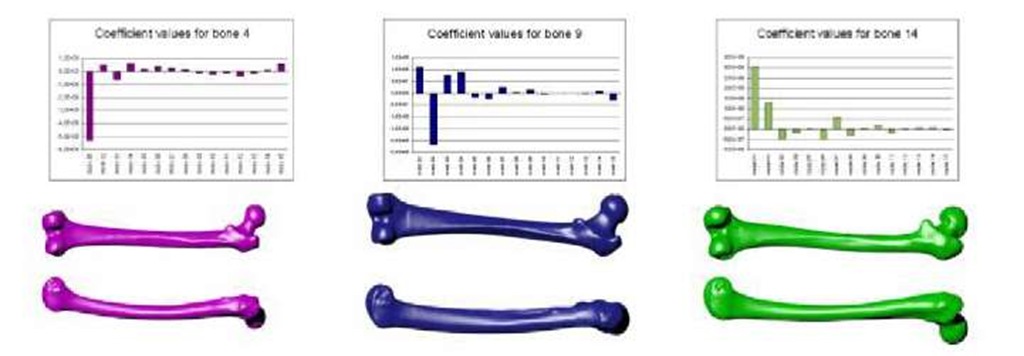
Fig. 10. Correlation between coefficient value and geometry of the bone for three different femur bones (all pictures of bones are made in the same scale)
In this experiment, the value of average error for reconstructed geometry of the bone was equal to 0,3mm (reconstruction based on 14 modes). Study of the values of the coefficients gives us additional information about the analyzed bones. For presented database, correlation between coefficient value of first mode and gender was found. Negative coefficient value "-" is connected with female bones, when positive coefficient value "+" was describe male bones.
Other interesting feature of PCA decomposition, is individual set of coefficients values for each bone. This aspect is similar to "fingers prints". Because each bone has different geometry it also has individual set of coefficient values (Fig.10).
Conclusions
Three-dimensional PCA analysis makes possible the extraction of mean shape and geometrical features of biological object set. Presented method as the source of data input apply full 3D information instead set of "control" points.
3D faceprints are more proof onto fake than 2D face biometric recognition systems. Further is possible to add to data base additional information’s (not only geometrical data) like e.g. thermal photo (map of temperature). Application of 3D PCA into biometric security systems make possible using 3D faces as the access code. Each face has individual set of coefficient values – individual 3D biometric code. That information can be easily recorded onto electronic ID card – similar to 2D bio-metric data’s. Advantages of this method is possibility of distinguish of identical monozygotic twins what is frequently very difficult for standard security systems. Disadvantage of infrared images is very strong influence of outdoor temperature, on a thermal map of the face.
Another application of 3D PCA analysis can be development of full 3D anthro-pometric database of the skeleton system. One of the advantages of that database is the possibility of quick measurement of any necessary dimension on the surface of the mean bone (mean shape characterizes whole 3D body of the bone). Additional mean shape and geometrical features (knowledge about shape and trends of deformations) can be used to create new universal types of prosthesis. Such 3D PCA analysis also can be important in anthropology, gives us information about the changes that appear in the human skeletal structure in different populations or ages.


