ABSTRACT
A new remote nondestructive inspection technique based on thermoelastic temperature measurement by infrared thermography was developed for the detection of fatigue cracks in steel bridges. Fatigue cracks were detected from localized thermoelastic temperature changes at crack tips due to stress singularities generated by wheel loading from traffic on a bridge. Self-reference lock-in data-processing technique and motion compensating technique were developed to improve the thermal images obtained in the crack detection process. Advantages and limitations of the proposed nondestructive evaluation technique were discussed based on results of field experiments for highway bridges. Thermoelastic stress analyses in the vicinity of crack tips were also carried out after the crack detection process by self-reference lock-in thermography. The stress distribution under wheel loading by traffic was measured by infrared thermography. Stress intensity factors were evaluated from measured stress distribution. It was found that these fracture mechanics parameters can be evaluated with reasonable accuracy by the proposed technique, enabling the assessment of structural integrity based on the evaluated fracture mechanics parameters.
Introduction
Recently, crack propagation in aged structures has become a serious problem that can lead to their catastrophic failure. In large-scale steel structures of critical importance, such as highway bridges, the nondestructive inspection for deterioration and damage is necessary to ensure safety and to estimate the remaining life of these structures. As conventional nondestructive testing (NDT) techniques for steel bridges, visual testing, magnetic particle testing and ultrasonic testing have been commonly employed. However, these techniques are time- and labor- consuming techniques, because special equipment is required for inspection, such as scaffolding or a truck mount aerial work platform. Furthermore they can only be employed for crack detection, and can not be used to directly measure physical quantities for evaluating the remaining strength based on fracture mechanics. Thermoelastic stress analysis (TSA) by infrared thermography has been widely used as an effective full-field experimental stress measurement technique [1, 2]. TSA has been gaining increasing attention as a nondestructive testing and evaluation method for fatigue cracks in steel structures. When TSA measurement is performed on a cracked structure, cracks can be detected from singular stress fields due to the cracks, since significant thermoelastic temperature changes can be observed due to stress concentrations around crack tips. Steel bridges being concerned with fatigue crack propagations are always subjected to frequent and heavy wheel loadings from traffics on the bridge. Therefore fatigue cracks can be identified from localized thermoelastic temperature change due to stress singularity at crack tips under variable wheel loadings.
Lock-in infrared thermography using reference signal synchronized with stress is commonly employed to improve the precision of stress measurements, since thermoelastic temperature change is very small. A load signal from an external source, such as load-cell or strain gage, is usually employed as a reference signal in the conventional TSA technique.
However, it is difficult to obtain a reference signal from steel bridges in service. Furthermore the observed load signal does not have a clear sinusoidal waveform, because it contains the random waveform components due to the in-service wheel loading by the vehicles. These facts indicate that the conventional lock-in infrared thermography is not applicable for TSA of steel bridges. The present authors developed a self-reference lock-in thermography [3] that does not require any external reference signals and can be employed even under random loading. Nondestructive inspections of fatigue cracks in steel bridges were conducted by the proposed self-reference lock-in thermography in our previous papers [4, 5]. TSA is extremely beneficial not only for crack detection but also for the on-site measurement of stress distributions around crack tips, which is important for crack propagation analysis. The present authors [6] carried out thermoelastic stress measurement under random wheel loading in the vicinity of fatigue cracks. The stress intensity factors KI and KII for mixed- mode cracks were obtained from measured stress distributions in actual steel bridges in service. In this paper, experimental results for fatigue crack detection by self-reference lock-in thermography and subsequent on-site stress evaluation based on thermoelastic temperature measurement are reviewed.
Thermoelastic stress measurement
Dynamic stress change causes very small temperature change under the adiabatic condition in a solid. This phenomenon is known as the thermoelastic effect and is described by Lord Kelvin’s equation relating the temperature change (AT) to a change in the sum of the principal stresses (Ac) under cyclic variable loading as follows.
a : Coefficient of thermal expansion
p : Mass density
Cp : Specific heat at constant pressure
T : Absolute temperature
A change in the sum of the principal stresses (Ac) is obtained by measuring the temperature change (AT) using infrared thermography.
Self-reference lock-in thermography
In self-reference lock-in thermography, a reference signal is constructed from a reference region arbitrarily set on the same sequential infrared images as those showing the thermoelastic temperature change. The distribution of the relative intensity of the thermoelastic temperature change against that in the reference region can be obtained by the following least-squares approach even under random loading, provided that the temperature change in the reference region has a similar and in-phase waveform to that in the objective area under measurement.
Assume that a body is subjected to random loading whose waveform is expressed as fn. The infrared signal in an objective region can be approximated as follows:
where a is the DC offset, b is an influence coefficient of the reference, and n is the frame number. To calculate b, the sum of the squares of the deviations between Yn and the infrared signal yn obtained from the region, defined as follows, is minimized.
Here, N is the total frame number. Then, b is obtained from the following equation.
When this calculation is performed on all the pixels of infrared thermography, it is possible to obtain the correlation between the infrared signal in the reference region and that in any region. The value of b indicates the intensity of the thermoelastic temperature change relative to that in the reference region. The self-reference lock-in method does not require any external reference signals and can be applied even under random loading. The obtained values of b are effectively employed for the detection of areas of stress concentration around notches or cracks.
Motion compensation technique for sequential infrared images
Displacement in infrared image is caused by the vibration of the bridge under vehicle loading. This displacement sometimes causes an error called as edge effect in infrared measurement when time-series processing is conducted for sequential infrared images. Displacement in the infrared image was corrected by motion compensation by the post data processing based on the movements of characteristic points in infrared images. Determination of image shift is conducted by the two-dimensional SSD (Square Sum of Differences) parabola fitting method [7]. Pixel values of the subset, i.e., the region of interest of pattern matching, in the shifted image are compared with those in the basic image and square sum of the differences is calculated between two images. The value of image shift which minimizes SSD is determined as the most plausible value of the image shift. SSD is given by the following equation.
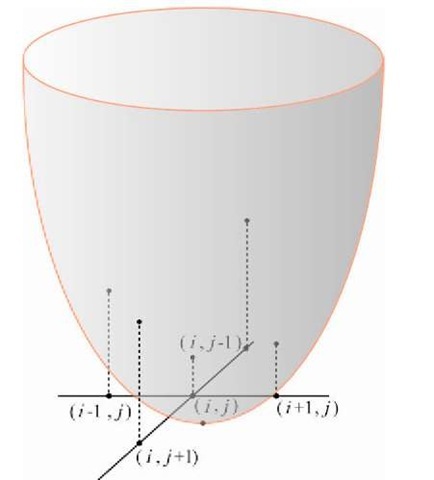
Fig. 1 Schematics of 2-D SSD parabola fitting method
where I and I2 are pixel values in the basic image and shifted image, respectively. (x,y) is a coordinate in the subset region W. dx and dy are values of image shift in x-direction and y-direction, respectively. The values of (dx,dy) which minimizes SSD is obtained by the following procedure.
(1) The combination of (dx,dy) which minimizes SSD is obtained as the combination of integer pixel unit values;
(dx=i, dy=j).
(2) It is assumed that distribution of SSD close to its minimum value can be expressed by the following quadratic function.
(3) Paraboloid which involves five points, SSD(ij), SSD(i-1j), SSD(i+1j), SSD(ij-1) and SSD(ij+1) is defined as shown in Fig. 1.
(4) The coefficients ak (k=1,2,3,4,5) is calculated from the following equation.
(5) (dx,dy) which minimizes SSD is obtained as the coordinate of the apex of the paraboloid. The coordinate of the
Detection of fatigue cracks by self-reference lock-in thermography
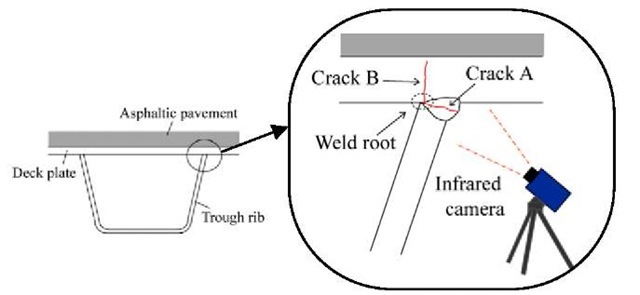
A schematic illustration of part of a steel bridge reinforced by trough ribs is shown in Fig. 2. There are two different types of fatigue crack that propagate from a weld root. Crack A initiates at the weld root and propagates through the weld throat. This type of fatigue crack is known as a "weld-bead-penetrant-type" fatigue crack. On the other hand, Crack B initiates at the weld root and propagates through the deck plate.
Fig. 2 Fatigue cracks at rib-to-deck joint
This type is known as a "through-deck-type" fatigue crack. The through-deck-type fatigue crack is not open at the inspection surface; therefore it is very difficult to detect.
Detection of weld-bead penetrant type fatigue cracks in actual steel deck
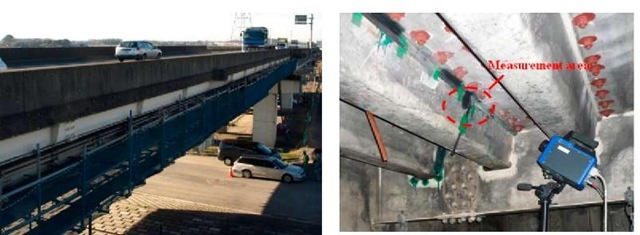
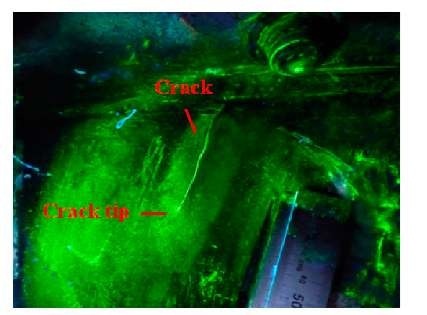
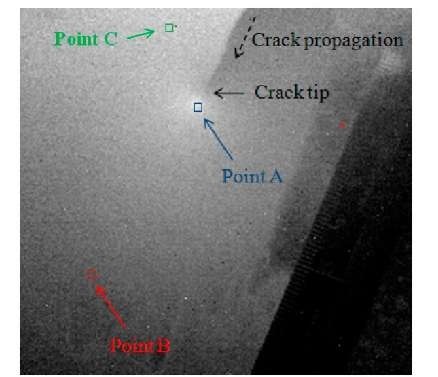
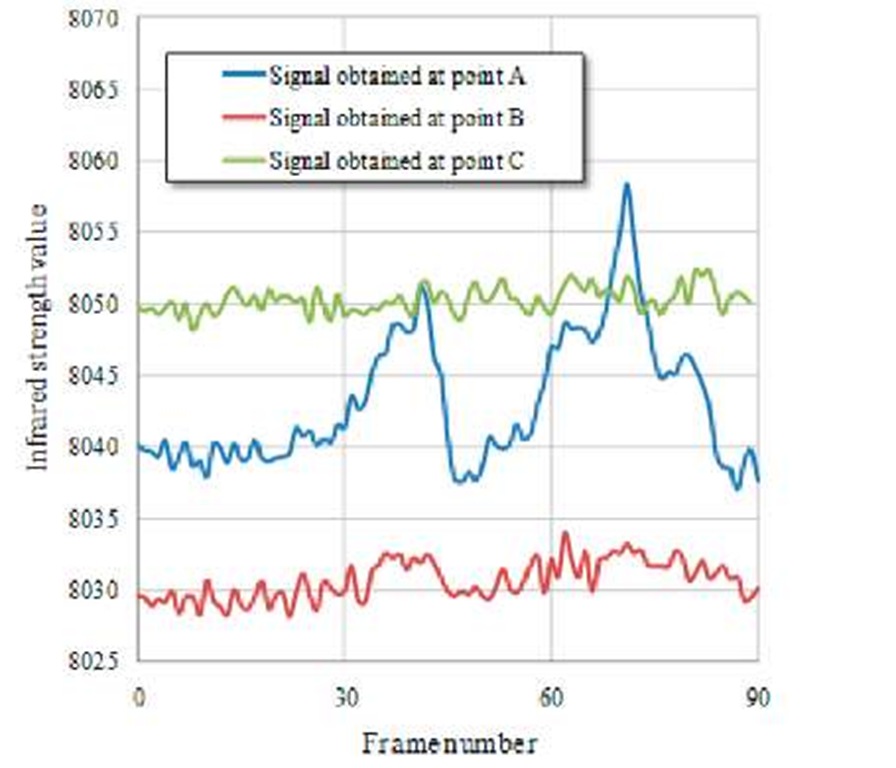
Detection of weld-bead penetrant type fatigue cracks in a steel deck of the bridge was conducted by the self-reference lock-in thermography as shown in Fig. 3. Result of magnetic particle testing for the objective fatigue crack is shown in Fig. 4. This crack propagated in the weld-bead and deflected into the trough rib. Distribution of thermoelastic temperature change near the crack tip was sequentially measured under the variable wheel loading caused by the traffics on the bridge. Motion compensation by 2-D SSD parabola fitting method was applied for obtained sequential infrared images. Infrared image captured at the maximum loading is shown in Fig. 5. Three different reference points for generating reference signals for lock-in processing were set at points A, B and C in the figure. Waveform generated at each reference point is shown in Fig. 6. It is found that clear signal was obtained at point A located near the crack tip. The experimental results obtained by the self-reference lock-in processing were shown in Fig. 7. It is found that significant contrast change can be observed at the crack tip due to the singular stress field in the vicinity of the crack tip and the location of the fatigue crack tip is clearly detected by the present technique. It is also found that improved contrast image can be obtained when clear reference signal is employed for self-reference lock-in processing.
Fig. 3 Objective steel deck and experimental setup
Fig. 4 Objective fatigue crack
Fig. 5 Infrared image and points for generating reference signal
Fig. 6 Waveform of reference signal
Fig. 7 Experimental results obtained by the self-reference lock-in processing

