INTRODUCTION
Thermoelastic Stress Analysis (TSA) is based on the principle that under adiabatic and reversible conditions, a cyclically loaded structure experiences temperature variations that are proportional to the sum of the principal stresses. These temperature variations may be measured using a sensitive infra-red detector and thus the cyclic stress field on the surface of the structure may be obtained. In order to achieve the adiabatic and reversible conditions, the test specimen must be cyclically loaded at a high enough frequency to prevent heat transfer, which is not only dependent of the loading frequency, but also stress gradients in the specimen and the thermal conductivity of the material. TSA has been found to be an ideal method to study crack tip strain fields, due to its non-contacting, full-field, data collection capabilities, however the adiabatic assumption breaks down close to the crack tip due to the steep stress gradients. Hence the majority of crack tip studies have focussed on the determination of linear elastic parameters, where data are recorded from regions surrounding the crack tip where the adiabatic and reversible assumptions are valid.
More recently the non-adiabatic region close to the crack tip has been explored, with the aim of gaining a greater understanding of crack-tip plasticity. Infrared thermography has been used to correlate the energy dissipation at the crack tip to the plastic zone [1,2], whereas others [3,4,5] have explored using the TSA phase data to quantify the size and shape of the crack-tip plastic zone. The latter method allows the elastic and plastic strain field information to be recorded simultaneously, and thus has the potential for near real-time studies of fatigue crack growth. Thus far, the phase method has only been applied at fairly low frequencies on aluminium alloys. Since the method considers non-adiabatic effects at the crack tip and heat transfer is known to be dependent on material and frequency, it was decided to investigate the extent of plasticity at the tip of propagating fatigue cracks in two different aerospace materials at a range of frequencies.
CRACK TIP PLASTIC ZONE SIZE USING TSA
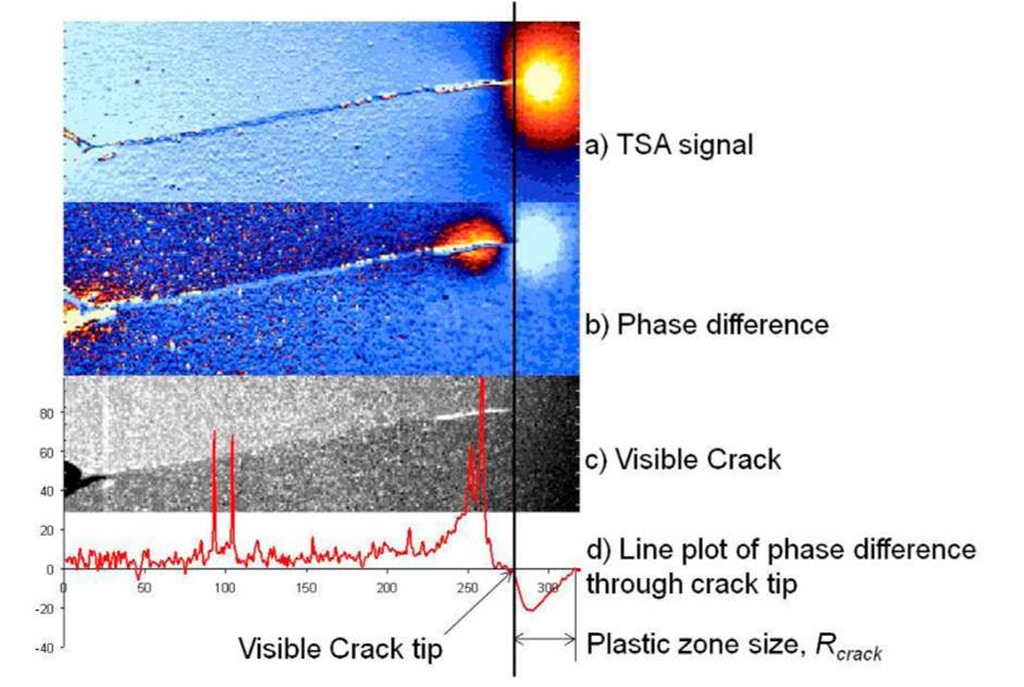
In order to make thermoelastic measurements, the specimen is subjected to a cyclic load and a sensitive infra-red (IR) camera records the temperature variation from the surface of the specimen in the form of a photon flux. The signal recorded by the camera is correlated with a reference signal from the loading device in order to filter out any background IR radiation and extract the TSA signal from the specimen. Each point in the data field may be represented as a vector where the magnitude is the TSA signal and the angle is the phase shift between the thermoelastic and reference signals. If adiabatic and reversible conditions apply, then for a component under uniaxial load, the phase shift will be uniform over the whole specimen. However if stress gradients are steep, there will be a relative phase difference due to non-adiabatic effects. Figure 1 shows the TSA output around the tip of a crack under fatigue loading. The phase in Figure 1(b) has been shifted so that the far field is zero, so the map is really the phase difference relative to the far field. A line plot through the crack tip of the phase difference is shown in Figure 1(d). This phase difference indicates the non-adiabatic region caused by heat generation associated with plastic work and may be used as an estimate of the plastic zone size as indicated in Figure 1(d) [3].The region with a phase of opposite sign behind the crack tip may be attributed to contact of the crack faces, therefore it has been suggested [4] that the transition between positive and negative phase is an indication of the location of the crack tip. This hypothesis may be tested by comparing the map of phase difference with the visible crack in Figure 1(c). In order to enhance the line of the crack a thermal image of the crack under a static load was recorded and the crack tip can be seen clearly. The visible crack tip location coincides with the crack tip location indicated on the phase map, therefore the method of indentifying the crack tip location using the phase map will be taken throughout the remainder of this research. The dimensions of the plastic zone will be found using the method employed by Patki and Patterson [3] who used a binary filter on the map of phase difference to identify the shape and size of the plastic zone from the negative phase difference ahead of the crack tip. One of the dimensions which they used was the distance from the crack tip to the extremity of the negative phase zone in the direction of the crack, R^k (Figure 1(d)).
Fig. 1 TSA data at a fatigue crack tip, showing how the phase difference may be used to size the plastic zone.
PLASTIC ZONE DETERMINATION AT INCREASING FREQUENCY
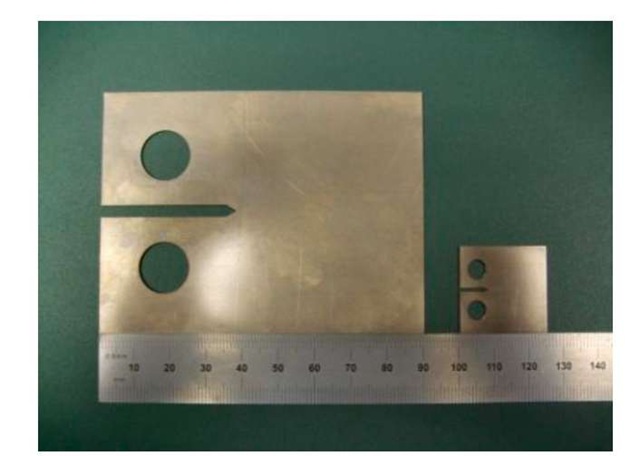
Two aerospace materials were used to explore the measurement of the crack-tip plastic zone using the maps of phase difference: an aluminium alloy 2024 and a commercially pure titanium (CP Ti). The dimensions and material properties are given in Table 1. A compact tension specimen design (BS ISO 12108 (2002))was chosen, but since the material supplied was of different thicknesses, in order to prevent buckling of the thinner titanium, the specimen sizes had to be scaled accordingly (see Figure 2).
Table 1 Dimensions and material properties of the CT specimens
|
All dimensions in mm |
Aluminium alloy 2024 |
Commercially pure titanium |
|
Thickness, B |
2 |
0.7 |
|
Height, H |
67 |
24 |
|
Notch length, a |
20 |
3 |
|
Width from loading holes, W |
72 |
20 |
|
Yield Stress, MPa |
344 |
366 |
|
Modulus of elasticity, GPa |
73 |
99 |
|
KIc, MPaVm |
32 |
44 |
Fig. 2 CT specimens: AL2024 (left); CP titanium (right)
Each specimen was sprayed with a thin coat of matt black paint using an airbrush in order to increase the emissivity of the surface. The aluminium specimen was loaded in a 50kN MTS servo-hydraulic test machine at a frequency of 10Hz with a minimum load of 500N and a maximum load of 1500N, and a fatigue crack was grown until it was 32.75 mm long. The load was then reduced to a mean of 1000N and an amplitude of 100N in order to prevent the crack from growing during the following test. The specimen was loaded at frequencies of 5, 10, 15, 20, 25 and 30Hz, and at each frequency at set of TSA data was captured. Each phase map was shifted so that that far field phase was zero and the plastic zone size was determined using the method proposed by Patki and Patterson [3]. The test was repeated. A similar procedure was followed for the titanium specimen. The titanium specimen was loaded at a frequency of 20Hz with a minimum load of 150N and a maximum load of 450N, and a fatigue crack was grown until the crack length was 7.25 mm. The load was then reduced to a mean of 464 N and an amplitude of 46N. These loads were selected so that![]() The frequency experiment was then repeated twice at this load.
The frequency experiment was then repeated twice at this load.
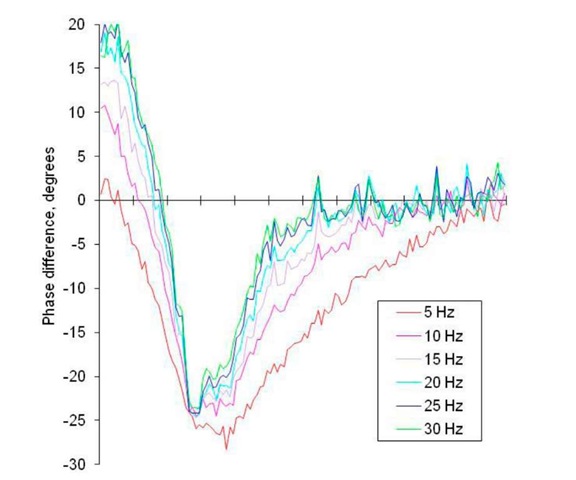
Fig. 3 Line plot of the phase difference through the crack tip of the AL2024 CT specimen at increasing frequency
RESULTS AND DISCUSSION
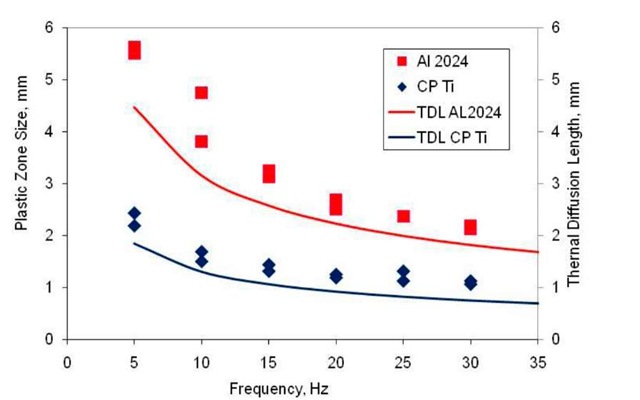
Figure 3 shows a line plot at the same location through the map of phase difference for the AL2024 specimen at each frequency. Figure 4 shows the plastic zone size, Rcrack (see Figure 1(d)), for both materials. On a second axis the thermal diffusion length (TDL) for each material is plotted as a solid line. From Figures 3 and 4 it may be deduced that although the actual plastic zone sizes did not change during these experiments, the measured plastic zone size is dependent on frequency. The measured plastic zone size has the same rate of decrease with frequency as the thermal diffusion length. By increasing the frequency of the test, thermal diffusion length is decreased, thus reducing the heat conduction effects. At a high enough frequency, the rate of change of thermal diffusion length with frequency is negligible, and thus above this frequency, quantitative measurements of the plastic zone may be made. Because heat conduction is material dependant, this limiting frequency will be different for different materials, as can be seen in Figure 4; the limiting frequency is about 30Hz for the AL2024 and 20 Hz for the titanium.
Fig. 4 Measured plastic zone size (left axis) and thermal diffusion length (right axis) for AL2024 and CT Ti at increasing frequency
FURTHER EXPLORATION OF THE PLASTIC ZONE
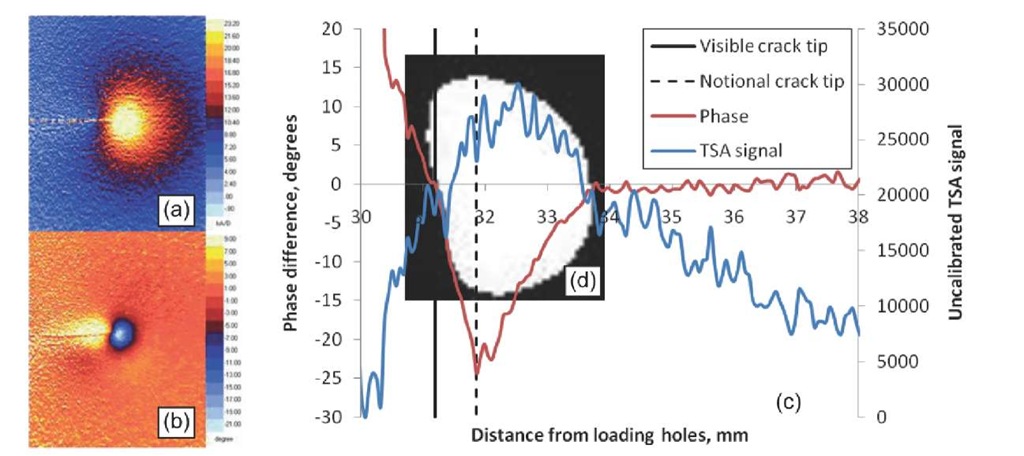
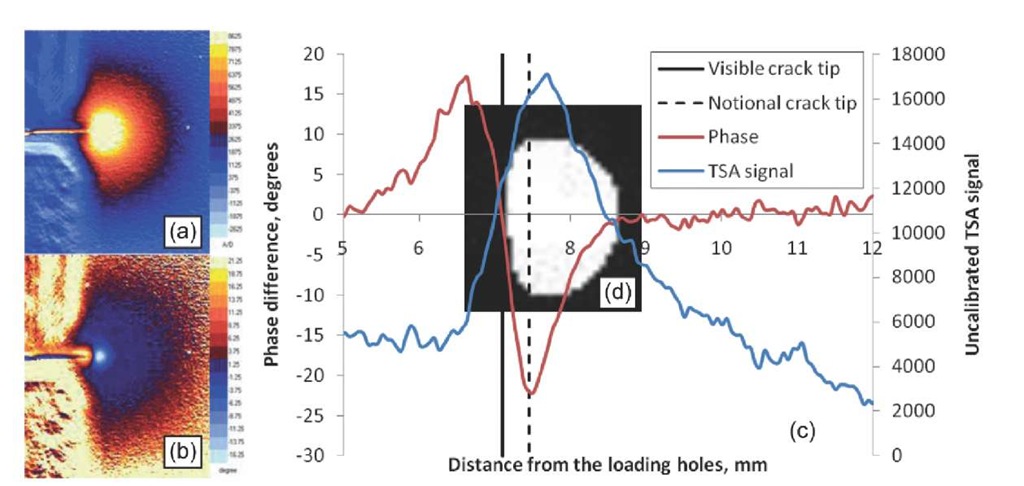
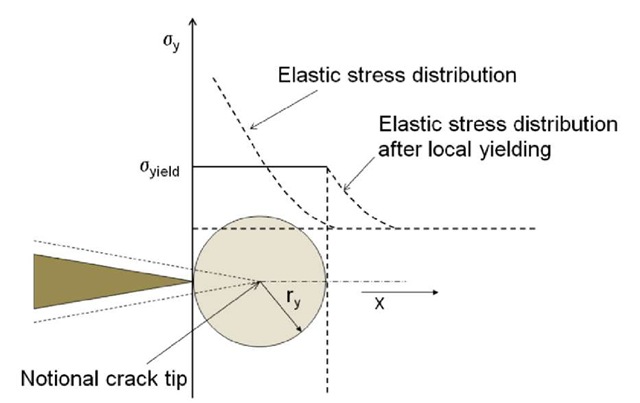
Further experiments were performed to investigate how the plastic zone determined by TSA relates to a theoretical model of crack tip plasticity. Fatigue cracks were grown in additional specimens and TSA data recorded at intervals of crack growth. Data maps and line plots through the crack tip for phase difference and the uncalibrated TSA signal are shown in Figure 5 for the AL2024 and Figure 6 for CP Ti. Data for the longest cracks are presented. The shape of the plastic zone found using the phase difference map is superimposed on the line plot. In his model for crack tip plasticity, Irwin [6] proposed a correction which assumes that the crack is behaving as if it were longer than its physical size. He proposed that the crack has a notional tip ahead of the real one and that the plastic zone centres around this notional crack tip. The elastic stress field is essentially pushed forward ahead of the visible crack tip, as shown in Figure 7, and the plastic zone is approximated to a circle of radius ry, where:
Fig. 5 Maps of (a)TSA signal and (b) phase difference, and (c) line plots through the crack tip of an Aluminium 2024 CT specimen of fatigue crack length = 31.2 mm with mean load = 1000N; load amplitude = 500N; frequency 30Hz. (d) The shape of the plastic zone found using the phase difference map is superimposed on the line plot.
Fig. 6 Maps of (a)TSA signal and (b) phase difference, and (c) line plots through the crack tip of a CP Titanium CT specimen of fatigue crack length = 7.13 mm; mean load = 300N; load amplitude = 150N; frequency 20Hz. (d) The shape of the plastic zone found using the phase difference map is superimposed on the line plot.
Fig. 7 Showing Irwin’s notional crack tip and the estimation of the plastic zone size, 2ry
The elastic stress field equations proposed by Williams [7] were surface fit to the thermoelastic data in Figures 5 and 6 using a Downhill-Simplex method proposed by Diaz et al [4], where the crack tip coordinates (the origin of the stress field equations) were unknowns in the surface fitting routine. It was found that the elastic stress field which fits the TSA data has its origin at a point ahead of the crack, rather than at the visible crack tip. This origin of the elastic stress field exactly coincided with the minimum of the phase difference, and is shown in Figures 5 and 6 as the dotted vertical line. So the minimum of the phase difference could be used as a way to identify the origin of the elastic stress field and that this is the location of the "notional" crack tip. Irwin’s correction assumes the origin of the elastic field to be in the centre of a circle of radius ry from the visible crack tip. However the origin found from TSA is not in the centre of the plastic zone "size", Rcrack (see Figure 1). Also the plastic zone shape found from this method is not a circle as suggested by Irwin, but a kidney shape, as can be seen in Figures 5 and 6.
By inspecting Figure 2, it may be seen that, with the exception of the data recorded at 5 Hz, the minimum of the phase difference does not change location with respect to the phase map. However, the determined location of the visible crack tip, and also the plastic zone size, Rcrack, change with increasing frequency. So, the determined location of the notional crack tip does not appear to be affected by the adiabatic assumption, whereas the plastic zone size must be determined at a high enough frequency as to ensure adiabatic conditions. Further work is needed to explore these ideas but the results appear to partially support Irwin’s theory.
CONCLUSIONS
The evidence presented here supports the idea proposed by Irwin of a notional crack tip ahead of the visible crack tip, but not its location relative to the plastic zone size and the visible crack tip. It is suggested that the minimum of the phase difference could be used as a way to identify the origin of the elastic stress field and that this is the location of the "notional" crack tip. It is also found that the method of using the phase difference to determine the size and shape of the crack-tip plastic zone is highly dependent on frequency and material.
