Thermoelastic response
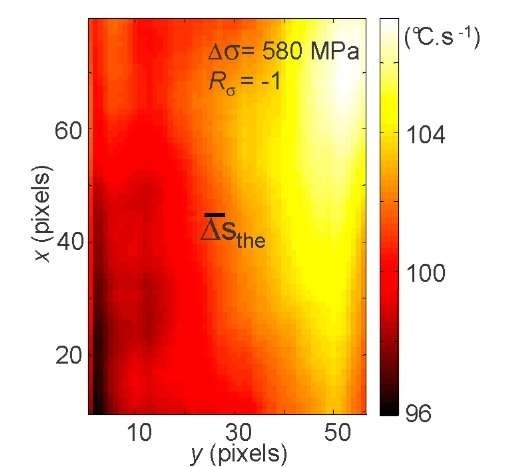
Until crack onset, we observed quasi-uniform patterns of thermoelastic nature as expected for a simple tension-compression test. Besides, the experiments showed that Asthe increased linearly with stress and the load frequency as predicted by a linear thermoelastic law [5]. An example of the distribution of thermoelastic source amplitudes is given in Fig.6.
Fig. 6 2D distribution of mean thermoelastic sources ![]() averaged over the 5 loading block
averaged over the 5 loading block
This 2D distribution is the mean thermoelastic source amplitudes averaged over the fifth loading block. The two main features to note are the quite good homogeneity of the coupling source field and the order of magnitude of the thermoelastic effects. The mean value of Asthe over the gage part of the specimen is around 101.9 °C.s-1 with a standard deviation of about 2.4 C.s-1. Considering the HCF of steel, this heat source amplitude order of magnitude is typically a hundred to a thousand times greater than the dissipation intensities, as shown hereafter (cf. Fig.7). This difference in order of magnitude of both types of sources markedly complicates the image processing. Indeed, the underlying dissipation sources, even those of low intensity, are essential for understanding the fatigue mechanism development, and must be carefully extracted from the overall heat sources.
Dissipation field properties
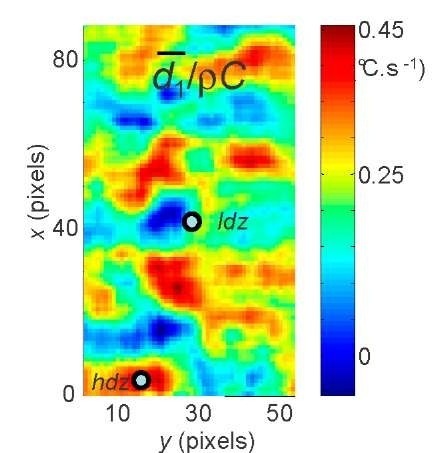
Contrary to thermoelastic source fields, heterogeneous distributions of dissipative sources were systematically observed (Fig. 7a). During a fatigue block, this pattern remains spatially constant whatever the set of loading parameters as long as the fatigue effects are minor and do not herald a crack inception [5]. We associated the time independence of the heterogeneous distribution of dissipation with the low development of persistent slip bands (PSB) concentrated in a few grains [11]. We then interpreted the rapid evolution and strong narrowing of the highest dissipation zone as a sign of material damage leading to the crack inception. The experimental method thus enabled us to detect this crack localization several thousands of cycles before its onset.
Fig. 7 Example of a heterogeneous distribution of dissipation averaged over a mini block:![]() MPa,
MPa, ![]() The circles locate low and high dissipation zones, respectively [5]
The circles locate low and high dissipation zones, respectively [5]
The calorimetric analysis also showed that d1 linearly increases with the loading frequency at constant loading amplitude at every point of the sample gage part, and despite the heterogeneous response of the material. Fig.8 shows 2 examples of mean intrinsic dissipation per block d1 as a function of Ao and of fL.
Fig. 8 Evolution of the mean dissipation per (mini) block as a function of the stress range Ao and of the loading frequency fL. On the left: "low" dissipation zone, on the right: "high" dissipation zone [5]
Two zones were chosen (low/high dissipation zones) to show that, regardless of the zone, the dissipation surfaces were similar, which means that the microstructural mechanisms would probably be the same when they do not have the same intensity. In particular, the linear evolution of dissipation as a function of the loading frequency was compatible with the rate independent formalism of plastic damageable materials. No viscous or yield effects were observable here from a dissipative standpoint.
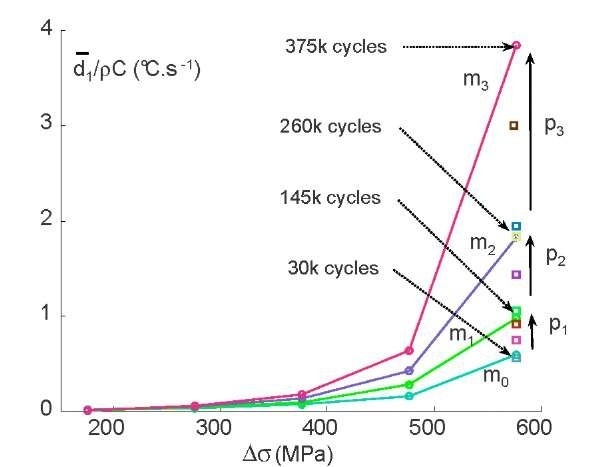
Fig. 9 shows the drift of intrinsic dissipation along with the number of cycles for different stress ranges. The mean dissipation values were computed for the period corresponding to a mini block (i.e. 100 seconds) and averaged over the sample gage part. The curves associated with mini-block series were interpreted as the dissipative signature of the microstructural state at different stress ranges for an approximately constant fatigue state. This signature was associated with the number of active PSBs. In general these PSBs are randomly oriented within a few grains and the greater the stress intensity, the larger the number of activated PSBs. For large blocks, performed close to the fatigue limit (AoL«540 MPa when Ro=-1), the monotonous increase in dissipation during such blocks was the energy manifestation of the fatigue progress.
Fig. 9 Drift of the mean dissipation
Discussion on the size of dissipation zones
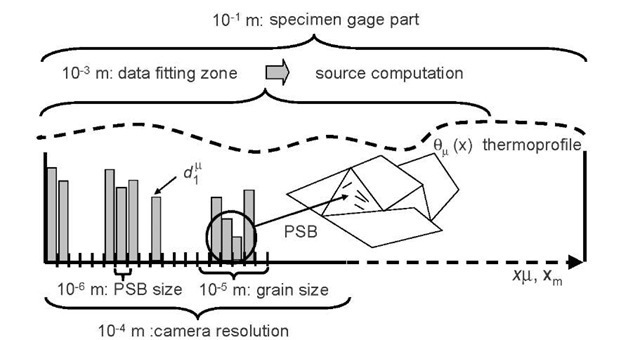
In Fig. 7, we observe that the order of magnitude of zones that dissipated preferentially was about 10-20 pixels, corresponding to 1-2 mm. This size is naturally surprising considering the size of PSBs, which is about 1 pm. To be convinced by such mesoscopic effects, we considered that dissipative heat sources were induced by activated PSBs. The grain size was chosen to be equal to 10 pM and we supposed that only a few grains had PSBs (see Fig. 10).
Fig. 10 Characteristic lengths associated with HCF dissipation
However, it would be interesting to also characterize these potential crack zones in terms of stored energy evolution.
Fig. 12 Fields of the mean energy balance associated with a cycle [12]
Concluding comments
In this paper, an infrared image processing method that enables estimates of deformation energy, coupling and dissipative sources accompanying HCF of steel is presented.
Applications to Dual Phase 600 steel sheets showed a linear change in the thermoelastic source amplitude as a function of the stress range and the loading frequency, in agreement with the linear thermoelasticity theory. We also observed a heterogeneous dissipation distribution from the beginning of the test. This space distribution remained time independent and did not change with the stress range and/or the loading ratio until fatigue crack onset. The linear variation in the dissipation intensity with the loading frequency was also underlined. In terms of structural design, this method may be useful for detecting fatigue zones. Thermoelasticity is already used to detect potential crack localization due to stress concentrations on structures (see TSA methods [14]). In terms of material analysis, obtaining the distribution of thermoelastic and dissipative sources represents precious information for anyone wishing to model fatigue mechanisms. The coupling sources are indeed related to the constitutive state equations while the dissipation is an indicator of the fatigue kinetics and must be associated with the evolution equations. Moreover, the dissipation fields enabled us to observe fatigue mechanisms at a finer scale insofar as dissipation is mainly due to the development of persistent slip bands. Micro-analyses are currently under way to correlate PSB density fields with dissipation fields.


![Evolution of the mean dissipation per (mini) block as a function of the stress range Ao and of the loading frequency fL. On the left: "low" dissipation zone, on the right: "high" dissipation zone [5] Evolution of the mean dissipation per (mini) block as a function of the stress range Ao and of the loading frequency fL. On the left: "low" dissipation zone, on the right: "high" dissipation zone [5]](http://what-when-how.com/wp-content/uploads/2011/07/tmpFC91_thumb_thumb_thumb.jpg)


![Fields of the mean energy balance associated with a cycle [12] Fields of the mean energy balance associated with a cycle [12]](http://what-when-how.com/wp-content/uploads/2011/07/tmpFC94_thumb_thumb_thumb.jpg)
