E:
Abbreviation for expected value.
Early detection program:
Synonymous with screening studies.
EAST:
A computer package for the design and analysis of group sequential clinical trials. See also PEST.
Eberhardt’s statistic:
A statistic, A, for assessing whether a large number of small items within a region are distributed completely randomly within the region. The statistic is based on the Euclidean distance, Xj from each of m randomly selected sampling locations to the nearest item and is given explicitly by
EBM:
Abbreviation for evidence-based medicine.
ECM algorithm:
An extension of the EM algorithm that typically converges more slowly than EM in terms of iterations but can be faster in total computer time. The basic idea of the algorithm is to replace the M-step of each EM iteration with a sequence of S > 1 conditional or constrained maximization or CM-steps, each of which maximizes the expected complete-data log-likelihood found in the previous E-step subject to constraints on the parameter of interest, 0, where the collection of all constraints is such that the maximization is over the full parameter space of 0. Because the CM maximizations are over smaller dimensional spaces, often they are simpler, faster and more reliable than the corresponding full maximization called for in the M-step of the EM algorithm. See also ECME algorithm. [Statistics in Medicine, 1995, 14, 74768.]
ECME algorithm:
The Expectation/Conditional Maximization Either algorithm which is a generalization of the ECM algorithm obtained by replacing some CM-steps of ECM which maximize the constrained expected complete-data log-likelihood, with steps that maximize the correspondingly constrained actual likelihood. The algorithm can have substantially faster convergence rate than either the EM algorithm or ECM measured using either the number of iterations or actual computer time. There are two reasons for this improvement. First, in some of ECME’s maximization steps the actual likelihood is being conditionally maximized, rather than a current approximation to it as with EM and ECM. Secondly, ECME allows faster converging numerical methods to be used on only those constrained maximizations where they are most efficacious.
Ecological fallacy:
A term used when spatially aggregated data are analysed and the results assumed to apply to relationships at the individual level. In most cases analyses based on area level means give conclusions very different from those that would be obtained from an analysis of unit level data. An example from the literature is a correlation coefficient of 0.11 between illiteracy and being foreign born calculated from person level data, compared with a value of —0.53 between percentage illiterate and percentage foreign born at the State level.
Ecological statistics:
Procedures for studying the dynamics of natural communities and their relation to environmental variables.
EDA:
Abbreviation for exploratory data analysis.
ED50:
Abbreviation for median effective dose.
Edgeworth, Francis Ysidro (1845-1926):
Born in Edgeworthstown, Longford, Ireland, Edgeworth entered Trinity College, Dublin in 1862 and in 1867 went to Oxford University where he obtained a first in classics. He was called to the Bar in 1877. After leaving Oxford and while studying law, Edgeworth undertook a programme of self study in mathematics and in 1880 obtained a position as lecturer in logic at Kings College, London later becoming Tooke Professor of Political Economy. In 1891 he was elected Drummond Professor of Political Economy at Oxford and a Fellow of All Souls, where he remained for the rest of his life. In 1883 Edgeworth began publication of a sequence of articles devoted exclusively to probability and statistics in which he attempted to adapt the statistical methods of the theory of errors to the quantification of uncertainty in the social, particularly the economic sciences. In 1885 he read a paper to the Cambridge Philosophical Society which presented, through an extensive series of examples, an exposition and interpretation of significance tests for the comparison of means. Edgeworth died in London on 13 February 1926.
Edgeworth’s form of the Type A series:
An expression for representing a probability distribution, f (x), in terms of Chebyshev-Hermite polynomials, Hr, given explicitly by
where Kf are the cumulants off(x) and
Essentially equivalent to the Gram-Charlier Type A series.
Effect:
Generally used for the change in a response variable produced by a change in one or more explanatory or factor variables.
Effective sample size:
The sample size after dropouts, deaths and other specified exclusions from the original sample.
A term used in industrial experimentation, where there is often a large set of candidate factors believed to have possible significant influence on the response of interest, but where it is reasonable to assume that only a small fraction are influential.
Efficiency:
A term applied in the context of comparing different methods of estimating the same parameter; the estimate with lowest variance being regarded as the most efficient. Also used when comparing competing experimental designs, with one design being more efficient than another if it can achieve the same precision with fewer resources.
EGRET:
Acronym for the Epidemiological, Graphics, Estimation and Testing program developed for the analysis of data from studies in epidemiology. Can be used for logistic regression and models may include random effects to allow overdispersion to be modelled. The beta-binomial distribution can also be fitted. [Statistics & Epidemiology Research Corporation, 909 Northeast 43rd Street, Suite 310, Seattle, Washington 98105, USA.]
Ehrenberg’s equation:
An equation linking the height and weight of children between the ages of 5 and 13 and given by log wv = 0.8h + 0.4 where wv is the mean weight in kilograms and h the mean height in metres. The relationship has been found to hold in England, Canada and France. [Indian Journal of Medical Research, 1998, 107, 406-9.]
Eigenvalues:
The roots, X1,X2,… ,Xq of the qth-order polynomial defined by
|A – XI|
where A is a q x q square matrix and I is an identity matrix of order q. Associated with each root is a non-zero vector z, satisfying
Az i = XjZj
and z, is known as an eigenvector of A. Both eigenvalues and eigenvectors appear frequently in accounts of techniques for the analysis of multivariate data such as principal components analysis and factor analysis. In such methods, eigenvalues usually give the variance of a linear function of the variables, and the elements of the eigenvector define a linear function of the variables with a particular property.
Eisenhart, Churchill (1913-1994):
Born in Rochester, New York, Eisenhart received an A.B. degree in mathematical physics in 1934 and an A.M. degree in mathematics in 1935. He obtained a Ph.D from University College, London in 1937, studying under Egon Pearson, Jerzy Neyman and R.A. Fisher. In 1946 Eisenhart joined the National Bureau of Standards and undertook pioneering work in introducing modern statistical methods in experimental work in the physical sciences. He was President of the American Statistical Society in 1971. Eisenhart died in Bethesda, Maryland on 25 June 1994.
Electronic mail:
The use of computer systems to transfer messages between users; it is usual for messages to be held in a central store for retrieval at the user’s convenience.
Elfving, Erik Gustav (1908-1984):
Born in Helsinki, Elfving studied mathematics, physics and astronomy at university but after completing his doctoral thesis his interest turned to probability theory. In 1948 he was appointed Professor of Mathematics at the University of Helsinki from where he retired in 1975. Elfving worked in a variety of areas of theoretical statistics including Markov chains and distribution free methods. After his retirement Elfving wrote a monograph on the history of mathe matics in Finland between 1828 and 1918, a period of Finland’s autonomy under Russia. He died on 25 March 1984 in Helsinki.
Elliptically symmetric distributions:
Multivariate probability distributions of the form, f (x)=|£Pg[(x - i)'£-1(x - i)] By varying the function g, distributions with longer or shorter tails than the normal can be obtained. [MV1 Chapter 2.]
Email:
Abbreviation for electronic mail.
EM algorithm:
A method for producing a sequence of parameter estimates that, under mild regularity conditions, converges to the maximum likelihood estimator. Of particular importance in the context of incomplete data problems. The algorithm consists of two steps, known as the E, or Expectation step and the M, or Maximization step. In the former, the expected value of the log-likelihood conditional on the observed data and the current estimates of the parameters, is found. In the M-step, this function is maximized to give updated parameter estimates that increase the likelihood. The two steps are alternated until convergence is achieved. The algorithm may, in some cases, be very slow to converge. See also finite mixture distributions, imputation, ECM algorithm and ECME algorithm. [KA2 Chapter 18.]
Empirical:
Based on observation or experiment rather than deduction from basic laws or theory.
Empirical Bayes method:
A procedure in which the prior distribution needed in the application of Bayesianinference, is determined from empirical evidence, namely the same data for which the posterior distribution is maximized.
Empirical distribution function:
A probability distribution function estimated directly from sample data without assuming an underlying algebraic form.
Empirical logits:
The logistic transformation of an observed proportion y /n, adjusted so that finite values are obtained when y, is equal to either zero or w,. Commonly 0.5 is added to both y, and n,.
End-aversion bias:
A term which refers to the reluctance of some people to use the extreme categories of a scale. See also acquiescence bias.
Endogenous variable:
A term primarily used in econometrics to describe those variables which are an inherent part of a system. In most respects, such variables are equivalent to the response or dependent variable in other areas. See also exogeneous variable.
Endpoint:
A clearly defined outcome or event associated with an individual in a medical investigation. A simple example is the death of a patient.
Entropy:
A measure of amount of information received or output by some system, usually given in bits. [MV1 Chapter 4.]
Entropy measure:
A measure, H, of the dispersion of a categorical random variable, Y, that assumes the integral values j, 1 < j < s with probability pj, given by
Environmental statistics:
Procedures for determining how quality of life is affected by the environment, in particular by such factors as air and water pollution, solid wastes, hazardous substances, foods and drugs.
Epidemic:
The rapid development, spread or growth of a disease in a community or area.
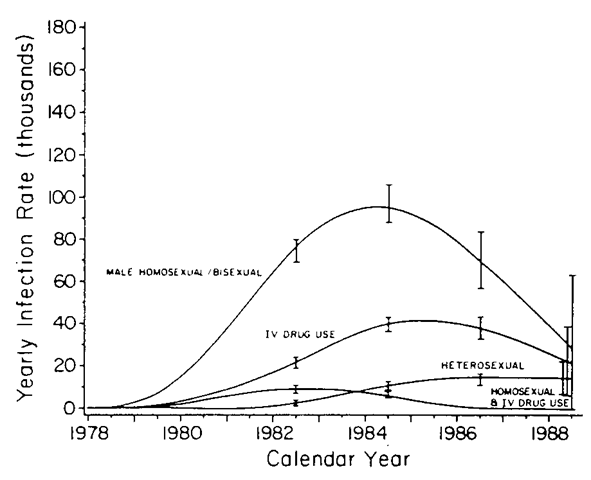
Statistical thinking has made significant contributions to the understanding of such phenomena. A recent example concerns the Acquired Immunodeficiency Syndrome (AIDS) where complex statistical methods have been used to estimate the number of infected individuals, the incubation period of the disease, the aetiology of the disease and monitoring and forecasting the course of the disease. Figure 60, for example, shows the annual numbers of new HIV infections in the US by risk group based on a deconvolution of AIDS incidence data. [Methods in Observational Epidemiology, 1986, J.L. Kelsey, W.D. Thompson and A.S. Evans, Oxford University Press, New York.]
Fig. 60 Epidemic illustrated by annual numbers of new HIV infections in the US by risk group.
Epidemic curve:
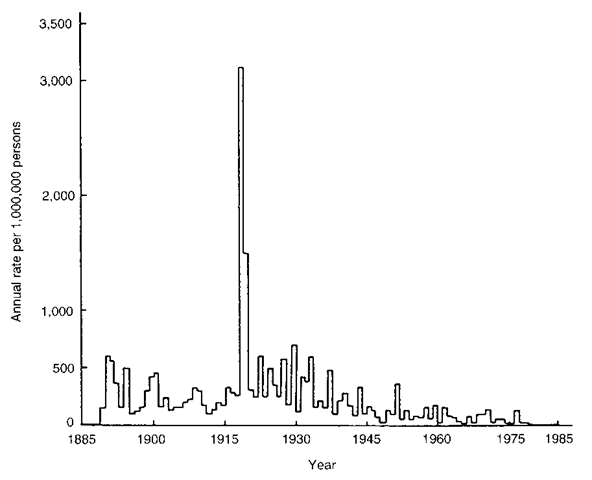
A plot of the number of cases of a disease against time. A large and sudden rise corresponds to an epidemic. An example is shown in Fig. 61.
Epidemic model:
A model for the spread of an epidemic in a population. Such models may be deterministic, spatial or stochastic.
Epidemic threshold:
The value above which the susceptible population size has to be for an epidemic to become established in a population.
Epidemiology:
The study of the distribution and size of disease problems in human populations, in particular to identify aetiological factors in the pathogenesis of disease and to provide the data essential for the management, evaluation and planning of services for the prevention, control and treatment of disease. See also incidence, prevalence, prospective study and retrospective study. [An Introduction to Epidemiology, 1983, M. Alderson, Macmillan, London.]
Epi Info:
Free software for performing basic sample size calculations, developing a study questionnaire, performing statistical analyses, etc.
EPILOG PLUS:
Software for epidemiology and clinical trials.
Fig. 61 Epidemic curve of influenza mortality in England and Wales 1885-1985.
EPITOME:
An epidemiological data analysis package developed at the National Cancer Institute in the US.
Epstein test:
A test for assessing whether a sample of survival times arise from an exponential distribution with constant failure rate against the alternative that the failure rate is increasing.
EQS:
A software package for fitting structural equation models.
Ergodicity:
A property of many time-dependent processes, such as certain Markov chains, namely that the eventual distribution of states of the system is independent of the initial state.
Erlangian distribution:
A gamma distribution in which the parameter y takes integer values. Arises as the time to the vth event in a Poisson process.
Error distribution:
The probability distribution, f (x), given by
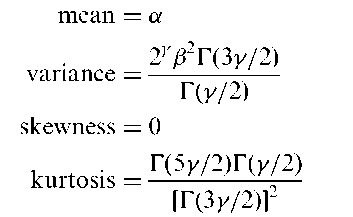
a is a location parameter, f is a scale parameter, and y a shape parameter. The mean, variance, skewness and kurtosis of the distribution are as follows:
The distribution is symmetric, and for y > 1 is leptokurtic and for y < 1 is platy-kurtic. For a = 0, f = y = 1 the distribution corresponds to a standard normal distribution.
Error rate:
The proportion of subjects misclassified by a classification rule derived from a discriminant analysis.
Error rate estimation:
A term used for the estimation of the misclassification rate in discriminant analysis. Many techniques have been proposed for the two-group situation, but the multiple-group situation has very rarely been addressed. The simplest procedure is the resubstitution method, in which the training data are classified using the estimated classification rule and the proportion incorrectly placed used as the estimate of the misclassification rate. This method is known to have a large optimistic bias, but it has the advantage that it can be applied to multigroup problems with no modification. An alternative method is the leave one out estimator, in which each observation in turn is omitted from the data and the classification rule recomputed using the remaining data. The proportion incorrectly classified by the procedure will have reduced bias compared to the resubstitution method. This method can also be applied to the multigroup problem with no modification but it has a large variance. See also b632 method.
Errors of classification:
A term most often used in the context of retrospective studies, where it is recognized that a certain proportion of the controls may be at an early stage of disease and should have been diagnosed as cases. Additionally misdiagnosed cases might be included in the disease group. Both errors lead to underestimates of the relative risk.
Errors of the third kind:
Giving the right answer to the wrong question! (Not to be confused with Type III error.)
Estimating functions:
Functions of the data and the parameters of interest which can be used to conduct inference about the parameters when the full distribution of the observations is unknown. This approach has an advantage over methods based on the likelihood since it requires the specification of only a few moments of the random variable involved rather than the entire probability distribution. The most familiar example is the quasi-score estimating function
where k is the n x 1 vector of mean responses, 9 is a q x 1 vector of regression coefficients relating explanatory variables to k and Vk denotes the n x n variance-covariance matrix of the responses. See also quasi-likelihood and generalized estimating equations.
Estimation:
The process of providing a numerical value for a population parameter on the basis of information collected from a sample. If a single figure is calculated for the unknown parameter the process is called point estimation. If an interval is calculated which is likely to contain the parameter, then the procedure is called interval estimation. See also least squares estimation, maximum likelihood estimation, and confidence interval. [KA1 Chapter 9.]
Estimator:
A statistic used to provide an estimate for a parameter. The sample mean, for example, is an unbiased estimator of the population mean.
Etiological fraction:
Synonym for attributable risk.
Euclidean distance:
For two observations x’ = [x1, x2,..., xq] and y’ = [y1, y2,..., yq] from a set of multivariate data, the distance measure given by
EU model:
A model used in investigations of the rate of success of in vitro fertilization (IVF), defined in terms of the following two parameters. .
Assuming the two events, viable embryro and receptive uterus, are independent, the probability of observing j implantations out of i transferred embryos is given by
The probability of at least one implantation out of i transferred embryos is given by
and the probability of no implantations by
The parameters u and e can be estimated by maximum likelihood estimation from observations on the number of attempts at IVF with j implantations from i transferred. See also Barrett and Marshall model for conception.
Evaluable patients:
The patients in a clinical trial regarded by the investigator as having satisfied certain conditions and, as a result, are retained for the purpose of analysis. Patients not satisfying the required condition are not included in the final analysis.
Event history data:
Observations on a collection of individuals, each moving among a small number of states. Of primary interest are the times taken to move between the various states, which are often only incompletely observed because of some form of censoring. The simplest such data involves survival times.
Evidence-based medicine (EBM):
Described by its leading proponent as ‘the conscientious, explicit, and judicious uses of current best evidence in making decisions about the care of individual patients, and integrating individual clinical experience with the best available external clinical evidence from systematic research’. [Evidence Based Medicine, 1996, 1, 98-9.]
Excel:
Software that started out as a spreadsheet aiming at manipulating tables of number for financial analysis, which has now grown into a more flexible package for working with all types of information. Particularly good features for managing and annotating data.
Excess hazard models:
Models for the excess mortality, that is the mortality that remains when the expected mortality calculated from life tables, is subtracted.
Excess hazards model:
A model for survival data in cases when what is of interest is to model the excess mortality that is the result of subtracting the expected mortality calculated from ordinary life tables.
Excess risk:
The difference between the risk for a population exposed to some risk factor and the risk in an otherwise identical population without the exposure. See also attributable risk.
Exchangeability:
A term usually attributed to Bruno De Finettiand introduced in the context of personal probability to describe a particular sense in which quantities treated as random variables in a probability specification are thought to be similar. Formally it describes a property possessed by a set of random variables, X1, X2,… which, for all n > 1 and for every permutation of the n subscripts, the joint distributions of Xj > X’2 >… > Xjn are identical. Central to some aspects of Bayesian inference and randomization tests. [KA1 Chapter 12.]
Exhaustive:
A term applied to events B1, B2,…, Bk for which Uk=1Bi = ^ where ^ is the sample space.
Exogeneous variable:
A term primarily used in econometrics to describe those variables that impinge on a system from outside. Essentially equivalent to what are more commonly known as explanatory variables. See also endogenous variable. [MV2 Chapter 11.]
Expected frequencies:
A term usually encountered in the analysis of contingency tables.
Such frequencies are estimates of the values to be expected under the hypothesis of interest. In a two-dimensional table, for example, the values under independence are calculated from the product of the appropriate row and column totals divided by the total number of observations.
Expected value:
The mean of a random variable, X, generally denoted as E(X). If the variable is discrete with probability distribution, Pr(X = x), then E(X) = xPr(X = x). If the variable is continuous the summation is replaced by an integral. The expected value of a function of a random variable, f (x), is defined similarly, i.e.
where g(x) is the probability distribution of x.
Experimental design:
The arrangement and procedures used in an experimental study. Some general principles of good design are, simplicity, avoidance of bias, the use of random allocation for forming treatment groups, replication and adequate sample size.
Experimental study:
A general term for investigations in which the researcher can deliberately influence events, and investigate the effects of the intervention. Clinical trials and many animal studies fall under this heading.
Experimentwise error rate:
Synonym for per-experiment error rate.
Expert system:
Computer programs designed to mimic the role of an expert human consultant. Such systems are able to cope with the complex problems of medical decision making because of their ability to manipulate symbolic rather than just numeric information and their use of judgemental or heuristic knowledge to construct intelligible solutions to diagnostic problems. Well known examples include the MYCIN system developed at Stanford University, and ABEL developed at MIT. See also computer-aided diagnosis and statistical expert system. [Statistics in Medicine, 1985, 4, 311-16.]
Explanatory analysis:
A term sometimes used for the analysis of data from a clinical trial in which treatments A and B are to be compared under the assumption that patients remain on their assigned treatment throughout the trial. In contrast a pragmatic analysis of the trial would involve asking whether it would be better to start with A (with the intention of continuing this therapy if possible but the willingness to be flexible) or to start with B (and have the same intention). With the explanatory approach the aim is to acquire information on the true effect of treatment, while the pragmatic aim is to make a decision about the therapeutic strategy after taking into account the cost (e.g. withdrawal due to side effects) of administering treatment. See also intention-to-treat analysis. [Statistics in Medicine, 1988, 7, 1179-86.]
Explanatory trials:
A term sometimes used to describe clinical trials that are designed to explain how a treatment works.
Explanatory variables:
The variables appearing on the right-hand side of the equations defining, for example, multiple regression or logistic regression, and which seek to predict or ‘explain’ the response variable. Also commonly known as the independent variables, although this is not to be recommended since they are rarely independent of one another.
Exploratory data analysis:
An approach to data analysis that emphasizes the use of informal graphical procedures not based on prior assumptions about the structure of the data or on formal models for the data. The essence of this approach is that, broadly speaking, data are assumed to possess the following structure Data = Smooth + Rough where the ‘Smooth’ is the underlying regularity or pattern in the data. The objective of the exploratory approach is to separate the smooth from the ‘Rough’ with minimal use of formal mathematics or statistical methods. See also initial data analysis.
Exponential autoregressive model:
An autoregressive model in which the ‘parameters’ are made exponential functions of Xt_ 1, that is
Exponential autoregressive model:
An autoregressive model in which the ‘parameters’ are made exponential functions of Xt_ 1, that is
Exponential distribution:
The probability distribution f (x) given by
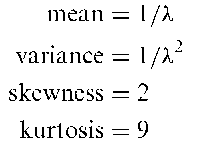
The mean, variance, skewness and kurtosis of the distribution are as follows:
The distribution of intervals between independent consecutive random events, i.e. those following a Poisson process.
Exponential family:
A family of probability distributions of the form
where 0 is a parameter and a, b, c, d are known functions. Includes the normal distribution, gamma distribution, binomial distribution and Poisson distribution as special cases. The binomial distribution, for example, can be written in the form above as follows:
Exponentially weighted moving average control chart: An alternative form of cusum based on the statistic
together with upper control and lower control limits. The starting value Z0 is often taken to be the target value. The sequentially recorded observations, Y, can be individually observed values from the process, although they are often sample averages obtained from a designated sampling plan. The process is considered out of control and action should be taken whenever Zf falls outside the range of the control limits. An example of such a chart is shown in Fig. 62.
Exponential order statistics model:
A model that arises in the context of estimating the size of a closed population where individuals within the population can be identified only during some observation period of fixed length, say T > 0, and when the detection times are assumed to follow an exponential distribution with unknown rate A.
Exponential power distribution:
Synonym for error distribution.
Exponential trend:
A trend, usually in a time series, which is adequately described by an equation of the form y = abx.
Exposure effect:
A measure of the impact of exposure on an outcome measure. Estimates are derived by contrasting the outcomes in an exposed population with outcomes in an unexposed population or in a population with a different level of exposure. See also attributable risk and excess risk.
Exposure factor:
Synonym for risk factor.
Fig. 62 Example of an exponentially weighted moving average control chart.
Extra binomial variation:
A form of overdispersion.
Extraim analysis:
An analysis involving increasing the sample size in a clinical trial that ends without a clear conclusion, in an attempt to resolve the issue of say a group difference that is currently marginally non-significant. As in interim analysis, significance levels need to be suitably adjusted.
Extrapolation:
The process of estimating from a data set those values lying beyond the range of the data. In regression analysis, for example, a value of the response variable may be estimated from the fitted equation for a new observation having values of the explanatory variables beyond the range of those used in deriving the equation. Often a dangerous procedure.
Extremal quotient:
Defined for nonnegative observations as the ratio of the largest observation in a sample to the smallest observation.
Fig. 63 Examples of extreme value distribution for a = 2 and /5 = 1,3 and 5.
Extreme value distribution:
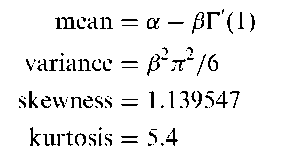
The probability distribution, f (x), of the largest extreme given by
The location parameter, a is the mode and f is a scale parameter. The mean, variance skewness and kurtosis of the distribution are as follows:
where T’(1) = —0.57721 is the first derivative of the gamma function, T(n) with respect to n at n = 1. The distribution of the maximum value of n-independent random variables with the same continuous distribution as n tends to infinity. See also bivariate Gumbel distribution.
Extreme values:
The largest and smallest variate values among a sample of observations.
Important in many areas, for example flood levels of a river, wind speeds and snowfall. Statistical analysis of extreme values aims to model their occurrence and size with the aim of predicting future values.
Eyeball test:
Informal assessment of data simply by inspection and mental calculation allied with experience of the particular area from which the data arise.


