Treatment of a single scan
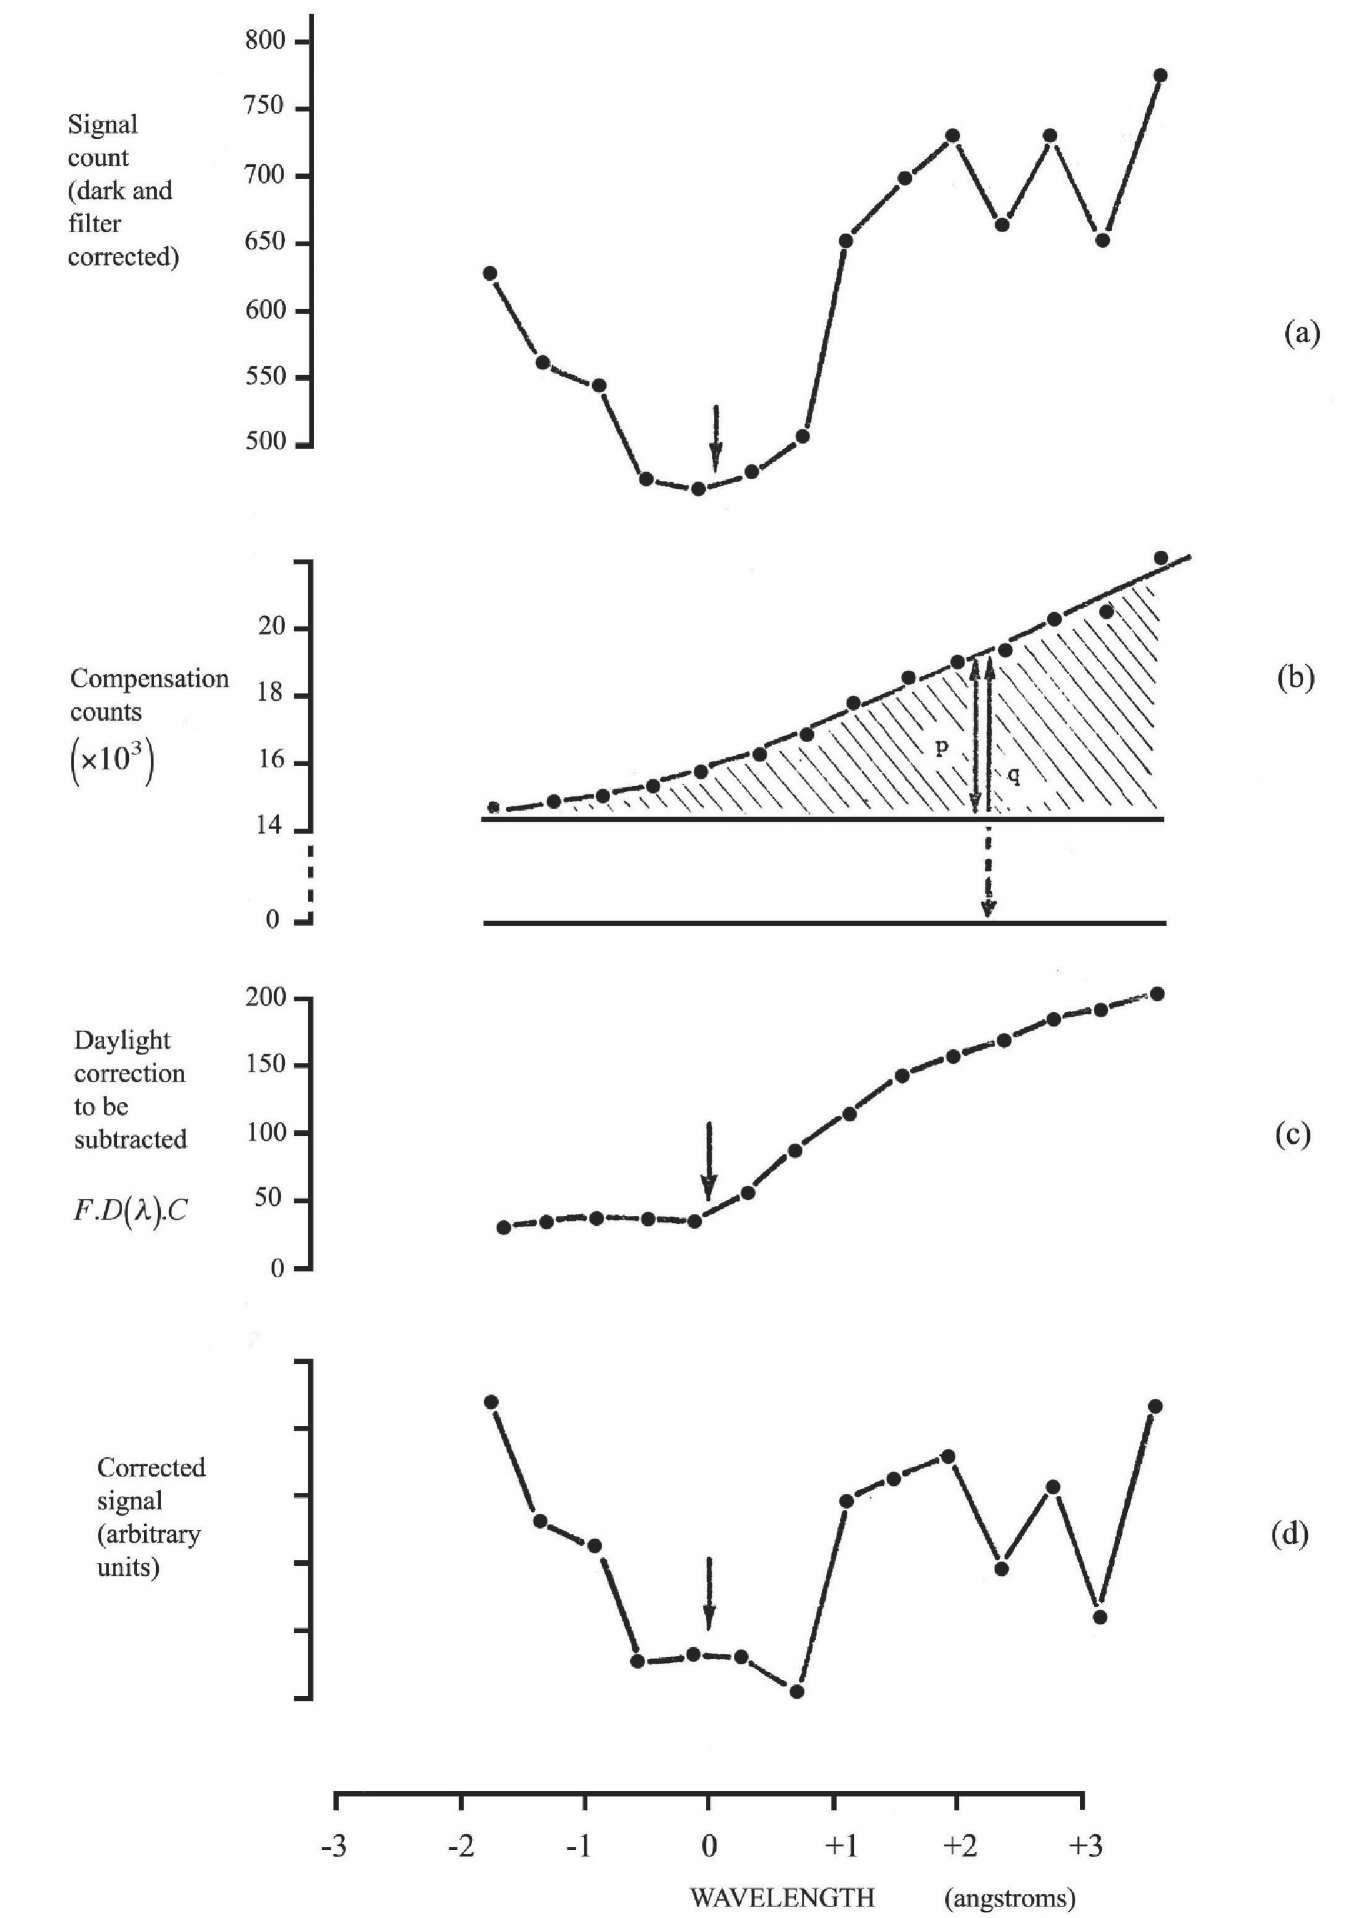
A typical ‘raw data’ scan is shown in Figure 3.7a,which is plotted directly from the printout values of the signal channel. In the diagram the scale of lamp number has already been converted to a wavelength scale, as was done for each scan using the results of section 3.2. The arrow indicates the position of 5183.6 A as determined from the two associated finesse scans of the Magnesium lamp, before and after.
Figure 3.7b shows the corresponding compensation channel record, and Figure 3.7c plots the filter shape, an average of scans of a tungsten source performed at the beginning and end of the night’s observing. Starting with data (a), the dark count (~ 60) was subtracted from each point, and the resulting true signal count divided by (b) and by (c), giving the required compensation in overall light level. The result is shown in Figure 3.7d. Figure 3.7e shows a typical averaged spectrum, the result of combining the data from several scans of the same region of sky (discussed in topic 4).
The spectra were multiplied by a constant in each case, which was adapted to produce a ‘normalisation’ taking into account the various changes in ‘comp’ channel geometry and fore-optics during the experiments. This enabled a direct comparison to be made between the intensities of scans taken at different times, sometimes showing up unusual atmospheric conditions. The fall-off at the edges of the raw data scan is seen to have been entirely due to the interference filter, and the Poissonian error bars are consequently large for these ‘edge’ points.
The whole process of plotting the two filter scans for each night with their associated finesse scans, lining up the calibration positions and averaging the two scans, and then determining from this the correct filter transmission to be applied to each point in every scan, was laboriously done by hand for the October data, but for the April results the process was streamlined using the experience already gained of the instrument’s behaviour, and a computer program written by T. R. Hicks was used for the reduction process.
Each scan was checked against comments written at the time of the scan for any anomalies which could be assigned to local interference, or obvious failure of the counting system. In spite of all precautions,occasionally spikes in the electrical supply lines, or aerial pickup from the nearby radio transmitter, caused the counters to spontaneously reset. The scans were scrutinised for such effects, and in the event of a count being lost, the chart recorder record was used to estimate a true count for the single point affected. Only a small degradation of signal accuracy was produced by this process. The scans were inspected for any obvious asymmetry in continuum levels. Where this could be traced to a probable misplacement of the filter in dividing out, a better estimate was made, and the scan recomputed. Sometimes it was concluded that asymmetries were due to other causes (pre-saturation of the signal or comp channel during a calibration scan, contamination by clouds, stars, Milky Way or twilight, abnormal finesse drifts or degenerations). Separate corrections for these were made where possible.
Daylight correction
In the case of scans recorded near dawn or dusk, a new method was adopted to compensate for daylight contamination. In morning observations, the onset of twilight (dawn) within 10 degrees of the horizon, where much of the work at low elongations was done, did not always coincide with the beginning of astronomical twilight (calculated as the time when a seventh magnitude star should be just visible in the Zenith); it varied as much as half an hour depending on the local atmospheric conditions towards the East. Similar comments apply to the end of twilight at the beginning of the night. A scan recorded at dawn is shown in Figure 3.8. Part (a) shows the signal counts recorded, and in part (b), the compensation channel record, the beginning of daylight contamination, as opposed to the slight slope cause by the rising Zodiacal Light cone, is clearly visible, and it is reasonable to suppose that whole of the shaded portion is daylight. Scans of sunlight were obtained during the day, and so this spectrum is well-known and virtually noiseless, owing to the high daytime fluxes, making it possible to reliably subtract it from the raw spectrum, to give a much improved final compensated scan.
If, at any spectral point, the fraction of daylight present is F (see Figure 3.8, overleaf), the appropriate correction to be subtracted to eliminate daylight is F x D(X)x C, where D(X) is the daylight spectrum scaled to unity continuum, and C is the assumed true continuum level in the spectrum under study. The function FxD(X)xC is shown in Figure 3.8c and the corrected spectrum in Figure 3.8d. Apart from restoring the balance of the continuum levels, the correction ‘fills in’ a broad area near zero shift position, since a depression in continuum is being ‘subtracted’ here. The small magnitude of the corrections in the important central region indicates that the method could be used to good effect even further into twilight, and at even smaller elongations. A small amount of extra noise is introduced owing to the fact that irregularities in the compensation channel may be due to variations either in ZL flux, or the daylight flux, or both. Thus the error bars towards the high wavelength side of Figure 3.8d are larger than normal.
At the stage when each individual scan had been fully reduced, a preliminary examination of them immediately revealed the existence of what appeared to be small emission component at the MgI wavelength, variable in intensity.
This emission is treated here first, as part of the reduction section, since an understanding of its relevance is necessary before proceeding to the determination of radial velocities in the dust cloud; the rest of this topic is devoted to the MgI ‘emission core’.
MgI emission
Discovery
In describing the central feature, the word ‘core’ is used because, whereas the main absorption line is roughly the width of the solar Fraunhofer line, slightly widened by the instrumental profile – about
Figure 3.8 Correction for daylight contamination around dawn. The fraction of daylight present at any point in the spectrum is p/q in (b).
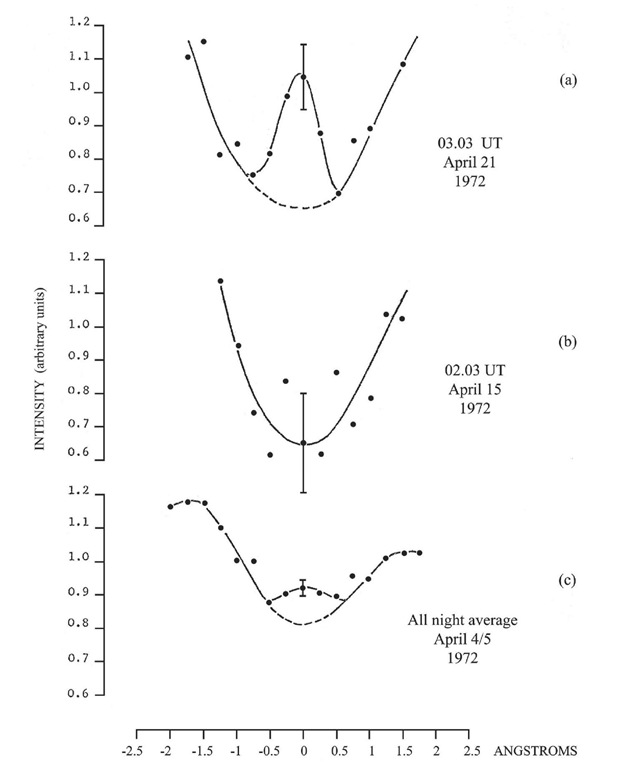
Figure 3.9 Evidence for emission in the data.
3 A in all – the emissions generally have widths of the order of the instrumental resolved width itself – about 1.5 A. They appear as a narrow peak inside a trough. An example is shown in Figure 3.9a.Figure 3.9b shows a scan in which there is apparently no emission.
In general, such individual scans were not of good enough quality to make measurements from, but for some of the data procured in adjacent parts of the sky on the same night it was possible to construct average scans which yielded good quality data (Figure 3.9c), and in some of these the core appeared to be real. The method of averaging was applied in a different way for investigating the absorption feature itself, and is described in full later (section 3.6).
It was at first thought that the core could be the result of seeing two absorption lines at a narrow separation, giving a double feature. This can easily be shown not to be a possible explanation, however. Starting with the solar Fraunhofer line and working from models of co-and contra-rotating dust in solar orbits, it is possible to produce a double feature with approximately the required spacing, but the central core turns out to be too far from the zero-shift position to fit our data, which always show the core at zero position. Furthermore, when the theoretical spectrum is convolved with an instrumental function one and a half angstroms wide, as exhibited by our instrument, the double feature completely disappears, replaced by a single absorption feature with a slightly greater width. It is therefore with some confidence that we believe the core to be due to emission in the Earth’s atmosphere.
Wavelength of the MgI emission
In the individual scans the wavelength of the emission peak could be estimated to better than 0.2 A from those scans which clearly showed a core. By combining the measurements from all such scans the emission wavelength was determined to be![]() Reference to the MIT wavelength
Reference to the MIT wavelength
tables shows that lines of Cobalt, Europium, Zirconium and Magnesium occur very near to 5183.6 A. We identify the emission as the 5183.6 A line resulting from the![tmp69-156_thumb[2] tmp69-156_thumb[2]](http://what-when-how.com/wp-content/uploads/2011/08/tmp69156_thumb2_thumb.png) transition of MgI.
transition of MgI.
Intensity of the emission
On each scan an estimate of the height of the emission peak was made by interpolating the probable uncontaminated absorption feature, and measuring the central discrepancy, in normalised scale units (see section 3.3). To convert this measure into intensity it is first necessary to ‘un-correct’ for the compensation channel division (an average value for the scan was used for this), and for the normalising constant, to get back to the original counts, corrected only for filter transmission.
To obtain the absolute value of the number of photons arriving at the bottom of the atmosphere, the intensity calibration (equations 3.2 and 3.3) was applied, and the results subsequently converted to Rayleighs. As an example, in the October results, the overall average of the average nightly counts recorded in the sample period of 48 seconds estimated to be due to emission was 17 counts.
Now since one count represents 6960 photons (equation 3.3), the number of photons received in sample period was 118,320. The area of the six-inch entrance aperture is ![tmp69-159_thumb[2] tmp69-159_thumb[2]](http://what-when-how.com/wp-content/uploads/2011/08/tmp69159_thumb2_thumb.png)
Therefore number of photons per square centimetre in 1 second is approximately
The instrument accepts a solid angle of 0.00056 steradians. Thus the number of Rayleighs is
0.32 Rayleighs is thus a typical MgI emission rate as observed. Measurements in this wavelength region give extinctions of typically 0.15 magnitudes in the zenith for the Izana site.
Figure 3.10 (overleaf) shows the average counting rates for each night for the periods of the observations.


![tmp69-160_thumb[2] tmp69-160_thumb[2]](http://what-when-how.com/wp-content/uploads/2011/08/tmp69160_thumb2_thumb.png)
![tmp69-161_thumb[2] tmp69-161_thumb[2]](http://what-when-how.com/wp-content/uploads/2011/08/tmp69161_thumb2_thumb.png)
