Inherent Delay Factors
When traffic crosses a network from source to destination, the total amount of delay inserted at each hop can be categorized in smaller factors that contribute to the overall delay value.
There are two groups of contributors to delay. The first group encompasses the QOS tools that insert delay due to their inherent operation, and the second group inserts delay as a result of the transmission of packets between routers. While the second group is not directly linked to the QOS realm, it still needs to be accounted for.
Let us now move to the second group. The transmission of a packet between two adjacent routers is always subject to two types of delay: serialization and propagation.
The serialization delay is the time it takes at the egress interface to place a packet on the link towards the next router. An interface bandwidth is measured in bits per second, so if the packet length is X bits, the question becomes, how much time does it take to serialize it? The amount of time depends on the packet length and the interface bandwidth.
The propagation delay is the time the signal takes to propagate itself in the medium that connects two routers. For example, if two routers are connected with an optical fiber, the propagation delay is the time it takes the signal to travel from one end to the other inside the optical fiber. It is a constant value for each specific medium.
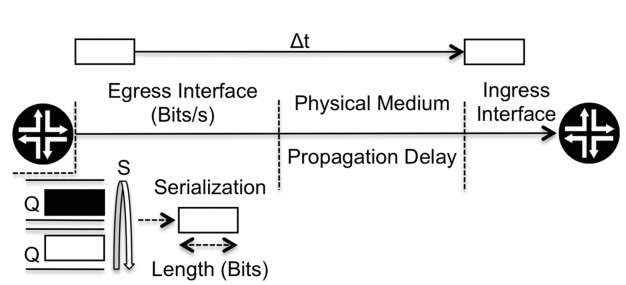
Let us give an example of how these values are combined with each other by using the scenario illustrated in Figure 3.8. In Figure 3.8 . at the egress interface, the white packet is placed in a queue, where it waits to be removed from the queue by the scheduler. This wait is the first delay value to account for. Once the packet is removed by the scheduler, and assuming that no shaping is applied, the packet is serialized onto the wire, which is the second delay value that needs to be accounted for.
Once the packet is on the wire, we must consider the propagation time, the time it takes the packet to travel from the egress interface on this router to the ingress interface on next router via the physical medium that connects both routers. This time is the third and last delay value to be accounted for.
Figure 3.8 Delay incurred at each hop
We are ignoring a possible fourth value, namely, the processing delay, because we are assuming the forwarding and routing planes of the router are independent and that the forwarding plane does not introduce any delay into the packet processing.
The key difference between these two groups of contributors to delay factors is control. Focusing on the first group, the delay inherent in the shaping tool is applied only to packets that cross the shaper, where it is possible to select which classes of service are shaped. The presence of queuing and scheduling implies the introduction of delay, but how much delay is inserted into traffic belonging to each class of service can be controlled by dimensioning the queue lengths and by the scheduler policy. Hence, the QOS deployment offers control over when and how such factors come into play. However, in the second group of delay factors, such control does not exist. Independently of the class of service that the packets belong to, the serialization and propagation delays always exist, because such delay factors are inherent in the transmission of the packets from one router to another.
Serialization delay is dependent on the interface bandwidth and the specific packet length. For example, on an interface with a bandwidth of 64 Kbits per second, the time it takes to serialize a 1500-byte packet is around 188 milliseconds, while for a gigabit interface, the time to serialize the same packet is approximately 0.012 milliseconds.
So for two consecutive packets with lengths of 64 bytes and 1500 bytes, the serialization delay is different for each. However, whether this variation can be ignored depends on the interface bandwidth. For a large bandwidth interfaces, such as a gigabit interface, the difference is of the order of microseconds. However, for a low-speed interface such as one operating at 64 Kbps, the difference is of the level of a few orders of magnitude.
Where to draw the boundary between a slow and a fast interface can be done in terms of defining when the serialization delay starts to be able to be ignored, a decision that can be made only by taking into account the maximum delay that is acceptable to introduce into the traffic transmission.
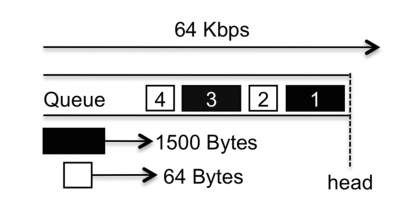
Figure 3.9 One queue with 1500 byte and 64 byte packets
However, one fact that is not apparent at first glance is that a serialization delay that cannot be ignored needs to be accounted for in the transmission of all packets, not just for the large ones.
Let us illustrate this with the scenario shown in Figure 3.9 . Here, there are two types of packets in a queue, black ones with a length of 1500 bytes and white ones with a length of 64 bytes. For ease of understanding, this scenario assumes that only one queue is being used.
Looking at Figure 3.9, when packet 1 is removed from the queue, it is transmitted by the interface in an operation that takes around 188 milliseconds, as explained above. The next packet to be removed is number 2, which has a serialization time of 8 milliseconds. However, this packet is transmitted only by the interface once it has finished serializing packet 1, which takes 188 milliseconds, so a high serialization delay impacts not only large packets but also small ones that are transmitted after the large ones.
There are two possible approaches to solve this problem. The first is to place large packets in separate queues and apply an aggressive scheduling scheme in which queues with large packets are served only when the other ones are empty. This approach has its drawbacks because it is possible that resource starvation will occur on the queues with large packets. Also, this approach can be effective only if all large packets can indeed be grouped into the same queue (or queues).
The second approach consists of breaking the large packets into smaller ones using a technique commonly named Link Fragmentation and Interleaving (LFI).
The only way to reduce a packet serialization delay is to make the packets smaller. LFI fragments the packet into smaller pieces and transmits those fragments instead of transmitting the whole packet. The router at the other end of the link is then responsible for reassembling the packet fragments.
The total serialization time for transmitting the entire packet or for transmitting all its fragments sequentially is effectively the same, so fragmenting is only half of the solution. The other half is interleaving: the fragments are transmitted interleaved between the other small packets, as illustrated in Figure 3.10.
In Figure 3.10 . black packet 1 is fragmented into 64-byte chunks, and each fragment is interleaved between the other packets in the queue. The new packet that stands in front of packet number 2 has a length of 64 bytes, so it takes 8 milliseconds to serialize, instead of the 188 milliseconds required for the single 1500-byte packet.
Figure 3.10 Link Fragmentation and Interleaving operation
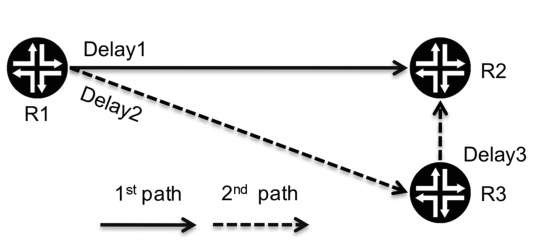
Figure 3.11 Multiple possible paths with different delay values
The drawback is that the delay in transmitting the whole black packet increases, because between each of its fragments other packets are transmitted. Also, the interleaving technique is dependent on support from the next downstream router.
Interface bandwidth values have greatly increased in the last few years, reaching a point where even 10 gigabit is starting to be common, so a 1500-byte packet takes just 1 microsecond to be serialized. However, low-speed interfaces are still found in legacy networks and in certain customers’ network access points, coming mainly from the Frame Relay realm.
The propagation delay is always a constant value that depends on the physical medium. It is typically negligible for connections made using optical fiber or UTP (Unshielded Twisted Pair) cables and usually comes into play only for connections established over satellite links.
The previous paragraphs described the inherent delay factors that can exist when transmitting packets between two routers. Let us now take broader view, looking at a source-to-destination traffic flow across a network. Obviously, the total delay for each packet depends on the amount of delay inserted at each hop. If several possible paths exist from source to destination, it is possible to choose which delay values will be accounted for.
Let us illustrate this using the network topology in Figure 3.11 where there are two possible paths between router one (R1) and two (R2), one is direct and there is a second one that crosses router three (R3). The delay value indicated at each interconnection represents the sum of propagation, serialization and queuing and scheduling delays at those points.
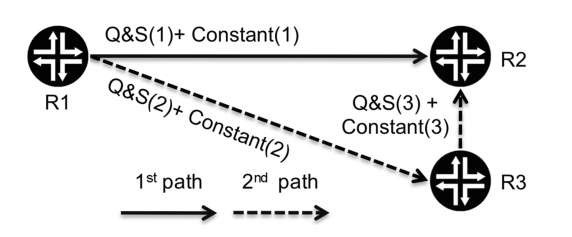
Figure 3.12 Queuing and scheduling delay as the only variable
As shown in Figure 3.11. if the path chosen is the first one, the total value of delay introduced is Delay1. But if the second is chosen, the total value of delay introduced is the sum of the values Delay2 and Delay3.
At a first glance, crossing more hops from source to destination can be seen as negative in terms of the value of delay inserted. However, this is not always the case because it can, for example, allow traffic to avoid a lower-bandwidth interface or a slow physical medium such as a satellite link. What ultimately matters is the total value of delay introduced, not the number of hops crossed, although a connection between the two values is likely to exist.
The propagation delay is constant for each specific medium. If we consider the packet length to be equal to either an average expected value or, if that is unknown, to the link maximum transmission unit (MTU), the serialization delay becomes constant for each interface speed, which allows us to simplify the network topology shown in Figure 3.11 into the one in Figure 3.12, in which the only variable is the queuing and scheduling delay (Q&S).
In an IP or an MPLS network without traffic engineering, although routing is end to end, the forwarding decision regarding how to reach the next downstream router is made independently at each hop. The operator has the flexibility to change the routing metrics associated with the interfaces to reflect the more or less expected delay that traffic faces when crossing them. However, this decision is applied to all traffic without granularity, because all traffic follows the best routing path, except when there are equal-cost paths from the source to the destination.
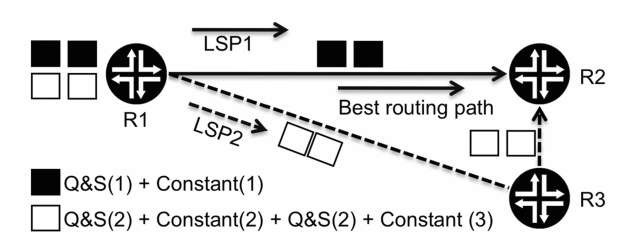
In an MPLS network with traffic engineering ( MPLS – TE ), traffic can follow several predefined paths from the source to the destination, including different ones from the path selected by the routing protocol. This flexibility allows more granularity to decide which traffic crosses which hops or, put another way, which traffic is subject to which delay factors. Let us consider the example in Figure 3.13 of two established MPLS-TE LSPs, where LSP number 1 follows the best path as selected by the routing protocol and LSP number 2 takes a different path across the network.
The relevance of this MPLS-TE characteristic in terms of QOS is that it allows traffic to be split into different LSPs that cross different hops from the source to the destination. So, as illustrated in Figure 3.13, black packets are mapped into LSP1 and are subject to the delay value of Q&S(1) plus Constant (1), and white packets mapped into LSP2 are subject to a different end-to-end delay value.
Figure 3.13 Using MPLS-TE to control which traffic is subject to which delay
Congestion Points
As previously discussed in topic,the problem created by the network convergence phenomena is that because different types of traffic with different requirements coexist in the same network infrastructure, allowing them to compete freely does not work. The first solution was to make the road wider, that is, to have so many resources available that there would never be any resource shortage. Exaggerating the road metaphor and considering a street with ten houses and ten different lanes, even if everybody leaves for work at the same time, there should never be a traffic jam. However, this approach was abandoned because it goes against the main business driver for networks convergence, i.e., cost reduction.
Congestion points in the network exist when there is a resource shortage, and the importance of QOS within a network increases as the available network resources shrink.
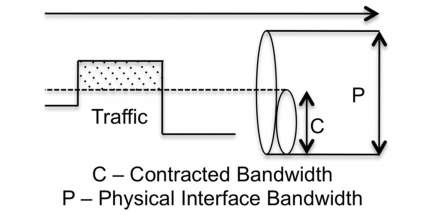
An important point to be made yet again is that QOS does not make the road wider. For example, a gigabit interface with or without QOS has always the same bandwidth, one gigabit. A congestion point is created when the total amount of traffic targeted for a destination exceeds the available bandwidth to that destination, for example, when the total amount of traffic exceeds the physical interface bandwidth, as illustrated in Figure 3.14 .
Also, a congestion scenario can be artificially created, for example, when the bandwidth contracted by the customer is lower than the physical interface bandwidth, as illustrated in Figure 3.15.
At a network congestion point, two QOS features are useful, delay and prioritization. Delay can be viewed as an alternative to dropping traffic, holding the traffic back until there are resources to transmit it.Delay combined with prioritization is the role played by the combination of queuing and scheduling. That is, the aim is to store the traffic, to be able to select which type of traffic is more important, and to transmit that type first or more often. The side effect is that other traffic types have to wait to be transmitted until it is their turn.
Figure 3.14 Congestion point because the traffic rate is higher than the physical interface bandwidth
Figure 3.15 Congestion point artificially created
Figure 3.16 Congestion point in a hub-and-spoke topology
But let us use a practical scenario for a congestion points, the hub-and-spoke topology. Figure 3.16 shows two spoke sites, named S1 and S2, which communicate with each other via the hub site. The interfaces’ bandwidth values between the network and the sites S1, S2, and the hub are called BW-S1, BW-S2, and BW-H, respectively.
Dimensioning of the BW-H value can be done in two different ways. The first approach is the "maximum resources" one: just make BW- H equal to the sum of BW- S1 and BW-S2. With this approach, even if the two spoke sites are transmitting at full rate to the hub, there is no shortage of bandwidth resources.
The second approach is to use a smaller value for BW-H, following the logic that situations when both spoke sites are transmitting at full rate to the hub will be transient. However, when those transient situations do happen, congestion will occur, so QOS tools will need to be set in motion to avoid packets being dropped. The business driver here is once again cost: requiring a lower bandwidth value is bound to have an impact in terms of cost reduction.
In the previous paragraph, we used the term "transient," and this is an important point to bear in mind. The amount of traffic that can be stored inside any QOS tool is always limited, so a permanent congestion scenario unavoidably leads to the exhaustion of the QOS tool’s ability to store traffic, and packets will be dropped.
The previous example focuses on a congestion point on a customer-facing interface. Let us now turn to inside of the network itself. The existence of a congestion point inside the network is usually due to a failure scenario, because when a network core is in a steady state, it should not have any bandwidth shortage. This is not to say, however, that QOS tools are not applicable, because different types of traffic still require different treatment. For example, queuing and scheduling are likely to be present.
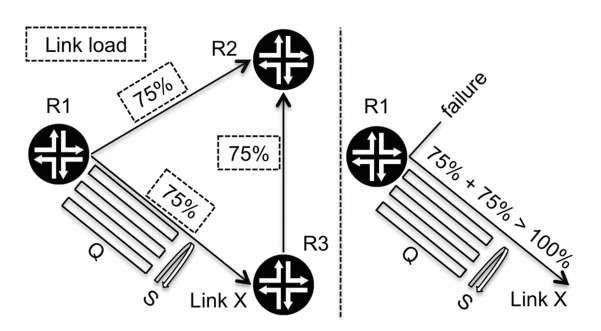
Let us use the example illustrated in Figure 3.17, in which, in the steady state, all links have a load of 75% of their maximum capability. However, a link failure between routers R1 and R2 creates a congestion point in the link named X, and that link has queuing and scheduling enabled. A congestion point is created on the egress interface on R1.
Traffic prioritization still works, and queues in which traffic is considered to be more important are still favored by the scheduler. However, the queuing part of the equation is not that simple. The amount of traffic that can be stored inside a particular queue is a function of its length, so the pertinent question is, should queues be dimensioned for the steady- state scenario or should they also take into account possible failure scenarios? Because we still have not yet presented all the pieces of the puzzle regarding queuing and scheduling.
As a result of the situation illustrated in Figure 3.17, most operators these days use the rule, "if link usage reaches 50%, then upgrade." This rule follows the logic that if a link fails, the "other" link has enough bandwidth to carry all the traffic, which is a solution to the problem illustrated in Figure 3.17.
Figure 3.17 Congestion point due to a failure scenario
However, considering a network not with three but with hundreds of routers, implementing such logic becomes challenging. Here the discussion moves somewhat away from the QOS realm and enters the MPLS world of being able to have predictable primary and secondary paths between source and destination.
