ABSTRACT
Fracture mechanics is considered from the viewpoint of a field theoretical approach based on the physical principle known as gauge invariance. The advantage of this approach is scale independent and universal. All stages of deformation, from the elastic stage to fracturing stage can be treated on the same theoretical foundation. A quantity identified as the deformation charge is found to play a significant role in transition from plastic deformation to fracture. Theoretical details along with supporting experimental results are discussed.
Introduction
Fracture is initiated at the atomistic scale and develops to the final, macroscopic failure of the object. By nature, it is an inter-scale phenomenon. However, most theories available to date are scale dependent; Quantum mechanics, dislocation theories, continuum mechanics and fracture mechanics all work well at each individual scale level but they do not describe the development in the scale level. For full understanding of fracture, it is important to argue the dynamics independent of the scale level. In this respect, a field theoretical approach proposed by Panin et al [1] as part of the general theory of deformation and fracture called physical mesomechanics [2] has great advantage. Based on a fundamental physical principle known as local (gauge) symmetry [3] (Aitchson, 1989), this approach is capable of describing deformation dynamics (i.e., the form of the force) without relying on empirical concepts or phenomenology such as experimentally determined constitutive relations; thus, by nature, the formalism is scale-independent and universal.
According to this approach, on entering the plastic regime materials loses longitudinal elasticity but gains transverse elasticity. At the same time, the longitudinal effect becomes energy dissipative [4, 5]. Consequently, the displacement field in the plastic regime is characterized as a decaying transverse wave phenomenon. Previously, we applied this formalism to various aspect of deformation and fracture of solid-state materials, and verified the theory with experiments based on optical interferometry. Transverse decaying wave of displacement field has been experimentally observed and it has been confirmed that fracture indeed occurs when the transverse wave decays completely [6]. In this dynamics, a quantity defined as the deformation charge [7], which is closely related to the charge of symmetry associated with the gauge symmetry [3] plays an important role. In particular, it seems that materials fracture when the deformation charge stops flowing. In this paper, we elaborate on the dynamics associated with the deformation charge. In addition, an attempt is made to explain recent experiment [8] on a notched specimen based on this formalism. Quite interestingly, the experiment clearly shows the deformation charge, and its behavior toward fracture in complete consistence with the theory.
Theory
Field equations
The basic postulate of the mesomechanical-approach is that when a material enters the plastic regime under the influence of external load, the deformation is still locally linear-elastic. The formalism resulting from this postulate is described in detail elsewhere1. In short, by applying the physical principle known as gauge invariance [3, 5] to the displacement field of materials under plastic deformation, the following field equations are obtained [4].
Here v and o are the translational and rotational displacement related to each other as indicated by eq. (3). j0 and j0 appearing on the right-hand side of eqs. (1) and (2) are the temporal and spatial components of the so-called charge of symmetry. c is the phase velocity of the spatiotemporal variation of the field1.
Eqs. (1) and (2) yield a wave equation of the following form.
In the plastic regime, eq. (4) represents a decaying transverse wave, and the phase velocity can be expressed in terms of the density and shear modulus as follows.
With eq. (5) substituted and rearrangement of the terms, eq. (2) can be put in the following form [4].
The left-hand side of eq. (6) is the product of the mass and acceleration of a unit volume. The right-hand side represents the external force acting on the unit volume where the first term is transverse force and the second term is longitudinal force. In the plastic regime, the transverse force is a restoring force associated with the rotational displacement of the local region and the shear modulus 1 / n, and the second term is the longitudinal, energy dissipating force [4]. Here the first term is responsible for the transverse wave characteristics of displacement in the plastic regime [6]. It has been shown that eq. (6) is valid for the linear elastic regime [9]; in that case, the first term on the right-hand side becomes null and the second term represents longitudinal elastic force. In addition, the phase velocity (5) becomes the well-known expression of the square root of the ratio of the Young’s modulus to the density.
Significance of charge in fracture
The symmetry charge plays a significant role in fracture mechanics. From the law of mass conservation applied to a unit volume, the temporal change in the density is equal to the divergence of velocity field.
With the use of eq. (5), eq. (2) can be written as follows.
Application of divergence to eq. (2) with the use of eq. (5) and the mathematical identity V’(Vx o) = 0 leads to the so-called equation of continuity.
Eq. (9) indicates that is the flow of , allowing us to put it in the following form.
With eq. (7), eq. (10) can further be rewritten as
Here the temporal change in density de / dt can be interpreted as the generation of dislocation [10]. Being associated with the net flow into the unit volume (V • v) , this change in density is in the same direction as the local velocity, or Wd o v. Thus, the corresponding flow can be put in the following form.
Being proportional to velocity, the longitudinal force is by nature energy dissipating.
Transition to fracture
The above argument indicates the following scenario of transition from elastic deformation to fracture of initially linearly elastic materials [7,11]. When a material enters the plastic regime, it loses the longitudinal elastic force, and instead, gains the transverse restoring force represented by on the right-hand side of eq. (6). At the same time, the longitudinal force becomes energy dissipative as represented by eq. (12). Based on this observation, the transition from the elastic regime to the plastic can be characterized by (V x o) ^ 0 and j /n proportional to the local velocity. Note that this is a local effect; even if the stress-strain curve is before the yield point (i.e., in the linear regime) and therefore the specimen is considered to be globally elastic, it is possible that the deformation is locally plastic. There are a number of experimental observations that support this interpretation [12].
While the mechanism of energy dissipation via j /n = av is effective, the work done by the external force causing the deformation, such as the work done by a tensile machine, is partially dissipated in this fashion and partially stored as the rotational elastic energy associated with the restoring force . As the deformation develops, the material tends to lose these mechanisms. Some theoretical consideration [11] and experimental observations [6] indicate that it is likely that materials loses the restoring mechanism first, causing the transverse wave to decay, and then enters the final phase where the dissipative force becomes null as well. Thus the transition from late plastic deformation to fracture can be characterized as the initial phase
and, the final phase
Experimental
A number of experiments [4-9, 12] have been conducted to test the theory discussed above. In particular, observation of in-plane displacement with the use of an optical interferometric technique known as the Electronic Speckle-Pattern Interferometry (ESPI) provides significant information. In this section, recent results of ESPI applied to tensile analysis of a notched specimen are presented.
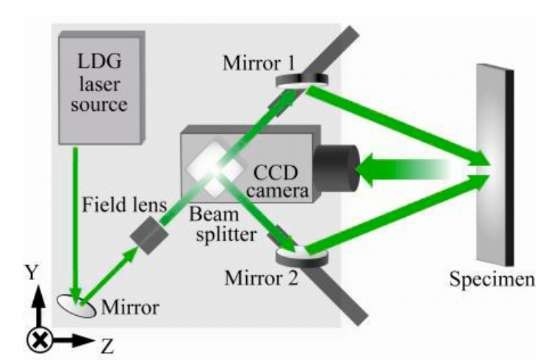
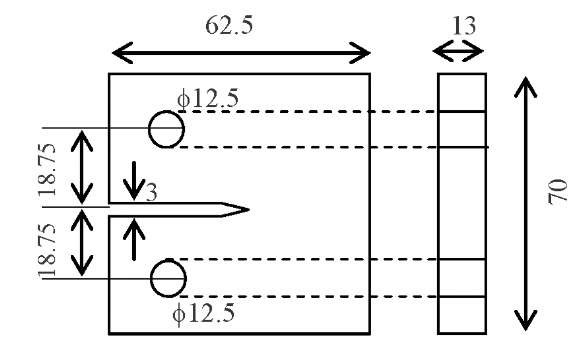
Figs.1and 2 illustrate the ESPI setup and the dimension of the carbon steel specimen used in the experiment [8]. The ESPI was a dual-beam type setup using a laser source of 532 nm in wavelength and was sensitive to vertical in-plane displacement of the specimen. The interferometric image was recorded with a CCD (Charge-Coupled Device) camera continuously during the tensile experiment at a rate of 100 frame/s. The specimen was loaded vertically at the through holes shown in Fig. 2 until it fractured. Initial crack of about 1.3 mm was used at the tip of the notch prior to the tensile loading.
Fig. 1 ESPI optical setup
Fig. 2 Carbon steel specimen with a notch
After completion of image recording, interferometric fringe patterns were formed off-line by subtracting the frame taken at a certain time step from the frame taken at another time step. The frame difference for the subtraction, which corresponds to the total deformation that the resultant fringe patter represents, was adjusted so that the total number of the fringes was appropriate for the analysis. Typically, the frame difference of 30 – 40, corresponding to 0.3 – 0.4 s was used.
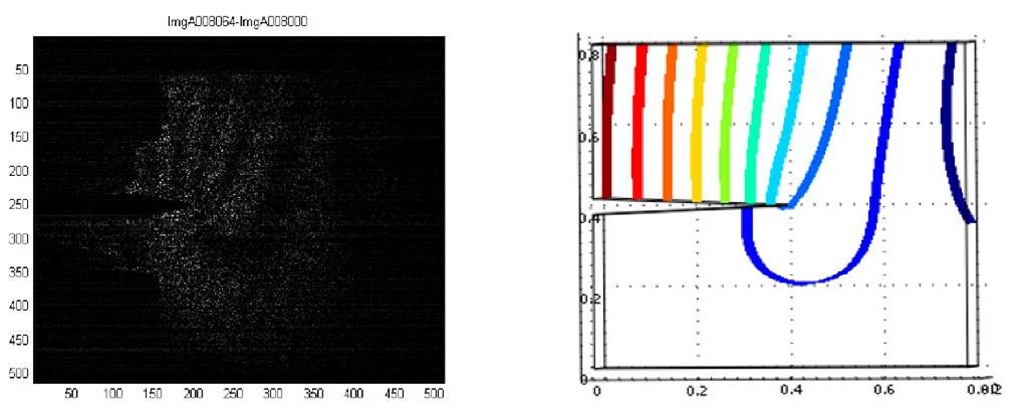
Fig. 3 ESPI fringes representing vertical displacement and corresponding finite element analysis
Fig. 3 is a fringe pattern observed at an early stage of deformation (frame number 8064 minus 8000). At this stage fringes are all continuous although its density is higher near the tip of the notch indicating that the deformation is somewhat concentrated there. The figure shown next to this fringe pattern is the contour of vertical displacement computed with a simple finite element model. The features that the fringes are almost vertical, springing out from the notch tip and that one fringe originating from the notch tip circles around the tip are clearly seen in the computed contours as well.
Fig. 4 shows a series of fringes formed 771 frames (or 7.71 s as the frame rate is 100 frame/s) after Fig. 3. The four fringe patterns are created by subtracting the common image (frame number 8835) from images taken after this with an increment of 25 frames (i.e., frame number 8860, 8885, 8910 and 8935 going from the left to right). The frame difference of 25 corresponds to 250 ms, during which the tensile machine’s crosshead moves 2 0 |rm/ s x 2 5 0 ms = 5 |rm. While the number of fringes increases during this time but the basic pattern remains the same. Note that at this stage, the fringe patter is vertically symmetric, unlike Fig. 3. Since the difference between Fig. 3 and 4 in time is 7.71 s and the corresponding crosshead’s displacement is 2 0 |rm/ s x 7. 7 1 s = 1 5 4 |rm over the specimen’s size of 70 mm, the difference in strain is At this stage, the fringes are still continuous.
Fig. 4 Fringes obtained by subtracting a common frame from various frames to observe increase in displacement
When the deformation further develops, the fringes start to show discontinuity. Fig. 5 shows fringe patters formed by subtracting images different by 40 frame numbers (0.4 s). The leftmost pattern is formed by subtracting frame 9600 from 9640, i.e., 765 frames or 7.75 s after the leftmost fringe pattern of Fig. 4. The total strain at this point is approximately . Notice that the discontinuous fringes are divided by circular bright pattern, and the size of the circular pattern increases with time.
Fig. 5 Discontinuous fringe patterns observed at several time steps
This bright circle divides regions of different fringe patterns. From this viewpoint, this bright circular pattern is considered to be equivalent to the bright band pattern (linear bright pattern) shown in Fig. 6, which was observed in our previous tensile experiments [13, 14] on not-notched specimen. Notice that the regions separated by the bright band patterns show completely different fringe patters. Our investigation strongly indicates that this linear bright pattern corresponds to the Luder’s front, or dislocation line [13]. Thus, it is naturally considered that it represents the flow of deformation charge j/j [eq. (12)].
Fig. 6 Bright linear band pattern observed in tensile experiments on a non-notched specimen
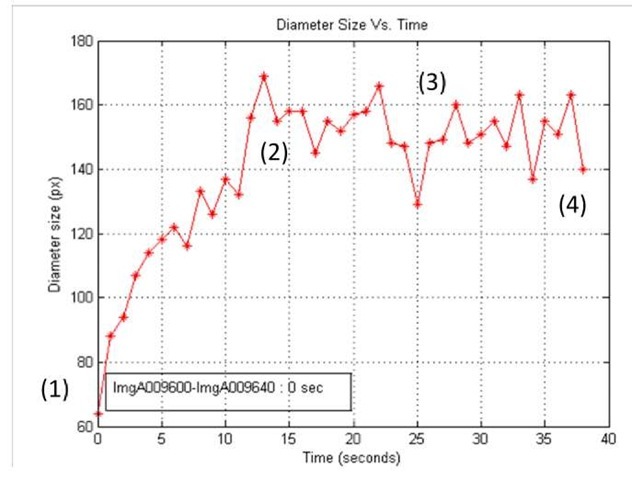
The series of images on the left in Fig. 6 show the appearance of the bright linear pattern as the deformation develops. The numbers under the images are the frame numbers. The rightmost image is from another experiment in which the specimen has a through hole and, a symmetric, X -shaped bright pattern appears around the hole. Previous studies on the linear bright patterns show that when the patterns stop drifting, the specimen fractures. This is in perfect consistence with the above argument of the final phase of transition from deformation to fracture [eq. (14)]. Another interesting aspect of the linear bright pattern in conjunction with the final fracture is that when the linear pattern is in a symmetric X-shape, the specimen fractures horizontally. However, when the linear bright patter appears in only one diagonal direction (i.e., "/" or shaped as opposed to "X" shaped), the fracture is along the bright-line. Commonly to both cases, fracture occurs after the band becomes stationary. The question is now whether a similar argument can be made for the circular bright pattern observed in Fig. 6. Fig. 7 plots the change in the size of the circular bright pattern as a function of time, where time 0 corresponds to the moment when the bright circular pattern appears for the first time. The numbers (1) – (4) inserted in this figure indicate when images (1) – (4) in Fig. 5 are observed. It is interesting to note that the increase in the size of the circular pattern is saturated around 12 s. Viewing this size increase as the circular pattern being drifting in the radial direction, the saturation of increase in its size can be interpreted as the circular pattern ceases drifting, corresponding to the linear bright pattern becoming stationary. In fact, the above FEM modeling indicates that the displacement of the material in region of the circular pattern is approximately radial. Thus the saturation point in Fig. 7 (around 12 s) can be viewed as the beginning of final phase of the transition from plastic deformation to fracture. In addition, the fracture occurs horizontally penetrating the circular bright pattern symmetrically, as is the case of the X-shaped linear bright bands.
Fig. 7 Variation of the size of circular bright pattern
Summary
Fracture has been viewed based on the field theory of deformation and fracture. It has been found that the deformation charge plays a significant role in transition from the final stage of plastic deformation to fracture. Experimentally, a bright pattern observed in fringe patterns formed by electronic speckle pattern interferometery has been found to visualize the deformation charge, and thereby useful to study fracture process.


