ABSTRACT
The ratio of aluminium alloys used in the automotive industry tends to increase as a consequence of the enforcement of tougher environmental regulation (minimization of vehicles weight). For example, thanks to their good thermal, corrosion and mechanical properties, aluminium alloys have steadily replaced copper alloys and brass for manufacturing heat exchangers in cars or trucks. Such components have been constantly optimized in terms of exchange surface area and, nowadays, this has led to Al components in heat exchangers with a typical thickness of the order of 0.2 to 1.5 mm. With such small thicknesses, the load levels experienced by heat exchangers components has drastically increased leading to an important research effort in order to improve the resistance to damage development during service life.
This paper focuses on the resistance to fatigue damage of thin sheets of brazed co-rolled aluminium alloys used for manufacturing heat exchangers and particularly on the mechanisms of fatigue cracks initiation. Digital Image Correlation (DIC) has been used to monitor damage development during constant amplitude fatigue tests of thin (0.27 mm) samples. Fatigue cracks have been found to initiate from deformation bands which presence can be correlated with solidification drops at the sample’s surface resulting from the brazing process. X-ray tomography has been used to obtain the spatial distribution of drops as well as their characteristics (height, surface…), on the sample gauge length. Those 3D data have been used to produce finite element meshes of the samples in order to assess the influence of the drops on fatigue crack initiation.
Introduction
The small thicknesses of the thermal heat exchangers components improve the thermal performance through the increase of exchange surface area, but it leads to an increase of the in use loads which can be detrimental to the service life duration via for example fatigue damage development. Fatigue damage of brazed thin sheet aluminium alloys for thermal heat exchangers has rarely been considered in the literature [1 - 4] and none of these works have dealt with thicknesses below 1.5mm.
The main technical issue for the investigation of damage development in fatigue sample with a sub millimeter thickness is that their surfaces cannot be polished. Thus classical optical/electronic microscopy observations of fatigue damage initiation and development cannot be carried out. It has been suggested to use Transmission Electron Microscopy (TEM) to correlate dislocation structures resulting from mechanical cyclic loading of 3000 series alloy on cylindrical gauge section samples with a diameter of 10mm [4]. TEM preparation is however a time consuming and destructive technique. In this study we present a different approach based on DIC [5-6] and 3D tomographic observations. Those techniques are used to identify fatigue crack initiation sites and perform Finite Element (FE) calculations [7-8-9], which help to elucidate the fatigue mechanisms of the studied material.
Experimental procedure
An industrial material made of 3 co-rolled aluminium alloys (total thickness 0.27 mm) has been studied. In spite of its small thickness, the material exhibits a composite structure comprising a core material (3xxx alloy) and 2 clads (4xx and 7xxx alloys). The lower melting point 4xxx alloy is used for producing the heat exchanger assembly during a brazing process while the 7xxx alloy improves internal corrosion resistance. Industrial brazing conditions have been used to produce flat dog bones samples exhibiting representative microstructures through the thickness and also at their surface.
Figure 1: Material configuration and compositions of the different aluminium alloys used 2.1 Fatigue tests and digital image correlation
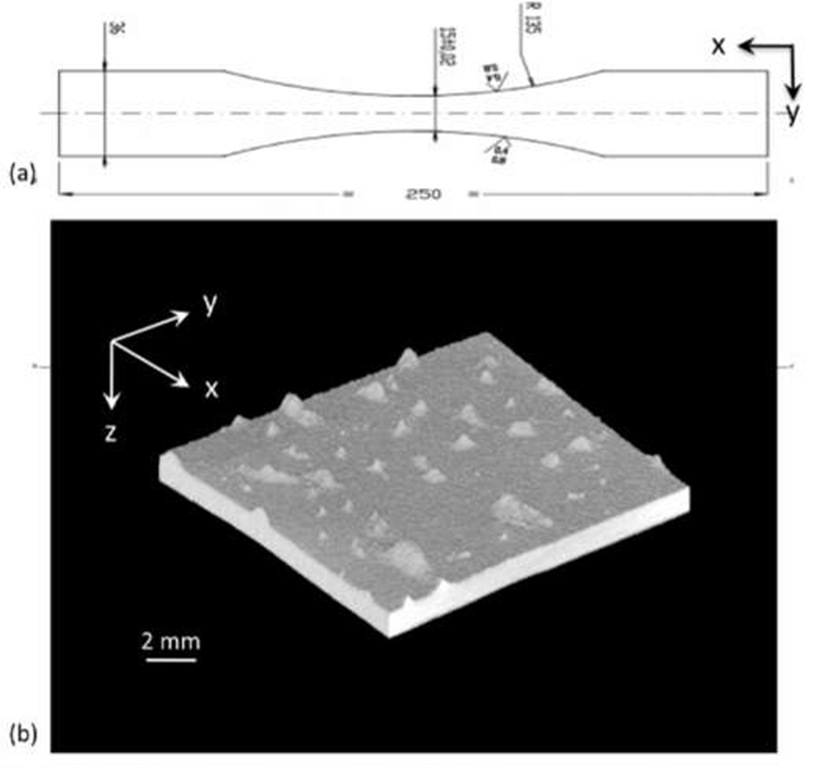
The fatigue test samples investigated had a minimal rectangular section of 4.05 mm2 (15*0.27 mm2) according to the layout of figure 2(a). Fatigue tests were carried out in a hydraulic tension-tension fatigue test machine under constant stress-amplitude conditions (omax = 100 MPa, stress ratio = 0.1 and F = 10 Hz) at room temperature. Damage development at the sample surfaces has been monitored during cycling by DIC. A large angle telecentric lens with focal distance of 200 mm associated to a CCD camera with a 1200*1600 pixels resolution (12*16 mm2) has been used. Pictures of sample’s surface prepared beforehand by applying a speckle are recorded every 150 cycles in constant lighting conditions (exposure time = 15ms). A Matlab® post-treatment [5] of the pictures allows the measurement of the displacement field on the sample surface between two cycling steps and the determination of the equivalent strain and stress fields.
Figure 2: (a): sample geometry, (b): 3D-rendering of the sample surface showing clad solidification drops
Tomography
X-ray tomography is a 3D imaging technique based on the difference of absorption of the various constituents of the material that allows visualizing the inner structure of an object [9]. This technique has been used here to characterize the surface roughness of fatigue sample (Figure 2(b)) and to investigate the probable influence of the local microstructure on crack initiation. The principle of the technique and the experimental setups used here are described elsewhere [7]. Two different voxel size/imaging modes have been used: 13^m/voxel (Lab. X-ray source: absorption mode) and 0.7^m/voxel (Synchrotron X ray source: absorption + phase contrast).
Finite element meshing and tensile test simulation parameters
A surface and volume meshing with quadratic tetrahedrons is created from the reconstructed 3D images of the fatigue samples with Amira® software (Figure 3). The mesh corresponding to the sample studied here contains 200 000 quadratic tetrahedrons. A Java plugin [7-8-9] allows to import the mesh into Abaqus®. The boundary conditions have been chosen to prevent displacements of sample edges except in load direction. Simulation consists in a maximal stress approach in elastic conditions (E = 70 000 MPa, v = 0.33) by applying a vertical displacement of 0.1mm, which correspond to a deformation of 0.2% as a 1st approach. The multimaterial aspect of the sample has not been taken into account for the FE calculations.
Figure 3: 3D view of the volume meshing with quadratic tetrahedrons of the fatigue sample
Results and analysis
The fatigue lives (Wohler curves) and the damage mechanisms (crack initiation sites and propagation) have been characterized.
Fatigue mechanisms of brazed material
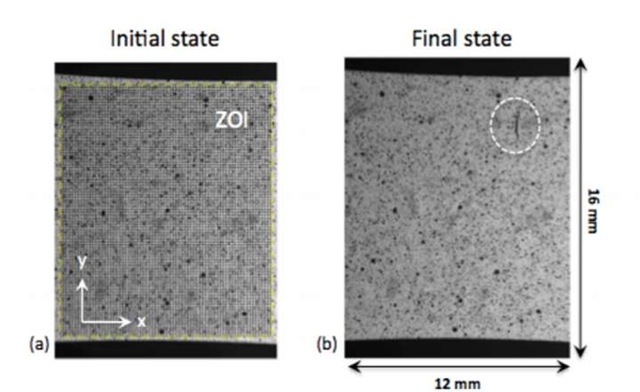
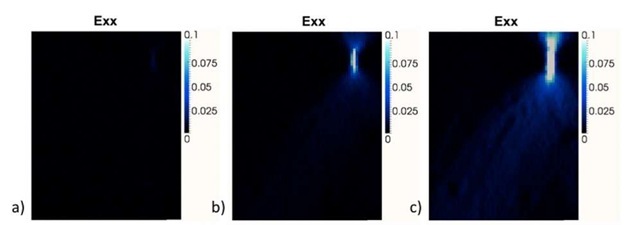
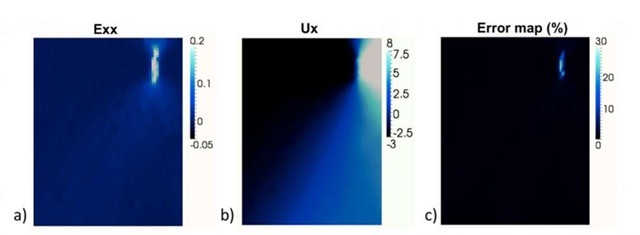
The sample analysed by X-ray tomography and shown in section 2.1 (Figure 2(b)) has been submitted to 933744 fatigue cycles. The test was stopped before fracture when the sample contained a 1mm long fatigue crack. Figures 4(a) and 4(b) present the zone of interest (ZOI) used for DIC at reference (750 cycles) and final states. The strain (Exx) fields for 5 specific steps, respectively 47%, 75%, 97% and 100% of the fatigue lifetime, are presented on figures 5(a-c). Large localized plastic deformation leading to large displacements (figure 5(c)) appears during the last part of the cycling, which probably corresponds to the stable crack propagation. Before the few last cycles (97% of the fatigue life, i.e. 28 000 cycles), no strain heterogeneity can be visualized by DIC. The presence of a crack can be evidence by using a discrepancy map (Figure 6(c)) as described in [10].
Figure 4: Zone Of Interest (ZOI) for the digital image correlation (DIC) at: (a) the initial state (750 cycles) and (b): the final state (933744 cycles). The painting black points (speckles) are used to calculate displacement field by DIC. On fatigue crack can be easily visualized on the final state image (b).
The shadow clearly visible near the crack on figure 4(b) highlights the presence of a Clad Solidification Drop (CSD). Systematic fractographic analysis of the fatigue samples confirms the presence of a CSD close to the crack initiation zone in most cases. The stress concentration induced by the CSD roughness of the sample surface is likely to promote local plasticity and induce eventually crack initiation. The influence of CSD on local (elastic) stress distribution during cycling can be studied in detail from the 3D FE meshes generated from tomography; this is described in the next section.
Figure 5: Strain field Exx (a- c) obtained by DIC at 3 different steps of the fatigue test, respectively 75, 98 and 100% of the lifetime. (Scales – Exx: *100%)
Figure 6: Exx (a), Ux (b) and discrepancy map (c) obtained by DIC at 100% of the lifetime (Scales – Ux: *10^m and Exx: *100%)
Study of clad solidification drops geometric influence by a maximal stress approach
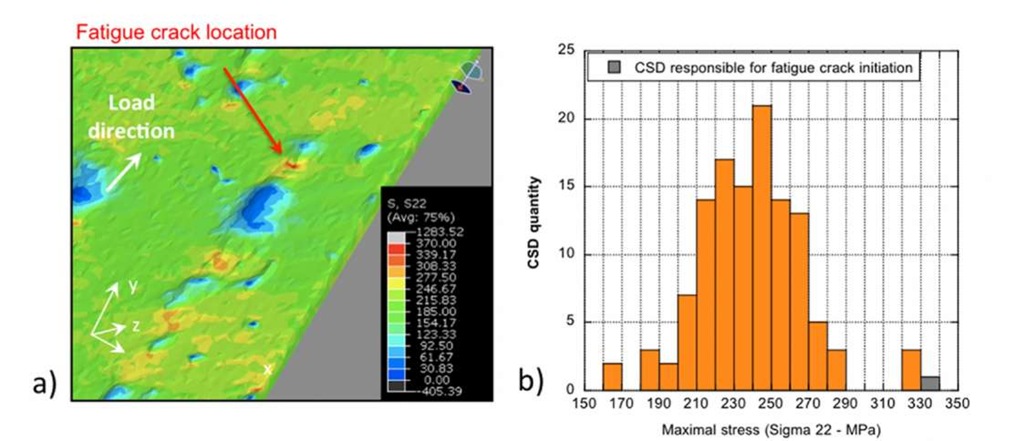
Figure 7 shows the Von Mises stress distribution on the fatigue sample described in the two previous sections. A stress concentration zone can clearly be seen near the different CSDs among which is one responsible for crack initiation. Note that for the model considered here (homogeneous material) the stress concentration zones appear to be localized on the surface.
Moreover, the influence CSD’s geometry has been quantified through the important stress concentration induced (figure 5(b)). On figure 7(b) is presented the distribution of the maximum values of stress along the loading direction (o22) is also shown. It can be seen that the CSD responsible for crack initiation is the one, which induce the maximum value of o22. This situation has been constituently found for 4 of the 5 samples studied so far.
Figure 7: FE calculation of local stress levels in the fatigue samples based on microstructurally realistic 3D FE mesh generated from tomographic data. (a): Zoom showing the distribution of o22 stresses in a zone close to the initiation site of the crack, which lead to failure after 934000 cycles with a maximal fatigue stress of 100 MPa. (b): Distribution of o22 values induced by the different CSD present in the sample gage length; the value corresponding to the initiating CSD is highlighted.
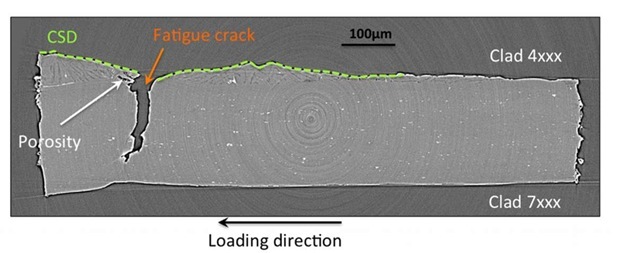
In the cases where crack initiation could not be correlated with a local maximum value of the o 22 stress, inclusions or porosity resulting from the brazing process have been detected at the initiation site by SEM inspection and/or tomographic inspection of the fracture surface (high resolution X-ray tomography – ESRF) as illustrated in figure 8.
Figure 8: Microstructure visualisation around one fatigue crack by high-resolution X-ray tomography – A CSD (Clad Solidification Drop) is observed around fatigue crack as well as some porosity (white arrow).
Conclusions
From these results it can be inferred that in this brazed material, fatigue crack initiation is the result of an interaction between high values of local tensile stresses (resulting from the surface roughness), which induce intense plastic activity as evidenced by DIC measurements, and a local microstructure which further enhance the geometrical stress concentration effect.
The tomographic data allows to analyze the scatter in fatigue lives at a given stress level on the basis of the CSD distribution in different samples. Preliminary results confirm that longer (resp. shorter) fatigue lives can be correlated with smaller (resp. larger) CSD/stress levels.
The results obtained give clear indication that new alloys and/or brazing fluxes enabling to reduce the presence of CSD are expected to enhance greatly the fatigue resistance of brazed assemblies in heat exchangers. Preliminary results obtained with different brazing conditions confirm this trend.

