Asynchronous testing
Many times in a Flash-based application, the operations you want to test are not synchronous. You might start a download, and at some later time either the response will be returned or a failure is reported. This type of testing is difficult to fit into the assert methods previously mentioned. Luckily, both AsUnit and FlexUnit have another trick up their sleeves, the addAsync method.
The addAsync method creates a delegate to an event handler with a timeout value. If the timeout happens before the handler is called, the unit test fails. If the event is broadcast within the timeout, the unit testing framework cancels the timeout and runs the intended event handler. Although that might sound confusing, here’s an example to illustrate how it works.
The following example is written for ActionScript 3 using FlexUnit. However, the syntax/usage is nearly identical to the ActionScript 3 version of AsUnit, and it is similar to the ActionScript 2 varieties of AsUnit.
Imagine a class that you might use in the Recipe Viewer application that downloads an XML file, parses it, and then dispatches an event signifying that it’s done. That class might resemble this:
Obviously, a real-world example would likely do some more processing once the XML was loaded. It would probably even dispatch some kind of failed event if something went wrong. But this simple example is good enough to show off the addAsync method.
A test case for the sample class follows:
Notice that you added an event listener to the XmlDownloader object but use the addAsync method instead of just specifying the event handler. This created a delegate to the onLoaded method with a timeout of two seconds (2000 milliseconds). At the two-second mark, if the xmlLoaded event hasn’t been broadcast, the unit test immediately fails. But, if the xmlLoaded event is broadcast before the two-second limit, it gets passed to an internal FlexUnit method that was created by the addAsync call. This method cancels the timer and then runs the real event listener (onLoaded in this example). The real event listener can then perform any tests it needs to on the result returned to it.
If you’re using FlexUnit, you can pass additional parameters to the event handler by specifying them in the addAsync call. For example, you could modify the previous test as such:
Then, the event handler would be expecting two parameters, and the beginning of it could be rewritten as follows:
You could pass parameters for any other reason as well. For instance, you might have a single event handler for a large number of tests, and you could specify the “correct” result through that second parameter.
Further reading
In the previous sections of this topic, you learned how to set up, organize, and execute some simple unit tests using two open source frameworks. Both of those frameworks have additional documentation included in their downloads that you can use to learn more about specific features of either framework.
You can read about news and best practices about AsUnit and unit testing in general from Luke Bayes’ blog at http://www.asserttrue.com/.
You can keep up-to-date on FlexUnit at the project’s Google Code site at http://code.google.com/ p/as3flexunitlib/.
Using Xray as a debug tool
In the rest of this topic, you will learn how to use some of its features to aid you in testing and debugging an application. The information in this section is equally applicable to ActionScript 3 and ActionScript 2 development because the user interface for both is the same and the programming API is very similar.
Using Xray to log effectively
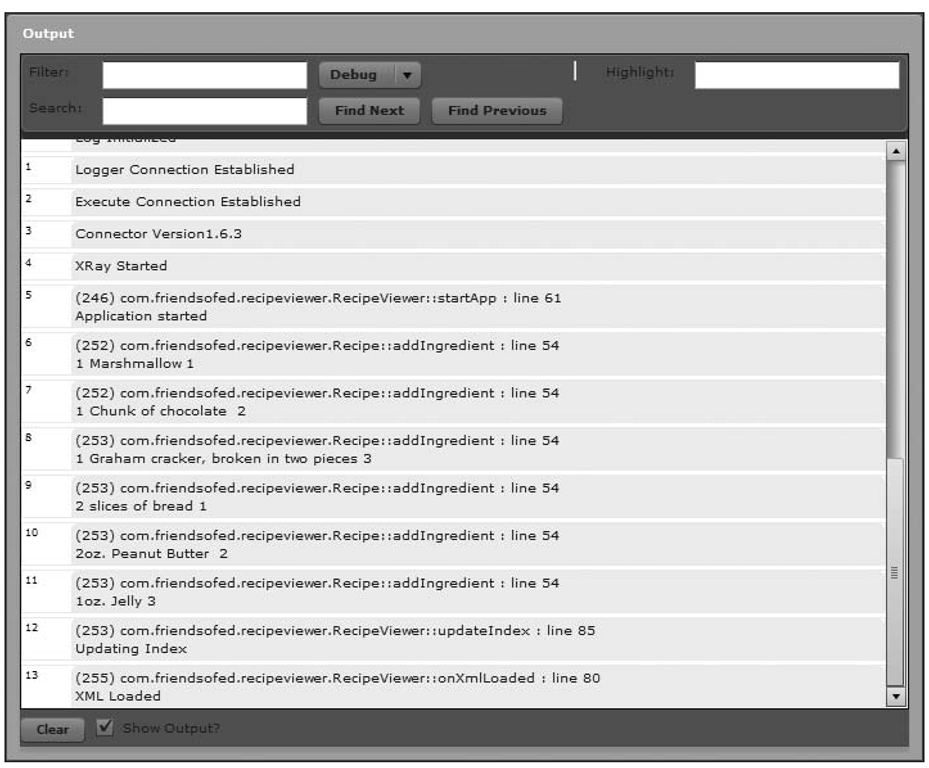
By default, when you launch the Xray interface, the Output panel as shown in Figure 5-8 opens on the right side. This is where the logging information from your application will appear.
Like many other logging frameworks, Xray has the concept of logging levels. When you’re viewing the output in Xray, you can select a level to view. When you do this, you see any messages that happen at that level as well as any messages at higher priorities. The levels and what they traditionally have meant, in order of priority (from lowest to highest), are as follows:
■ Debug: Debug is generally used for messages that only the developer working on the application might care about. An example is a developer wanting to see the value of a variable at a certain point in time.
■ Info: Info is used for messages that are generated during the normal usage of the application. An example is to note the successful completion of a downloaded file.
■ Warn: Warn is used for messages that indicate some recoverable error has occurred. An example is to note that a file has failed to download, but the application is going to automatically retry.
■ Error: Error is used for messages that indicate a significant error has occurred that was not recoverable but doesn’t immediately end execution. An example is when a file has failed to download and no further attempts will be made, but that file wasn’t strictly needed to continue (maybe just a broken image link will appear).
■ Fatal: These are errors that prevent the application from proceeding any further. A good example is the failure of a file download that was critical to the successful completion of the application.
Figure 5-8. The Xray output panel showing some logging information
You can switch what level to view logging at in the Xray interface by changing the Filter combo box. When you choose a level, you will see any log messages generated at that level or higher. So, for example, if you chose to view logging at the Warn level, you will see the logging messages generated at the levels of Warn, Error, and Fatal. Selecting the Debug level allows you to see all log messages.
There are several ways to direct logging output to the Xray interface, each with varying degrees of extra information that gets passed with the logging call.
The most complete method of logging is to use Xray’s MTASC trace replacement in combination with the XrayLog class. This method of logging will give you the class and method the log call came from, the line number, and the logging level at which it occurred.This was the method used to generate the logging information shown in Figure 5-8. An example of this type of logging follows:
Perhaps the simplest way to log is to use Xray’s MTASC trace replacement by itself. Using this method, you get all the benefits of the previous option except for the use of logging levels; all messages will be sent at the Debug level. When using this method, you use trace() just like you would if you weren’t using Xray, and the log messages will be forwarded to the Xray Output panel.
The third way to log is using the XrayLogger class. Using this method, you get logging levels. You can optionally pass a parameter to the XrayLogger constructor and also receive the class name in your log output.
Since there is no trace() redirection available in ActionScript 3 development, only the third option of logging is available to the ActionScript 3 developer who wants to use Xray.
You’ve already read about how to filter the Xray log using debug levels in the Output panel, but there is another filtering option available to you. In the filtering section of the Output panel is a text field. When you enter text in this field, only log items containing that text will be displayed in the Output panel. The other log items will continue to exist, so you can later remove the filter and see all of the items. If you’re using a logging mechanism that provides the package and class names, you can filter by these names to quickly narrow down to the messages you care about.
To the right of the filtering section is a Highlight text field. Ifyou enter text in this field, any log items that contain that text will be highlighted in green. This is useful if you want to watch for a specific log message without turning all the others off. Both filters and highlights search in a case-insensitive manner.
Filtering and highlighting are meant to be used in a real-time manner. You can update them at any time and view the resulting output. But sometimes, you might want to methodically search through the output to find all occurrences of a phrase. The Search section of the Output panel will let you do this by searching forward or backward through the log output.
When logging, you’re not limited to displaying simple strings. All of the previous logging options take an additional parameter. In that parameter you can specify any ActionScript object. All of the properties of that object will be displayed in the Output panel. As an example, the following code:
results in this output:
You can output any type of object, including arrays. For example, the output from this code:
results in the following output:
Notice that arrays get printed out backward. This is because of the way Xray internally traverses objects.
Be careful when using this feature, because Xray will recursively log all the objects you specify. Ifyou have a complex set of MovieClips on your stage doing something like this:
then it could take several minutes for all the output to be sent to the Xray interface since thousands of lines are sent as Xray traverses all the children of every MovieClip on the stage.
Using the Xray Property Inspector
Besides logging, Xray has the ability to inspect and modify properties of a running SWF. To use this Property Inspector, you must have already set up your project to use the Xray execute connection. For ActionScript 3-based projects, you can simply create a variable of type com.blitzagency.xray. inspector.flex2.Flex2Xray and instantiate it. ForActionScript 2-based projects, you’ll need to use XrayLoader to load the Xray connector into your application.
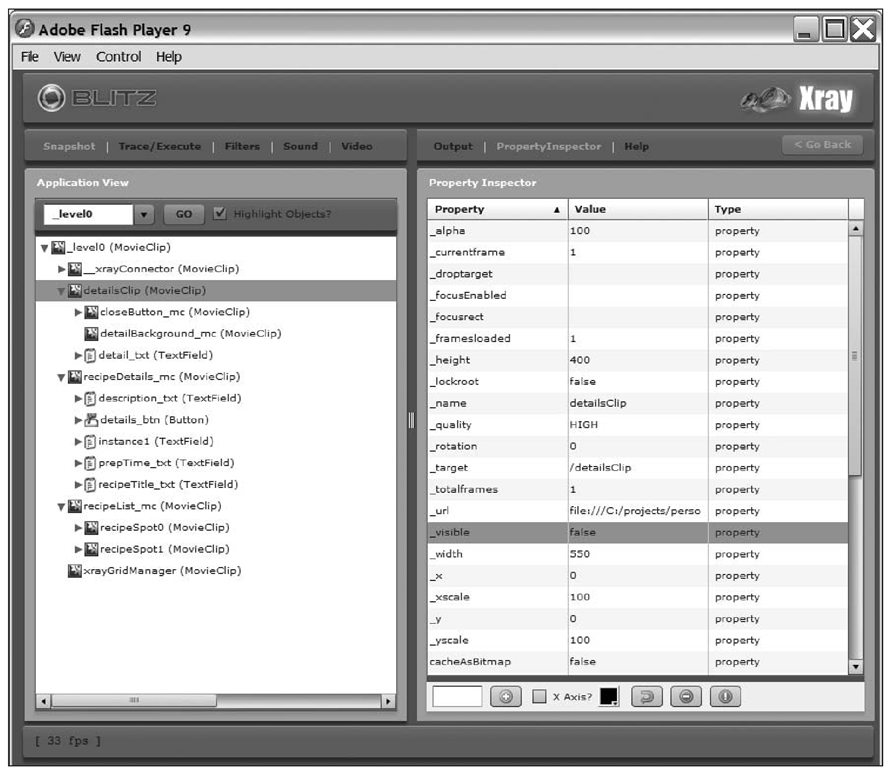
Figure 5-9 shows the Xray Property Inspector in use. Specific features of this interface will be explained in detail in the upcoming sections of this topic.
Figure 5-9. The Xray interface showing a listing of objects on the stage to the left and a list of properties of the selected object (detailsClip) on the right
Taking a snapshot
The Xray Property Inspector works on a loose concept of a snapshot. To begin using it, you select a root node to look at and click the Go button to take a snapshot. Xray then traverses all the children of the node you specified and presents you with an object tree you can navigate. By default, the root node is set for _level0, which in most applications should give you a complete inventory of onscreen objects.As you can see, all of the MovieClip, TextField, and Button objects we constructed in that example are visible there. I call it a “loose concept of a snapshot” because the individual properties that you view are updated every time you select a new node in the object tree.
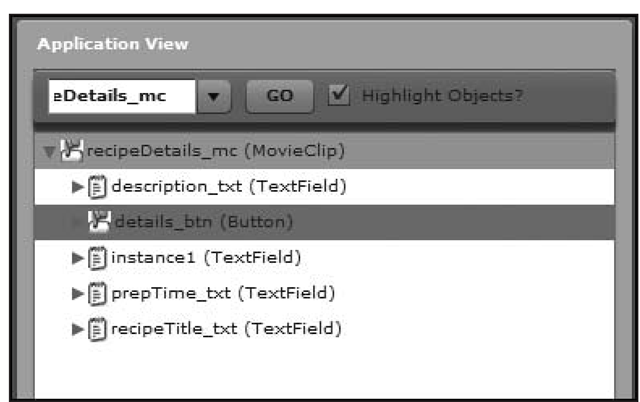
Besides viewing _level0, you can also take a snapshot at _global to view anything in the global namespace, or you can type in a path to an object to view only it and its children. For instance, if you typed the value of _level0.recipeDetails_mc into the text field and clicked the Go button, you would see an object tree as shown in Figure 5-10. For more complex applications, this can help narrow down the list to only the objects you care about.
Figure 5-10. The object tree of the Recipe Viewer application when a snapshot of _level0. recipeDetails_mc was taken
There is a check box next to the Go button labeled Highlight Objects. If this option is selected, then objects in your running application will have a yellow outline drawn around them as you mouse over them in the Xray interface. This lets you quickly identify onscreen objects with their representation in the Xray interface.
Sometimes, you may want to look at a SWF given to you before integrating it into your project. Assuming you’re working on an ActionScript 3-based SWF, you can use the XRayViewer application to load the SWF, and then you can view its details through the Xray interface. For more information on XRayViewer, visit http://www. rogue-development.com/xrayviewer.xml.
Modifying values
As you click objects in the object tree, the properties of that object are loaded in the Property Inspector. From the Property Inspector, you can see and modify any value of Number, String, or Boolean type. To modify a value, click it. If the value is a Boolean, it will be toggled to the opposite value. If the value is a String or Number, a new input field at the top of the Property Inspector will be shown, allowing you to change it.
Changes in the Property Inspector immediately take effect in your application. Ifyou set a MovieClip’s _visible property from false to true, you will immediately see the clip appear onscreen (assuming it’s not obscured by other content).
If you want to modify a value that isn’t a Number, String, or Boolean, then you can use the runtime execution of ActionScript feature described later this topic.
Inspecting nonvisual objects
Since Xray allows you to inspect the _global namespace, you can use it to inspect values of any object at runtime. To do so, add a line such as this in your code:
Then, any objects you want to inspect in any part of your application can have a reference added to that debug object. In the Recipe Viewer example from the previous topic, you could add the debugObject object in the startApp method and then modify the onXmlLoaded method to add some properties to it:
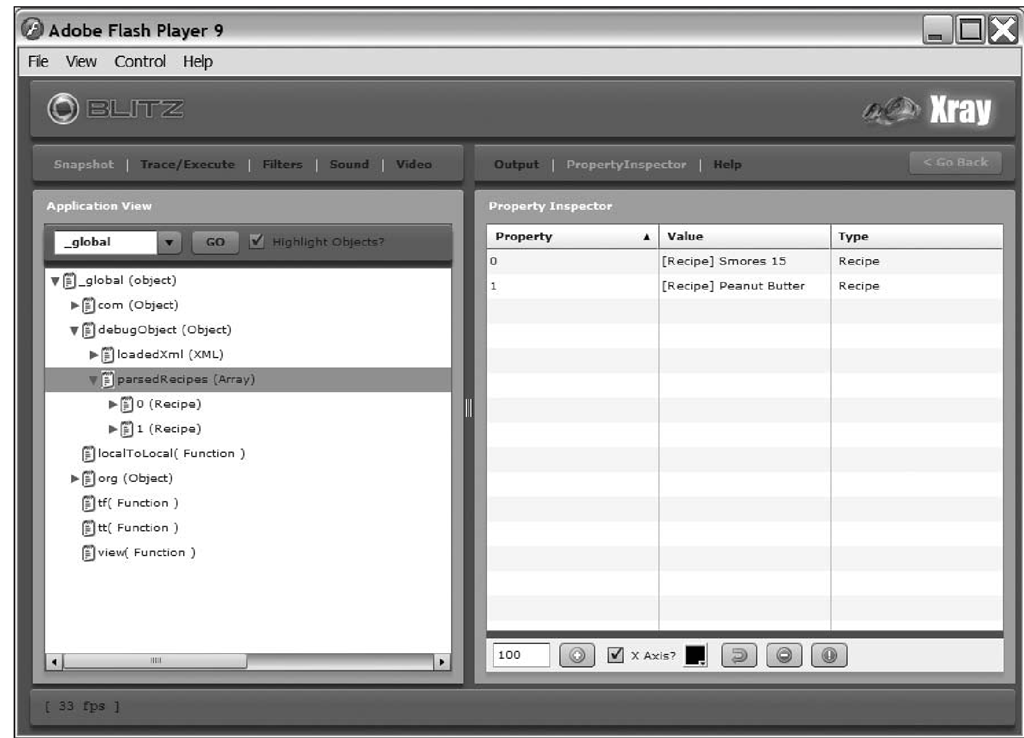
After making these changes, you will be able to view the loaded XML and the parsed output from that XML in Xray, as shown in Figure 5-11. Since using this technique allows you to inspect any object, it can aid in debugging a wide variety of situations.
Figure 5-11. The Xray Property Inspector showing debugObject
Adding debugObject to _global isn’t strictly necessary. You could simply add the objects you want to view as a property of _global like so:
However, this mechanism works only for complex objects. If you tried to assign i String to a property of global, it wouldn’t show up in the Xray interface:
By creating a debugObject, you avoid this problem, and all of your debugging information will be conveniently grouped together.
Executing ActionScript at runtime
Through Xray, you can execute any ActionScript code in your application’s runtime environment. To access this functionality, choose the Trace/Execute panel on the left side of the Xray interface. A large text area will appear. Anything you type in that text area and hit Enter after will be executed by your application. Using this functionality, you can manipulate any property of an object, not just Numbers, Strings, and Boolean values that the Property Inspector allows you to edit. For example, typing the following code will remove any filters that were applied to a specific object onscreen:
Xray creates a special function in the global namespace called tt to handle many of its internal logging commands. You can use that function from the Trace/Execute panel to display complex content in the Output panel. Ifyou were to execute the following code, the entire contents of the XML would be dumped to your Output panel:
Using this, you can view values you hadn’t previously added logging statements for in your application.
Finding performance bottlenecks
Flash Player can be fickle in what graphical operations will affect performance on any given platform the most. Finding performance-related bugs can be a difficult and time-consuming process. Xray aids in finding bugs related to graphical operations in two ways.
The first is the frames per second (FPS) meter that gives you a numeric scale of how well Flash Player is keeping up with the operations being asked of it. You can view this meter in the lower-left corner of the Xray interface and optionally from a text field in your running application. When this meter dips significantly below the published FPS rate of your SWF, some kind of performance problem is occurring.
To find what’s causing the performance problem, you can selectively toggle the visible property of elements on the stage. When you cause the offending piece to become invisible, Flash Player will spend less time trying to render it, and your FPS rate should jump back up. Through a process of elimination you should be able to determine which pieces of your application are slowing it down the most. Once you’ve found where the problem occurs, you can start to diagnose what the cause of it is. To do this, use the Property Inspector to manipulate various properties of the object to find out what the root cause is. Oftentimes, filters or alpha transparency can be the cause of performance problems. From the Xray interface, you can try disabling either of these to find out whether that’s the case.
In this topic, you learned what a unit test is and how to use both AsUnit and FlexUnit to write those unit tests. You also experimented with Xray and saw how it can be used for both logging and exploring a running SWF. In the next topic, you will look at some options for deploying a Flash-based application.
![tmpeeee-194_thumb[2][2] tmpeeee-194_thumb[2][2]](http://what-when-how.com/wp-content/uploads/2012/06/tmpeeee194_thumb22_thumb.png)
![tmpeeee-195_thumb[2][2] tmpeeee-195_thumb[2][2]](http://what-when-how.com/wp-content/uploads/2012/06/tmpeeee195_thumb22_thumb.png)
![tmpeeee-197_thumb[2][2] tmpeeee-197_thumb[2][2]](http://what-when-how.com/wp-content/uploads/2012/06/tmpeeee197_thumb22_thumb.png)

![tmpeeee-199_thumb[2][2] tmpeeee-199_thumb[2][2]](http://what-when-how.com/wp-content/uploads/2012/06/tmpeeee199_thumb22_thumb.png)
![tmpeeee-200_thumb[2][2] tmpeeee-200_thumb[2][2]](http://what-when-how.com/wp-content/uploads/2012/06/tmpeeee200_thumb22_thumb.png)
![tmpeeee-201_thumb[2][2] tmpeeee-201_thumb[2][2]](http://what-when-how.com/wp-content/uploads/2012/06/tmpeeee201_thumb22_thumb.png)
![tmpeeee-202_thumb[2][2] tmpeeee-202_thumb[2][2]](http://what-when-how.com/wp-content/uploads/2012/06/tmpeeee202_thumb22_thumb.png)
![tmpeeee-203_thumb[2][2] tmpeeee-203_thumb[2][2]](http://what-when-how.com/wp-content/uploads/2012/06/tmpeeee203_thumb22_thumb.png)
![tmpeeee-204_thumb[2][2] tmpeeee-204_thumb[2][2]](http://what-when-how.com/wp-content/uploads/2012/06/tmpeeee204_thumb22_thumb.png)
![tmpeeee-205_thumb[2][2] tmpeeee-205_thumb[2][2]](http://what-when-how.com/wp-content/uploads/2012/06/tmpeeee205_thumb22_thumb.png)
![tmpeeee-206_thumb[2][2] tmpeeee-206_thumb[2][2]](http://what-when-how.com/wp-content/uploads/2012/06/tmpeeee206_thumb22_thumb.png)


![tmpeeee-210_thumb[2][2] tmpeeee-210_thumb[2][2]](http://what-when-how.com/wp-content/uploads/2012/06/tmpeeee210_thumb22_thumb.png)

![tmpeeee-212_thumb[2][2] tmpeeee-212_thumb[2][2]](http://what-when-how.com/wp-content/uploads/2012/06/tmpeeee212_thumb22_thumb.png)
![tmpeeee-213_thumb[2][2] tmpeeee-213_thumb[2][2]](http://what-when-how.com/wp-content/uploads/2012/06/tmpeeee213_thumb22_thumb.png)
![tmpeeee-214_thumb[2][2] tmpeeee-214_thumb[2][2]](http://what-when-how.com/wp-content/uploads/2012/06/tmpeeee214_thumb22_thumb.png)
