Modification of contractility through dobutamine and esmolol
Dobutamine has the effect of an a1-, 31- and 32-agonist, while 31 stimulation of the heart is the most immediate effect. The main effects of dobutamine result from this, i.e. the increase of contractility of the myocardial cells and a dosage-dependent marked increase in heart rate. This leads to increased stroke volume (SV) and cardiac output (CO). The substance has a short half-life period of approx. 2 minutes and is broken down in inactive metabolites. It is thus applied per continuitatem. needs spell check here – it is the latin spelling and ok!.
Esmolol has the effect of a p1-antagonist and is thus cardioselective at the myocardium. The main effects are a decrease in heart rate and the inhibition of contractility. This leads to a decrease in stroke volume and in cardiac output. The half-life period is only approx. 9 minutes, as esmolol, in contrast to other beta blockers, is not broken down in an organ-dependent way, but is metabolized by esterases hydrolases. For this reason, esmolol has to be administered in a continuous or repetitive way.
Modification of load through hydroxyethyl starch, akrinor and sodium nitroprusside
In statistics or kinematics, load is a unit of measurement for the force that works on a medium. Accordingly and as far as the left ventricle is concerned, preload is the force that results in the extension of fibers at the end of diastole or directly before systole and which is limited by the maximum resting length of the muscle fiber. Afterload is a force influencing the ventricle; this force counteracts ejection out of the ventricle into the cardiovascular system. In practice, preload is referred to as the end-diastolic volume in the heart. The fact that the standard index Ees is load-independent , i.e. that changes in preload and afterload of the left ventricle mostly do not change the contractility index over wide periods, is an important characteristic of this measurement. Changes in load induce changes in contraction force, contractility remains unchanged, however.
Hydroxyethyl starch is a synthetically produced polymer and, like dextrane, and gelatine is used for the substitution of intravascular volume. End-diastolic volume was thus increased.
Akrinor is a fixed combination of the two active ingredients cafedrin and theodrenaline. Blood pressure is primarily increased through an alpha-receptor-mediated, arterial vasoconstriction. Then contractility and heart rate are slightly increased through a less intense stimulation of beta receptors.
Apart from inhibiting guanylate cyclase and consecutively releasing nitric oxide in the smooth musculature of the vascular wall, sodium nitroprusside has a vasodilative effect on both at the resistance vessels of the arterial system and at the capacitance vessels of the venous system. Due to the short half-life period of less than 10 minutes, continuous administration is necessary.
Determination of preload recruitable stroke work and elastance by the relation of arterial blood flow velocity to left ventricular area
The question whether contractility can be estimated with a flow-area relationship was the starting point for this study.
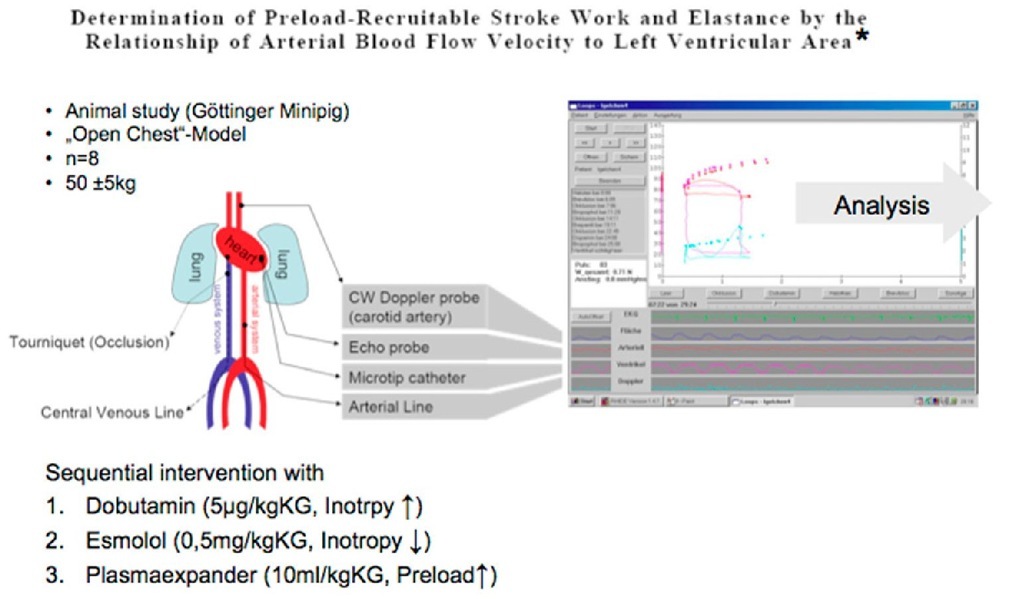
In a first animal experiment, 8 Gottinger minipigs were studied in an open chest preparation. An arterial manometer was placed in the femoral artery and a microtip catheter for the measurement of LV pressure was advanced into the left ventricle from the apex. A flexible TEE probe was fixed on the myocardium to sonographically estimate volume with LV area measurement. Finally, the arteria carotis communis was dissected to fix a U-shaped 8-MHz CW Doppler probe on it. Then an inferior vena cava occlusion was performed to reduce preload. A central venous catheter was implanted for the pharmacological intervention. Via this catheter, contractility was sequentially increased by the administration of dobutamine, it was decreased by the administration of the beta-blocker esmolol and preload was significantly increased with a plasma expander. A software exclusively developed by the Institute of Experimental Physics was used for data acquisition as well as data presentation and analysis (Fig. 3). During the examination we began to realize that we were generating loop diagrams and could calculate elastance.
Feasibility study – Method
Fig. 3. Diagram for the experiment set-up of the study "Determination of Preload Recruitable Stroke Work and Elastance by the Relation of Arterial Blood Flow Velocity to Left Ventricular Area".
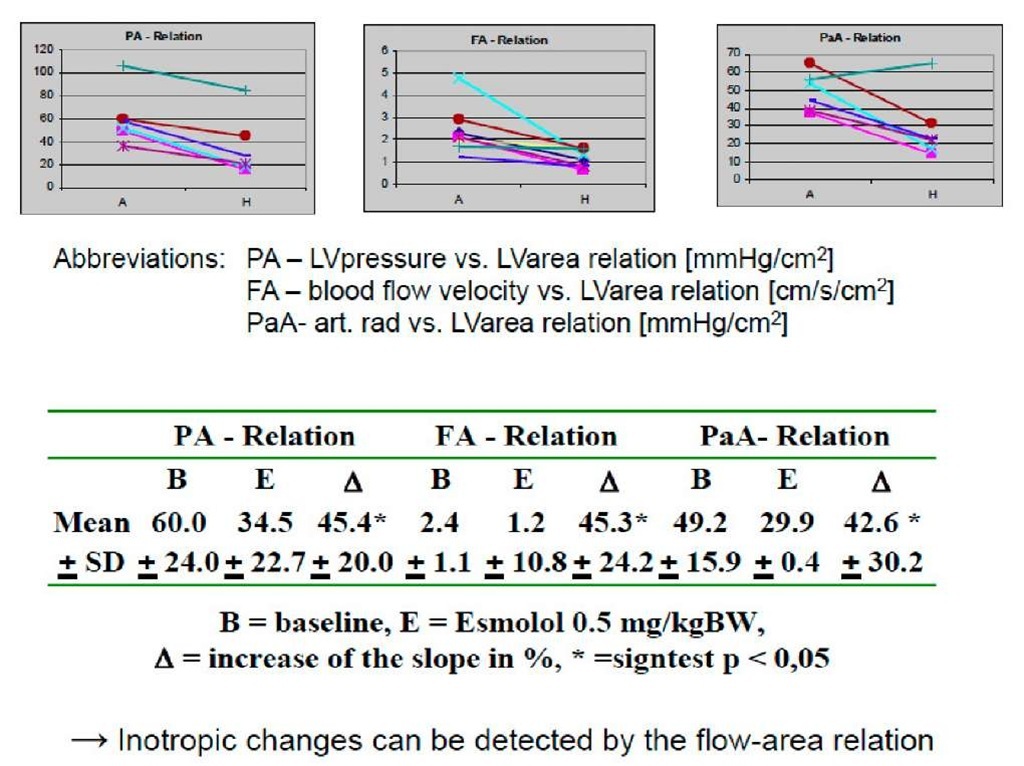
The data in table 2 (3b) show that the change in contractility was reliably detected through the change of slope of the individual elastance curves. A change of preload through the plasma expander did not influence the slope of the elastance curves.
To sum up, this study showed that contractility can be estimated with parameters which are deduced from flow-area relationships.
Fig. 3b. Feasibility study – Results
Time-varying elastance concept applied to the relation of carotid arterial flow velocity and left ventricular area
In the previous study, changes in inotropy could in fact be detected with the help of the flow-area relationship and the following study was to answer the question as to how this procedure corresponds to the standard procedure.
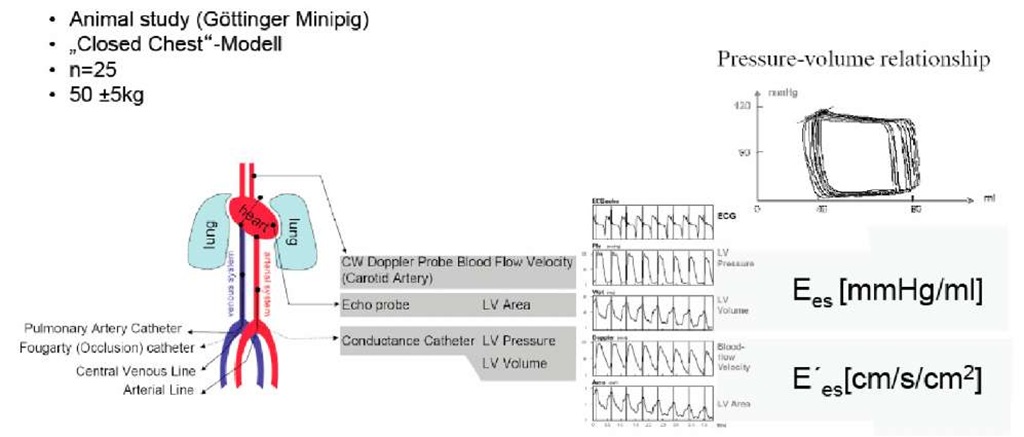
In an animal experiment, 25 Gottinger minipigs were studied in a closed chest preparation. After a puncture of the femoral artery, the conductance catheter was placed in the left ventricle under fluoroscopy. The cross-sectional LV area was determined in this study using a transthoracic probe and the arteria carotis communis was studied as before. A pulmonalis catheter was used for the calibration of the conductance catheter and a Forgarty catheter, which was advanced into the inferior vena cava, was used for preload reduction. The central venous catheter served as a line for the pharmacological interventions. Like in the previous study, contractility was sequentially increased by the administration of dobutamine, it was decreased by the administration of the beta-blocker esmolol and preload was significantly increased with a plasma expander. Additionally, afterload reduction was induced through akrinor.
For the collection and processing of data, software developed by Paul Steendijk from the experimental cardiology of the University Leiden was used in this study. Pressure volumes and flow-area relationships could be described using this software. The elastance of the LV pressure-volume relationship is referred to as Ees in literature and we called the elastance of the flow-area relationship E’es.
Fig. 4. Diagram for the experiment set-up of the study "Time-Varying Elastance Concept Applied to the Relation of Carotid Arterial Flow Velocity and Left Ventricular Area"
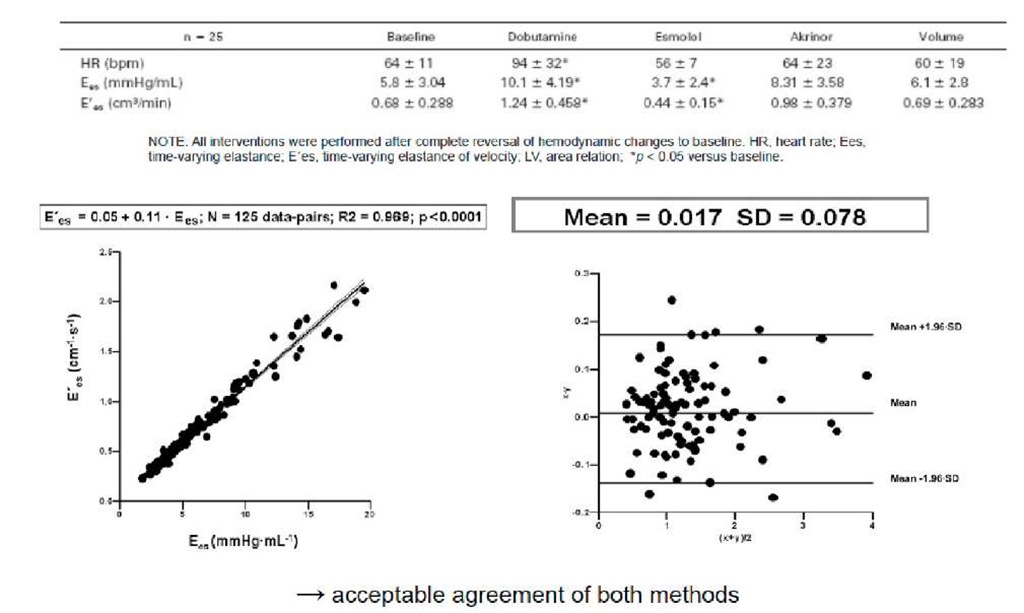
Fig. 4b. Validational study (Conductance-Catheter) – Results
In relation to the initial values, the values obtained from both procedures displayed changes in inotropy. A regression analysis was carried out using the pooled data. A significant linear correlation between the two measuring methods became evident. The Blant-Altman analysis showed that both methods correspond to each other acceptably.
The relationship between carotid blood-flow velocity and left ventricular area during acute regional ischemia
This study was to answer the question as to how the two measuring methods would correspond to each other in the case of a myocardial wall motion abnormality.
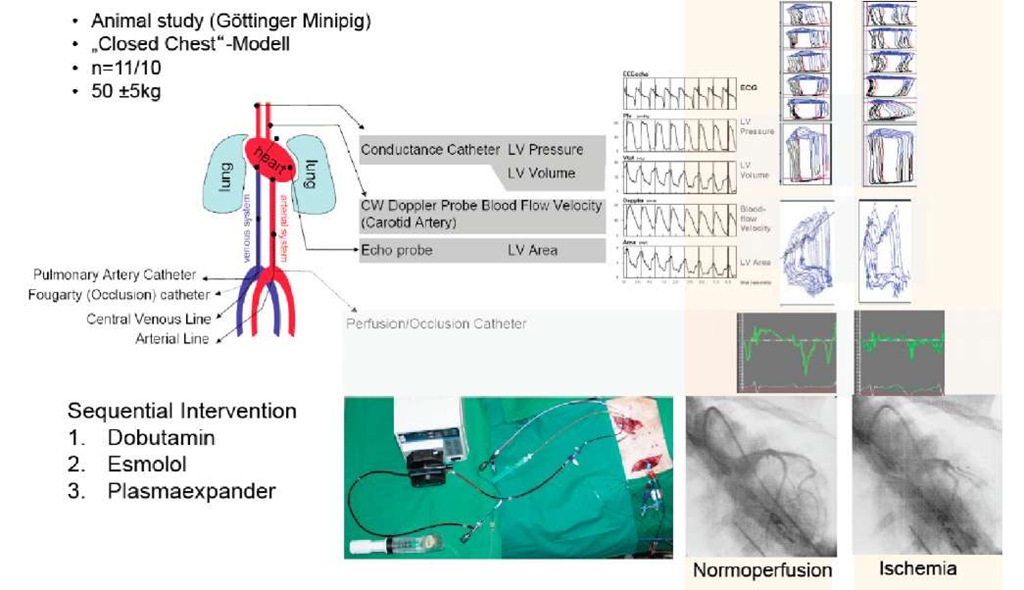
Fig. 5. Diagram for the experimental set-up of the study "The Relationship between Carotid Blood-flow Velocity and Left Ventricular Area during Acute Regional Ischemia".
In an animal experiment, 11 Gottinger minipigs were studied in a closed chest preparation. We advanced a coronary occlusion-perfusion catheter into the ramus circumflexus of the left coronary artery from the arteria femoralis. This catheter makes it possible to occlude a coronary artery while at the same time perfusing it with arterial blood using an adjustable roller pump. Standardized reduction of myocardial wall motion in the circulation area of the coronary artery was monitored by determining the systolic, radial strain rate. The strain rate is the rate of myocardial deformation and thus a unit of measurement for myocardial function. As the arteria femoralis was being used by the catheter, we advanced the conductance catheter through the right arteria carotis communis. Apart from that, preparation was the same as in the previous study.
Fig. 4 shows the loop diagram under normal perfusion and under ischemic conditions. The segmental loops of the conductance catheter deform under ischemia in the corresponding areas. This deformation was used for the calculation of an internal flow fraction, which arises when myocardial contraction cannot be completely transformed into an arterial flow.
Measurement of Myocardial Contractility in the Ischemic Heart – A Disease Immanent Uncertainty
NOTE. Normal perfused myocardium n-11. ischemic conditions, n-10. Abbreviations: Ees, end-systolic elastance calculated from the pressure-volume relation: E=es, end-systolic elastance calculated from the ftow-area relation; IFFsys, systolic internal flow fraction. ‘Significance versus conesponding baseline value (p<0 05), fSigniticance versus conesponding nonischemic value (pO 05).
Fig. 5b. Validational study during regional ischemia – Results
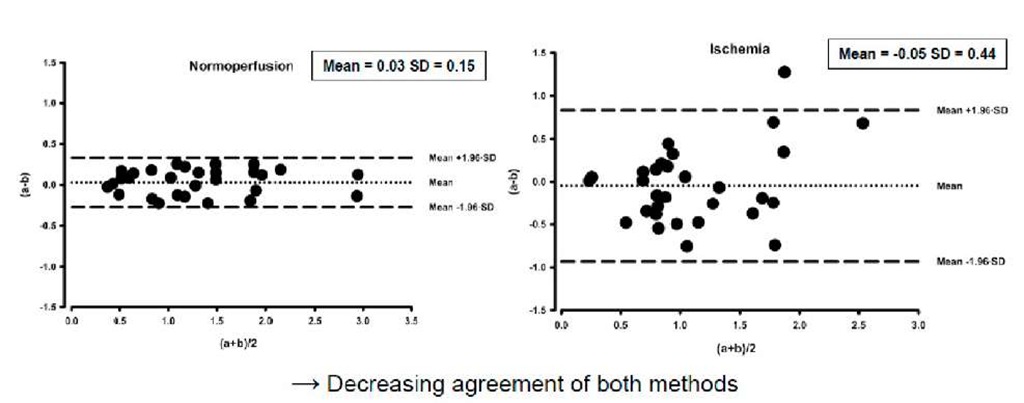
As the graph is directly taken from another journal, please get the copyright. I do realize that the author for this topic is also the author for that article. However, the copyright need to be obtained as a formality from the journal. Table 1 (III 5b) shows that both procedures, independent of myocardial perfusion, could detect changes in inotropy. What stands out, however, is that the application of a plasma expander under myocardial ischemia leads to significant changes of the slope of the flow-area relationship compared to the initial values. The internal flow fraction also changed significantly under these conditions. Regression analysis in Fig. 5 (do you mean 5b? 5 is not a statistical analysis under ischemic conditions showed a decrease in the regression coefficient, linear correlation remained significant, however. The Bland-Alman analysis in Fig. 6 showed that the correspondence of the two parameters decreases.
The results of the study carried out showed that a valid assessment of myocardial contractility is possible with the flow-area relationship. Myocardial wall motion abnormalities constitute a limitation of the procedure.
