Abstract
Geographic information systems (GIS) have numerous applications in human health. This topic opens with a brief discussion of the three dimensions of decision-making in organizations — operational control, management control, and strategic planning. These dimensions are then discussed in terms of three case studies: a practice-improvement case study under operational control, a service-planning case study under management control, and a research case study under strategic planning. The discussion proceeds with an analysis of GIS contributions to three health care applications: medical/disability services (operational control/practice), emergency response (management control/planning), and infectious disease/SARS (strategic planning/research). The topic concludes with a cross- case synthesis and discussion of how GIS could be integrated into health care management through Spatial Decision Support Systems and presents three keys issues to consider regarding the management of organizations: Data Integration for Operational Control, Planning Interorganizational Systems for Management Control, and Design Research for Strategic Planning.
Introduction
Geographic information systems (GIS) have numerous applications in human health. At the most basic level, entire research and practice domains within health care are strongly grounded in the spatial dimension (Meade & Earickson, 2000).
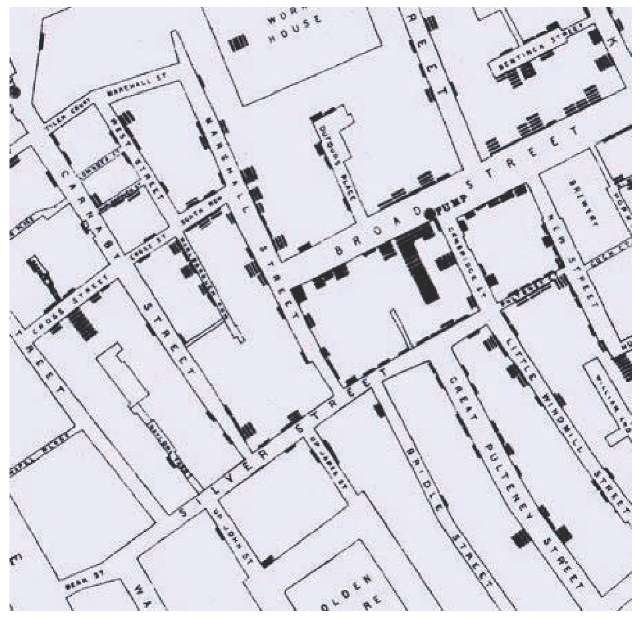
Indeed, the pioneering work of Dr. John Snow in diagnosing the London Cholera Epidemic of 1854 not only launched the field of epidemiology, but did so in a manner closely linked with the visual display of spatial information (Tufte, 1997). The health care enterprise has become much more complex since the time of Dr. Snow and so have the technologies that are employed to conduct spatial analysis regarding heath care conditions and services (Dangermond, 2000).
This topic opens with a brief discussion of the three dimensions of decision-making in organizations — operational control, management control, and strategic planning. These dimensions are then discussed in terms of the case study focus of the topic, which includes a practice-improvement case study under operational control, a service-planning case study under management control, and a research case study under strategic planning. The topic proceeds with the analysis of GIS contributions to three health care applications: medical/disability services (operational control/practice), emergency response (management control/planning), and infectiousdisease/SARS (strategic planning/research). The topic concludes with a cross- case synthesis and discussion of how GIS could be integrated into heath care management through spatial decision support systems.
background
One definition of a GIS is as “a group of procedures that provide data input, storage and retrieval, mapping and spatial analysis for both spatial and attribute data to support the decision-making activities of the organization” (Grimshaw, 2000, p. 33). One of the most well known models for thinking about the nature of these decision-making activities in the organization is Anthony’s Model.
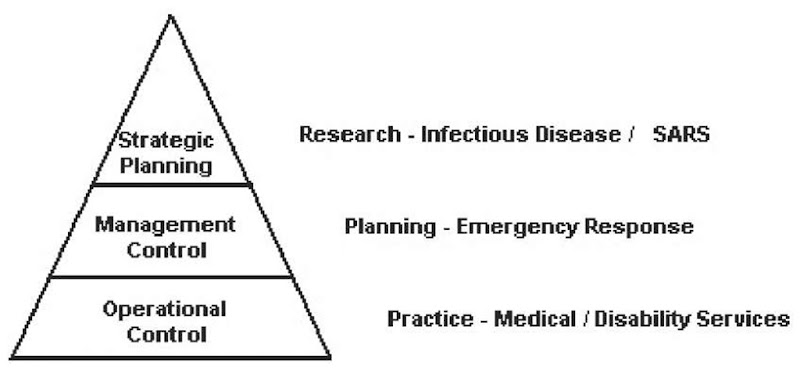
Anthony’s Model implies a hierarchy of organizational decision-making. Here, a qualitative distinction is made between three types of decision-making: Operational Control, Management Control, and Strategic Planning (Ahituv, Neumann, & Riley, 1994). As GIS has developed,the range of applications for spatial data on human heath has grown dramatically (Cromley & McLafferty, 2002). In an effort to provide an in-depth understanding of these applications, this topic considers three distinct application areas of GIS and Human Health: Practice, Planning, and Research. The combination of GIS and Human Health applications with the decision-making processes as defined in Anthony’s Model is outlined below:
Figure 1. John Snow’s map of the Broad Street pump outbreak, 1854
• Operational Control is the management of people, assets, and services using spatial information to ensure the delivery of the health care service while assuring that specific tasks are carried out effectively and efficiently. Our focus in this dimension is how spatial information can improve the practice of health care.
• Management Control encompasses the management surrounding the health delivery system as a whole, and is specifically related to the needs and provisioning of health services, health promotion, disease prevention, and health inequalities while assuring that resources are obtained and used effectively and efficiently in the accomplishment of the organization’s objectives. Our focus in this dimension is the use of spatial information to assist in the planning of health care services.
• Strategic Planning deals with the spatial distribution of diseases, their epidemiologi-cal patterns, and relation to environmental health risks and demographic characteristics while deciding on objectives of the organization, on changes in these objectives, on the resources used to attain these objectives, and on the policies that are to govern the acquisition, use, and disposition of these resources. Our focus in this dimension is how spatial-based research can affect the strategic design of health care delivery applications.
These combinations of GIS and Human Health applications and decision-making processes are used to present this particular series of case study summaries (Figure 2). The first case is an example of the practice of GIS regarding Disability Evaluation delivery at the Operational Control level. The second case is an example of planning regarding the use of a GIS for the delivery of Emergency Management Services at the Management Control level. The third case is an example of research regarding the conceptual design and development of a GIS as it relates to the National Electronic Disease Surveillance System at the Strategic Planning level.
Figure 2. GIS and human health decision-making and applications
research methodology
The research presented in this topic draws on three case studies to illustrate various organizational scenarios in which a GIS was utilized, or could be utilized, to solve a particular Health Care Service problem.
case study
Case study methods can be used to explore the occurrence of a phenomenon with special attention to the context in which the case study is occurring. The most common working definition of this approach is offered by Robert Yin, who views case studies as “an empirical inquiry that investigates a contemporary phenomenon within its real-life context, especially when the boundaries between phenomenon and context are not clearly evident” (1994, p. 13). Yin’s defining work and related treatments further note that there are several uses of case studies:
• Exploratory Value - To uncover the nature of the phenomenon of interest. This can often serve as a precursor to more quantitative analysis.
• Explanatory Value - To help explain a phenomenon, such as when a quantitative study has revealed statistical association between variables but a deeper understanding of why they are related is missing.
• Causal Value - To provide a rich explanation of phenomenon of interest, including “patterns” that are not easily discernible through more abstract and/or numerical analysis.
Case studies have been used throughout the social sciences, as well as in business studies. Single-case design often uses the extreme or unique case to illustrate those phenomenon that are acutely visible such that inferences can be easily drawn that can be generalized to lessextreme cases (Yin, 1994). Pare (2001) recently summarized the widespread use of case studies to examine the influence of information technology and systems in a variety of fields. Moreover, in his work with Elam, they note the promise of building a theory of IT through multiple case studies ( 1997). In a similar manner, this topic uses three case studies in an exploratory fashion to enhance the understanding of IT usage, specifically GIS usage, within the context of health care.
For each case relevant literature was reviewed. For the first and second cases, the authors obtained original empirical information as part of separate studies. In the third case, a new and timely application at the strategic level is proposed.
Case studies operational control case study
Background
One core practice area in medical services is the matching of patient/client services to providers (Cromley & McLafferty, 2002). The company in this case provides an array of disability evaluations, management, and information services nationwide. Of relevance to the subject of this topic, this company (headquartered in Southern California) examined the use of a GIS to assist them in planning and marketing their disability evaluation services. With respect to Operational Control, this case study deals with appointment processing and the practice of ensuring the effective and efficient delivery of this service using spatial information.
Problem
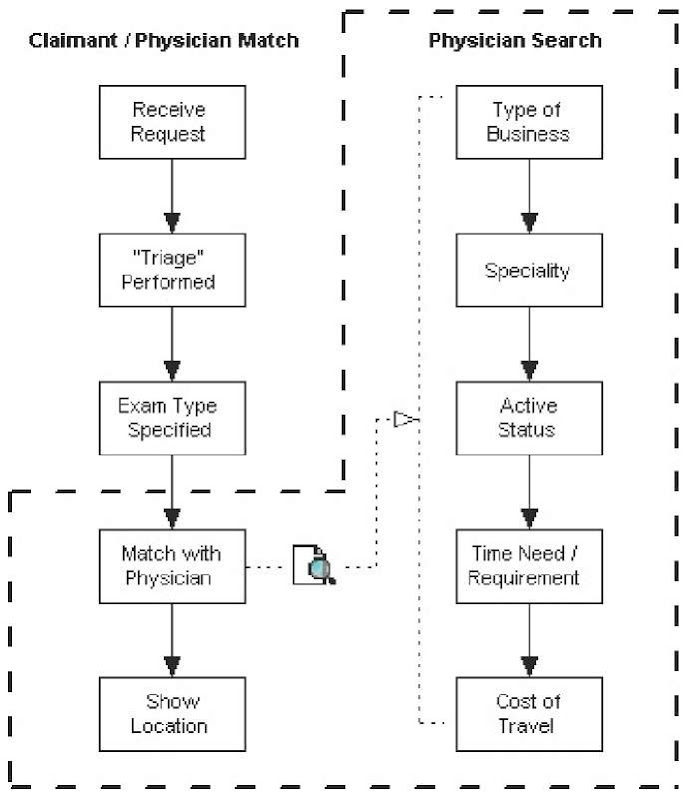
The problem for this company was to provide an appointment for a claimant with a physician in a timely manner while meeting specific requirements and constraints. The existing workflow process was inadequate in meeting these requirements. Figure 3illustrates the workflow for this process, which begins when a case manager receives a request for an appointment. These requests are prioritized or “triaged” and the required exam sheets are generated using an expert knowledge base. Based on constraints such as physician specialty, availability, contract type, and location, an appointment is made for the claimant with the physician who is the “closest fit” (distance and travel-time) with minimal travel-time being the higher priority.
Figure 3. Claim process
In this workflow process, the company was pleased with the efficiency and effectiveness of the first steps in the workflow process, which are computer-based. However, the last few steps were conducted using paper-based data sets and a number of Internet-based mapping websites (Yahoo Maps and MapQuest). As a result, these last few steps negatively impacted the amount of time a case manager interacted with a claimant, thereby increasing the company’s costs in providing this service.
Solution
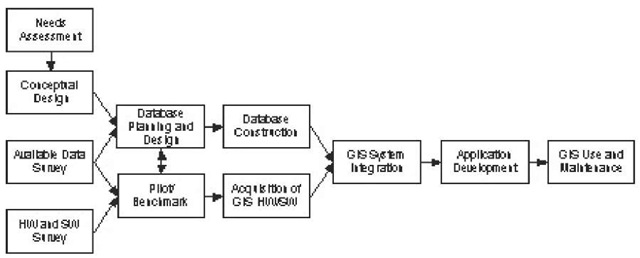
Using an Internet-based GIS application, a successful prototype was implemented for use within the company’s Extranet. To develop this solution, a GIS planning process, also known as the GIS development cycle was employed (NYSARA & NCGIA, 1997). This process, illustrated in Figure 4, consists of a set of eleven steps starting with a needs assessment and ending with the on-going use and maintenance of the GIS system.
Outcome
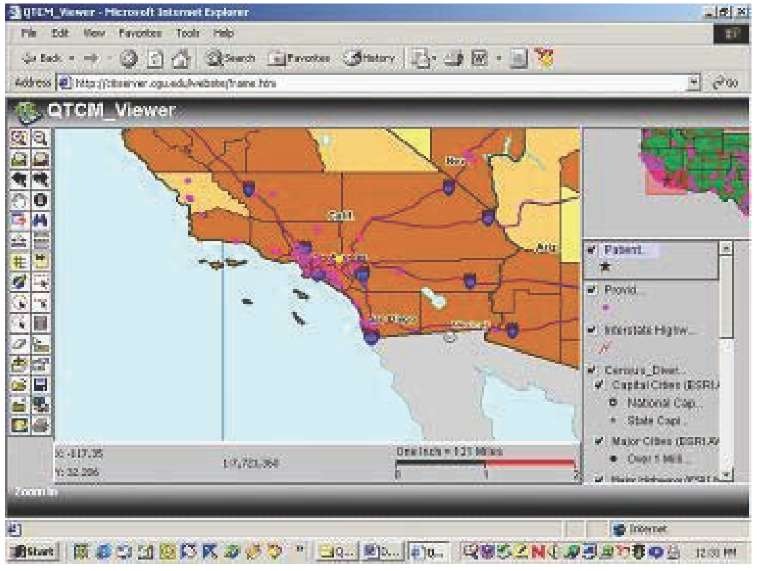
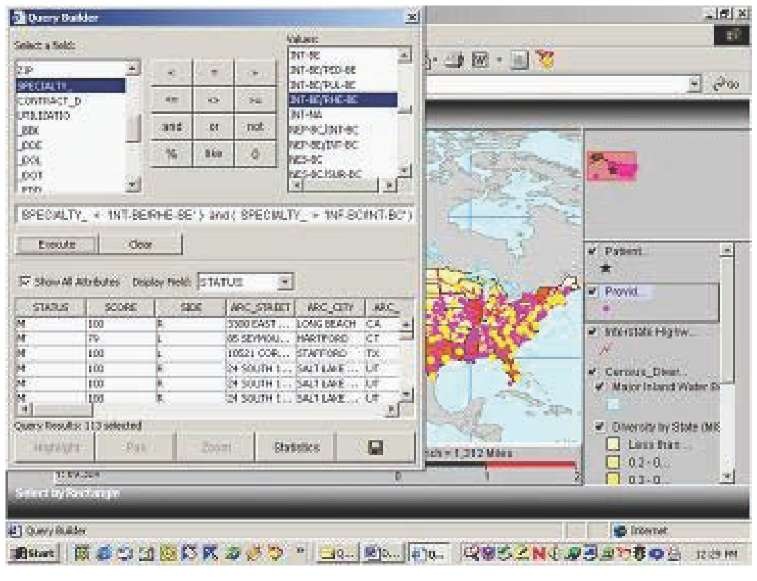
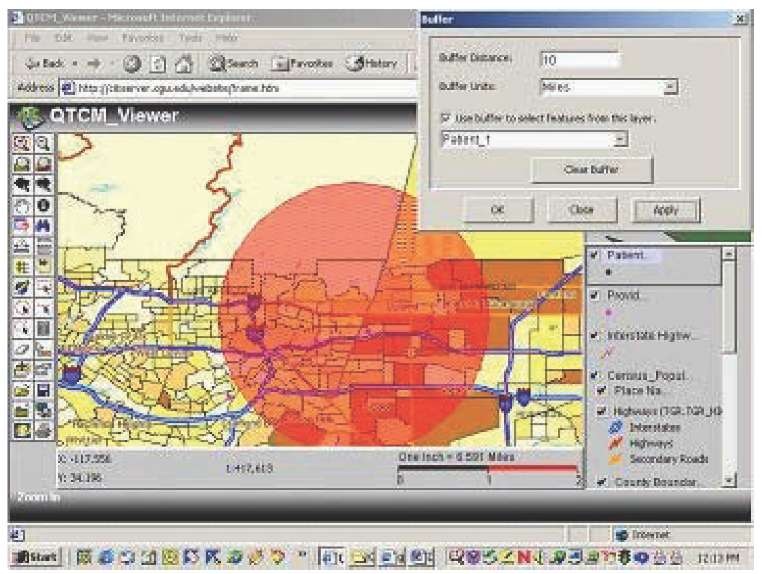
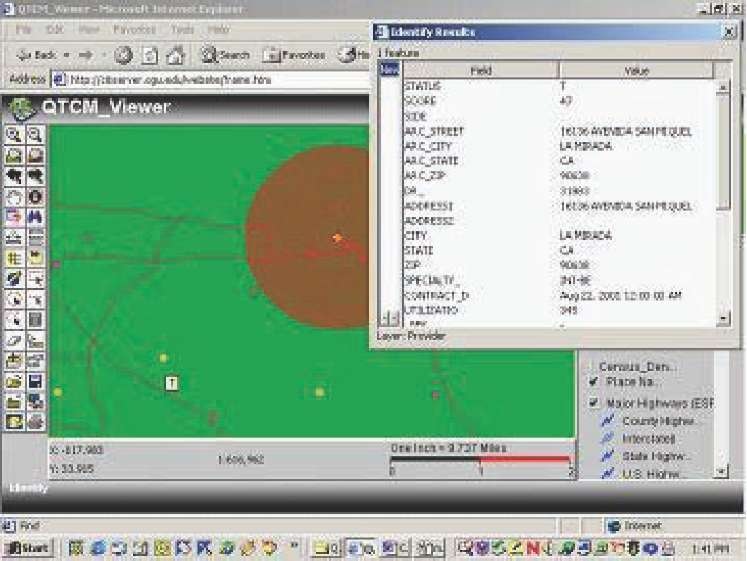
Figures 5 through 8 provide an overview of the GIS based address-matching process that was developed. Now, when a case manager receives a request for an appointment they pinpoint the location of the claimant by “geocoding” the claimant’s address (Figure 5). With the location of the claimant identified, the case manager then performs a physician attribute search, such as physician specialty, to identify only those physicians that meet the claimants’ requirements (Figure 6). A physician spatial search is then performed to narrow down this list even further by locating only those physicians that are within a specified proximity to the claimant (Figure 7). Finally, a physician is chosen from this group that most closely matches the claimants’ requirements and an appointment is made (Figure 8). The most important outcome of this case was a reduction in time required to set an appointment location and date. An additional beneficial outcome of this case was the development of a “live” connection between this system and the company’s Oracle database. This database, which is updated on a daily basis, enables the company to exchange information between geographically distributed offices in real time. Consequently, users using the new GIS are now able to view the latest data, geocoded on a map, from any company location. Another important outcome of this case is the fact that this shared information is in a visual format.
Figure 4. GIS development cycle
Figure 5. Step 1: Geocoding ofclaimant
Figure 6. Step 2: Physician attribute search
Figure 7. Step 3: Physician spatial search
Management control case study
Background
The United States Emergency 911 system, established more than 30 years ago, has become a cornerstone infrastructure for emergency management. However, the system is becoming increasingly stressed due to new wireless and digital communications technologies (Jackson, 2002; National Emergency Number Association, 2001). The original design could not anticipate the widespread use of mobile communications for emergency purposes seen today. Consequently,this growth in wireless telecommunications is forcing the Emergency 911 infrastructure to change (Folts, 2002; Jackson, 2002; National Emergency Number Association, 2001). This case considers the broad development of Emergency Medical Service (EMS) systems, within the specific context of rural Minnesota. With respect to Management Control, this case encompasses the spatial properties surrounding the health delivery system as a whole, and is specifically related to the planningof E-911 services with the goal of assuring that wireless telecommunications services resources are obtained and used to accomplish the objectives of the State of Minnesota.
Figure 8. Step 4: Final physician selection
Problem
The advent of competitive sector telecommunications services in the wireless arena has played a pivotal role in the fast growth and use of the safety information network. Wireless phones have rapidly become one of our most effective tools in improving emergency response time and saving lives. A wireless 911 phone call can shave valuable minutes from the time otherwise required for a caller to find a conventional phoneto access emergency medical services (Tavana, Mahmassani, & Haas, 1999). In the past 10 years, wireless phone use has grown exponentially. There are more than 120 million wireless users making approximately 155,000 emergency calls a day across the United States. The steady increase in private sector wireless subscribership and resulting mobile EMS use has created a need to better understand the implications of this rapidly growing system.
One illustration of the spatial challenges confronting EMS providers is the lack of location information regarding E-911 accessibility. The U.S. Federal Communications Commissions (FCC) has enacted mandatory requirements for wireless communications carriers to provide automatic location identification of a wireless 911 (E-911) phone call to an appropriate Public Service Answering Point (PSAP) (Federal Communications Commission, 2001). Both private carriers and public agencies are working closely together to overcome this difficult requirement. Although the technical requirements for building these systems have been thoroughly outlined, the execution of the service has materialized slowly (Christie et al., 2002; Zhoa, 2002).
One possible reason for this is the difficulty involved in committing to one of several viable technology alternatives to provide E-911. For example, one E-911 technology choice is a satellite-based system, which places a GPS-enabled chip in mobile phones along with location readers at the receiving point. With the current rate of technological change, selecting the one best solution, or combination of solutions, for long term system planning and investment is a difficult and daunting task for system administrators and designers (Proietti, 2002). The consequence of this situation is that deploying end-to-end E-911 systems will require new spatial technologies and nontraditional partnerships, particularly among wireless carriers, emergency dispatch center administrators (e.g., PSAPs), law enforcement, fire and EMS officials, automotive companies, consumers, technology vendors, and state and local political leaders (Jackson, 2002; Lambert, 2000; Potts, 2000). From a spatial perspective, the result is that location-based (E-911) services will be differentially deployed across regions, leading to a need to understand which areas are well serviced and which may require additional policy attention.
From a planning perspective, the need for special attention to rural areas is evident from the following statistics. According to the U.S. Department of Transportation, more than 56% of fatal automobile crashes in 2001 occurred on rural roads (National Center for Statistics and Analysis, National Highway Transportation Safety Administration, & U.S. Department of Transportation, 2002). The Minnesota Department of Transportation (MnDOT) reports that only 30% of miles driven within the state are on rural roads, yet 70% of fatal crashes occur on them (Short Elliot Hendrickson Inc. & C.J. Olson Market Research, 2000). In addition, 50% of rural traffic deaths occur before arrival at a hospital. Appropriate medical care during the “golden hour” immediately after injuries is critical to reducing the odds of lethal or disability consequences. Crashvictims are often disoriented or unconscious and cannot call for help or assist in their rescue and therefore rely heavily upon coordinated actions from medical, fire, state patrol, telecommunications and other entities (Lambert, 2000).
Solution
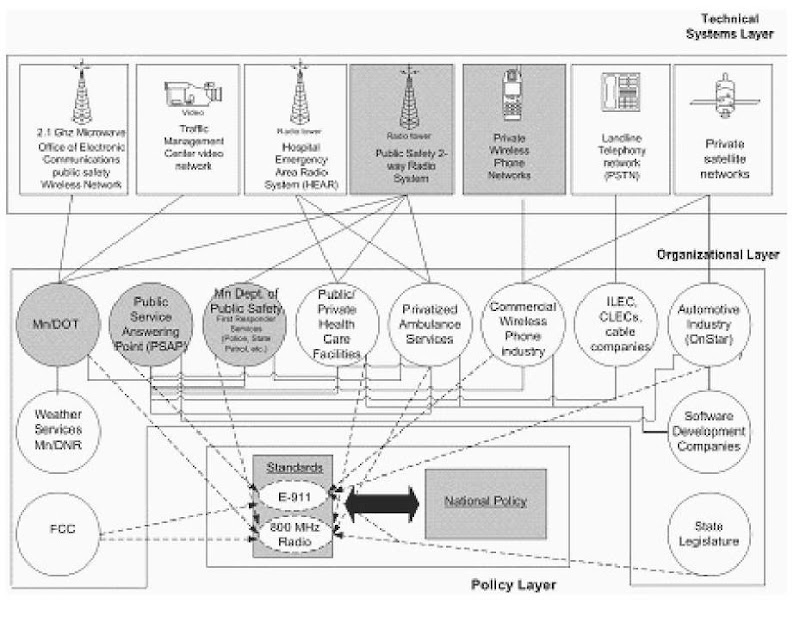
The solution to the rural EMS program entails a combination of responses. These responses were analyzed within the context of a specific case study; an analysis of Minnesota’s E-911 system (Horan & Schooley, 2003). The first activity in this case was to analyze the entire system and to construct an overall architecture of the system. This architecture, presented in Figure 9, illustrates Minnesota’s EMS system along several key strata, technology, organizations, and policy, and identifies possible critical links (shaded gray) in the overall system. A summary of each layer follows.
• Technology - The top layer of the architecture illustrates some of the essential networks and communications technologies used by Minnesota EMS organizations to carry out their individual and interorgani-zational functions. From a GIS perspective, the GPS-equipped wireless devices and infrastructure to determine spatial location are critical elements.
• Organizations - The middle layer illustrates some of the public and private organizations involved in the Minnesota EMS and the general interorganizational relationships between these organizations. There is a significant geographic dimension to the organizational layer: each of the major stakeholders has distinct service boundaries (for example, there are 109 PSAPs, yet nine rural transportation operation centers).
• Policy - For EMS interorganizational relationships (i.e., partnerships, joint ventures, etc.) to succeed, policies need to be developedthat facilitate the interorganizational use of new and existing communications technologies. The overarching EMS technology-related policies, illustrated in the bottom layer, currently under development in the state are E-911 and 800 MHz radio. This includes the state-federal effort to develop standards and procedures for using location information received from mobile phones.
Outcomes
This case study raises several technological, organizational, and policy issues for planning EMS in rural Minnesota specifically, as well as for rural areas in general. The architecture highlights several critical areas that arose from this review and therefore have implications for future advancements. Areas, such as those denoted in gray in Figure 9, provide a focal point for discussing implications of this architecture for planning both EMS in general and GIS specifically.
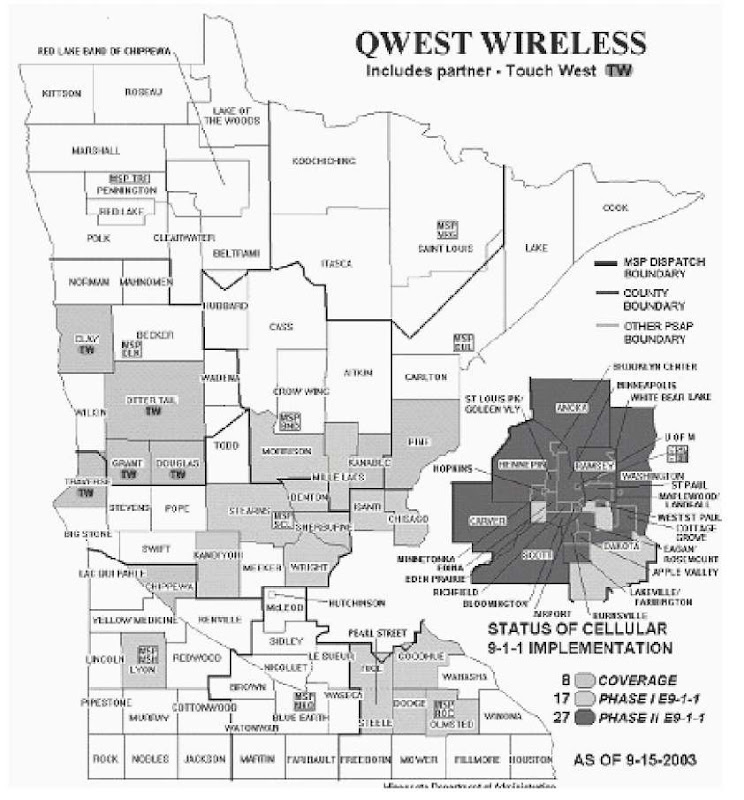
GIS can assist greatly in understanding the extent of EMS coverage. Currently, this understanding is at a general level of detail, i.e., the level of compliance with new E-911 regulations. For example, Figure 10 provides an example of the spatial dimension of E-911 deployment by a major provider. As displayed in this figure, the metropolitan region of Minneapolis has deployed location-identifying systems (e.g., E-911 Phase 2), while such systems have only been partially deployed in rural areas2 .
Figure 10also provides an overview of the level of compliance with these new regulations, with lower compliance in rural areas. As shown in the figure, many regions in Minnesota are compliant with Phase 1 — the regulation requiring the provision of location-based information about mobile phones. From a service planning perspective, it will be important to monitor the spatial distribution of E-911 availability. Inadequate coverage in rural areas could give rise to the need for additional public policy regulations.
Figure 9. Interorganizational architecture for emergency management systems in Minnesota
Figure 10. Spatial distribution of E-911 compliance status (Qwest)
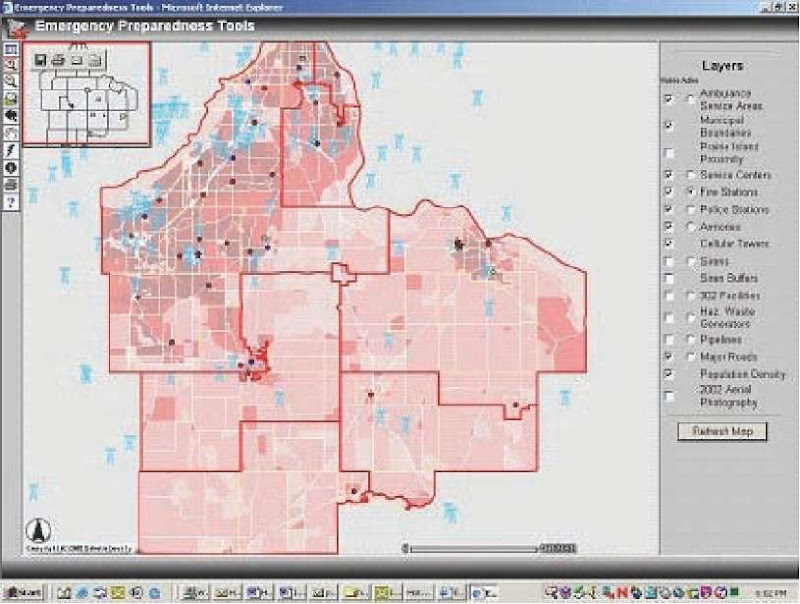
The deployment of advanced 911 capabilities is however, only one aspect of integrated EMS services. Especially with recent concerns regarding homeland security, attention is now turning to how EMS is planned as part of an overall readiness strategy. In this context, GIS can play an important role in providing a spatial platform for EMS and related emergency services. One example of this is the GIS development work underway in Dakota County, Minnesota. This county, which includes significant rural as well as urban areas, has undertaken a comprehensive GIS-based approach to emergency preparedness with an Internet-based GIS platform that integrates both EMS related factors (e.g., Ambulance Service Areas and Cellular Towers) with other civic institutions involved in emergency preparedness (e.g.,
Fire Stations, Police Stations, and Armories)3. As illustrated in Figure 11, the Municipal Boundaries (outlined in bold) within Dakota County and the locations of Fire Stations, Police Stations, and Armories (dots) are identified. The locations of Ambulance Service Centers (dots) and Cellular Towers (tower symbol) are identified as well.
Platforms such as this represent a critical new dimension of interactivity whereby emergency management systems can be accessed dynamically and across institutions as well as infrastructure systems. Returning to the original architecture outlined above, this platform can be used by institutions such as the departments of transportation, public safety, and emergency services to facilitate cross-agency partnerships in service and technology deployments.
Figure 11. Internet-based GIS emergency preparedness application
In summary, this case demonstrates that the planning of emergency medical services is well suited to benefit from a dynamic GIS platform. Particularly in rural areas where resources are often scarce, such a platform can provide a common database to (1) monitor the spatial deployment of services, (2) facilitate resources sharing among institutions, and (3) provide a common understanding of ” conditions” against which to plan for new technologies, systems, and policies.
Over time, it will be important to monitor the rate by which rural communities improve their “readiness.” GIS can assist in this monitoring, including tracking of funding expenditures, regulatory compliance, etc. Finally, it is essential that methods of planning and analysis used to determine the form, level, and location of service and resource provision reflect the geographical components underpinning the health care system, i.e., the planning process should have an explicit geographical focus (Birkin, Clarke, Clarke, & Wilson, 1996).
Strategic planning case study
Background
As noted in the introduction, spatial analysis and mapping in epidemiology have a long history (Fr-erichs, 2000), but until recently, their use in public health has been limited. However, recent advances in geographical information and mapping technologies and increased awareness have created new opportunities for public health administrators to enhance their planning, analysis and monitoring capabilities (World Health Organization, 1999b). Moreover, effective communicable disease control relies on effective disease surveillance where a functional national communicable diseases surveillance system is essential for action on priority communicable diseases (World Health Organization, 1999a). With respect to Strategic Planning, this case considers a research program regarding the spatial distribution of severe acute respiratory syndrome (SARS), its epidemiological patterns, and a theory to direct health organizations objectives and policies regarding the acquisition, use, and disposition of GIS.
The National Electronic Disease Surveillance System (NEDSS) program was initiated in the United States to provide an integrated, standards-based approach to public health surveillance and to connect surveillance systems to the burgeoning clinical information systems infrastructure (U.S. Department of Health and Human Services, 2002a). It is expected that the NEDSS will improve the nation’s ability to identify and track emerging infectious diseases, monitor disease trends, respond to the threat of bio-terrorism, and other scenarios where the rapid identification of unusual clusters of acute illness in the general population is a fundamental challenge for public health surveillance (Lazarus et al., 2002).
To be effective with the rapid deployment of new health information systems, it is important to maintain effective mechanisms for rapid technology transfer to occur across government, academia, and industry (Laxminarayan & Stamm, 2003). The NEDSS program articulates an architecture that will enable public health information systems to communicate electronically, thereby decreasing the burden on respondents and promoting timeliness and accuracy (U. S. Department of Health and Human Services, 2002a). Stakeholders in the NEDSS include not only the Center for Disease Control (CDC) and other agencies within Department of Health and Human Services (DHHS), but state and local public health departments, healthcare providers, laboratories, health care standards organizations, health care product vendors, and healthcare professional services organizations.
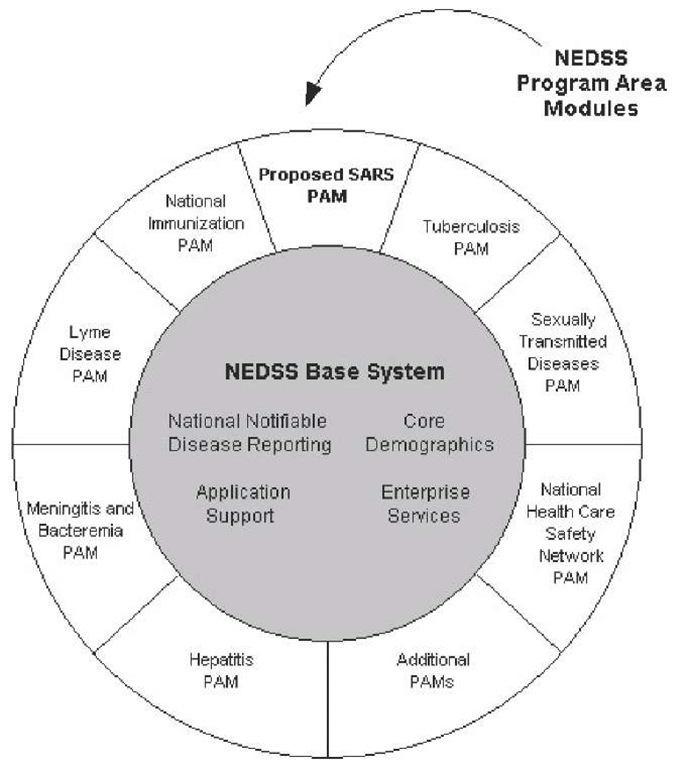
The NEDSS Base System (NBS) is an instance of the NEDSS standards for use by all stakeholders that enable systems from different CDC program areas to be integrated. Disease-specific data and processes are incorporated and integrated within the NBS using Program Area Modules (PAM). Though this modular approach allows for the sharing of these data and processes, the NEDSS standards do not provide specific guidelines to support the development of these modules. Giventhat “GIS provides an excellent means of collecting and managing epidemiological surveillance and programmatic information, GIS represents an entry point for integrating disease-specific surveillance approaches” (World Health Organization, 2001, p. 7). An Information System Design Theory (ISDT) approach for the development of GIS-based PAMs would provide a useful guide for the various stakeholders in the NEDSS. This approach is detailed in the following section.
Problem
Severe acute respiratory syndrome (SARS) has emerged as a serious international occupational health disease. Since the disease was first reported it has infected numerous health care workers, some fatally (Centers for Disease Control and Prevention, 2003). Consequently, early identification of SARS cases is critical, as no specific treatment protocol exists. As a result, a GIS-based PAM for SARS is needed that could be used to manage the health care services required to combat this disease.
Unfortunately, current GIS-based attempts to mitigate the spread of this disease are lacking in respect to the NEDSS; that is, they lack an integrated, standards-based approach to public health surveillance and information dissemination4. The objective of this case study is to propose an ISDT such that organizations meeting the requirements of this theory will, by design, develop a GIS-based PAM compliant with NEDSS standards. Geographic information science has the potential to create rich information databases, linked to methods of spatial analysis, to determine relationships between geographical patterns of disease distribution and social and physical environmental conditions. As the core of a decision support system, geographic information science also has the potential to change the way that allocations of resources are made to facilitate preventive health services and to control the burden of disease (Rushton, Elmes, & McMaster, 2000).
Information System Design Theory Approach
While the overriding methodology in this topic is the use of case studies, the case in this section is specifically concerned with the design of GIS as systems. As such, this analysis is informed by concepts deriving from a “design” approach to information systems. As noted in the ISDT approach introduced by Walls et al. (1992), the design process is analogous to the scientific method where hypotheses are to be tested by designing and building the artifact or product. They outlined several characteristics of design theories:
• Design theories are composite theories that encompass kernel theories from natural science, social science, and mathematics.
• While explanatory theories tell “what is,” predictive theories tell “what will be,” and normative theories tell “what should be,” design theories tell “how to/because.”
• Design theories show how explanatory, predictive, or normative theories can be put to practical use.
• Design theories are theories of procedural rationality. “The objective of the design theory is to prescribe both the properties an artifact should have if it is to achieve certain goals and the method(s) of artifact construction” (p. 41). Thus, the artifact must have all the characteristics identified in the design theory.
This case study explicitly draws upon their structure for creating a design product and process. Briefly, their first component of the design product involves a set of meta-requirements that describes the class of goals to which the theory applies. Their second component is a meta-design, which describes a class of artifacts hypothesized to meet the meta-requirements. Their third component is a set of kernel theories, theories from natural or social sciences governing design requirements.
Their final component of the design product is a set of testable design product hypotheses that are used to test whether the meta-design satisfies the meta-requirements.
Beyond the design product, designers of GIS would necessarily need to be concerned with principles of the design process. According to the ISDT, the first component of the design process involves a design method which describes the procedures to be used in artifact construction (Walls, Widmeyer, & El Sawy, 1992). The second component is kernel theories, theories from natural or social sciences governing design process. The last component of the design process is the testable design process hypotheses, which are used to verify whether the design method results in an artifact that is consistent with the meta-design. While ISDT is explicitly applied in this third case study, the theme of effective design holds for all: that is, there is a design need to create GIS system designs in a manner that effectively contributes to the design goal of improving human heath.
Solution
The NEDSS has identified a number of enabling technologies for each element of the NEDSS technical architecture. One of these architectural elements is Analysis, Visualization, and Reporting (AVR). AVR capabilities support the epide-miological analysis of public health data and the communication of the analytical results of that analysis (U.S. Department of Health and Human Services, 2001). The specific requirements for this architectural element include tabular and graphical reporting, statistical analysis, and geographical information analysis and display. Also included are features such as the creation of pre-defined and ad-hoc reports, the ability to share results with colleagues and the public, and the extraction of data for use with standard analysis tools. The AVR Requirements are the foundation of the GIS Meta-Requirements as well as each of the specific GIS Meta-Design elements outlined in Table 1.
The Meta-Requirements and Meta-Design are derived from the Open GIS Service Architecture (Open GIS Consortium Inc., 2002). Taken as a whole, these design elements would constitute the foundation of an ISDT for GIS-based PAMs.
Outcome
As seen in this case, ” GIS offers new and expanding opportunities for epidemiology as they allow the informed user to choose among options when geographic distributions are part of the problem, and when used for analysis and decision-making, they become a tool with a rich potential for public health and epidemiology” (Clarke, McLafferty, & Tempalski, 1996, p. 1). GIS-based PAMs developed using the proposed ISDT would allow the sharing of common data and processes while incorporating disease-specific data and processes. As seen in Figure 12, a SARS-specific PAM developed in this manner would become one of many PAMs and part of the larger NBS.
Table 1. ISDT for GIS-based PAMs
|
AVR Requirements |
GIS Meta-Requirements |
GIS Meta-Design |
|
Geographical information analysis and display Tabular reporting Graphical reporting |
Geographic human interaction services |
Geographic spreadsheet viewer: Client service that allows a user to interact with multiple data objects and to request calculations similar to an arithmetic spreadsheet but extended to geographic data. Geographic viewer: Client service that allows a user to view one or more feature collections or coverages. This viewer allows a user to interact with map data, e.g., displaying, overlaying and querying. |
|
Creation of predefined and ad-hoc reports |
Geographic model/information management services |
Product access service: Service that provides access to and management of a geographic product store. A product can be a predefined feature collection and metadata with known boundaries and content, corresponding to a paper map or report. A product can alternately be a previously defined set of coverages with associated metadata. |
|
Extraction of data for use with standard analysis tools |
Geographic processing services – spatial |
Subsetting service: Service that extracts data from an input in a continuous spatial region either by geographic location or by grid coordinates. Sampling service: Service that extracts data from an input using a consistent sampling scheme either by geographic location or by grid coordinates. |
|
Subsetting service. Service that extracts data from an input based on parameter values. |
||
|
Extraction of data for use with standard analysis tools |
Geographic processing services – thematic |
Geographic information extraction services: Services supporting the extraction of feature and terrain information from remotely sensed and scanned images. Image processing service: Service to change the values of thematic attributes of an image using a mathematical function. Example functions include: convolution, data compression, feature extraction, frequency filters, geometric operations, non-linear filters, and spatial filters. |
|
Extraction of data for use with standard analysis tools |
Geographic processing services – temporal |
Subsetting service. Service that extracts data from an input in a continuous interval based on temporal position values. Sampling service. Service that extracts data from an input using a consistent sampling scheme based on temporal position values. |
|
Statistical analysis |
Geographic processing services – metadata |
Statistical calculation service: Service to calculate the statistics of a data set, e.g., mean, median, mode, and standard deviation; histogram statistics and histogram calculation; minimum and maximum of an image; multi-band cross correlation matrix; spectral statistics; spatial statistics; other statistical calculations. |
|
Sharing of results with colleagues and the public |
Geographic communication services |
Transfer service: Service that provides implementation of one or more transfer protocols, which allows data transfer between distributed information systems over off-line or online communication media. |
CASE STUDY SUMMARY ANALYSIS AND MANAGEMENT IMPLICATIONS
A summary of the three case studies is presented in Table 2. Each of the three cases presented is based on the health care service provided, specific problem type, solution generated, and final outcome.
As discussed in the introduction, the visual display of spatial information in healthcare, starting with epidemiology, has a long history. The literature reveals, as do these case studies, that the role of the private sector becomes increasingly more important as you move from the strategic planning level down to the management and operational levels. For those charged with the management of organizations, the following issues should be considered:
• Data Integration for Operational Control: Geospatial location is considered a valuable organizing principle for architecting and constructing enterprise data stores where interoperable geospatial technologies play a foundational role in exploiting these data stores for enterprise missions (Open GIS Consortium Inc., 2003). As seen in the first case, this can occur at even the most basic level where demand from users at the operational level prompted the linkage of spatial and non-spatial data. As a consequence, the linkage of spatial and non-spatial databases will be among the challenges that organizations face as the spread of GIS applications and their extended functionalities drive organizations to integrate their existing structures with the increasingly important spatial dimension.
Figure 12. Conceptual picture of the NEDSS base system and program area modules
• Planning Interorganizational Systems for Management Control: Managing ad hoc inter-organizational networks are the nature of GIS data in health care environment. Emergency management applications are being developed in numerous areas around the country, ranging from instances where GIS-based emergency planning has been carried out by local governments, to cases where the Federal Emergency Management Agency has supported the creation and implementation of a GIS for this purpose (O’Looney, 2000). However, these diverse organizations collect spatial data for different purposes and goals. For successful planning, spatial data must be organized in such a manner as to appear as residing in one central database. Thus, the issue becomes how to successfully manage the relationship between these loosely coupled organizations that have dependence on tightly coupled systems without compromising their organizational purposes and goals.
• Design Research for Strategic Planning: The global implication of geographic data, as seen recently with SARS, indicates that it is no longer confined to the local or national level. Unfortunately, global geographic information is currently little more than the sum of the highly varied national parts and is not readily available (Longley, Goodchild, Maguire, & Rhind, 2001). The Global Spatial Data Infrastructure Association was formed to address this issue and is dedicated to international cooperation and collaboration in support of local, national, and international spatial data infrastructure developments to allow nations to better address social, economic, and environmental issues of pressing importance (The Global Spatial Data Infrastructure Association, 2003). Their vision for a Global Spatial Data Infrastructure would support ready access to global geographic information. This vision would be achieved through the coordinated actions of nations and organizations through the implementation of complementary policies and common standards for the development and availability of interoperable digital geographic data and technologies to support decision-making at all scales for multiple purposes. The research challenge then is learning how to create a robust information system design process that considers spatial dimensions from global level international standard bodies to local level implementing organizations.
Table 2. Summary of case studies
|
Case Study |
Health Care Service Provided |
Problem |
Solution |
Outcome |
|
Operational Control (Practice) |
Disability Evaluation |
Accuracy and time to schedule appointment location and date |
Internet-based GIS application for use within company Extranet |
Improved decision making and reduction in time required for scheduling physician appointments |
|
Management Planning (Control) |
Emergency Medical Service Delivery |
Need for Ready EMS Delivery |
Use GIS to provide efficient planning and management of E-911 health emergencies |
Reduced EMS delay time and more rapid onset of trauma service delivery |
|
Strategic Planning (Research) |
Disease Surveillance System |
Lack of Spatial Data Integration and Dissemination |
Devise Inter-organizational Spatial Database for early disease detection |
Program Area Module Design Theory for GIS |
DISCUSSION
IS, and spatial analysis more broadly, can inform a number of pressing health care service issues, both domestically and internationally. From a domestic perspective this includes issues such as treating highly distributed populations and efficiently targeting critical services. From an international perspective, this includes developing a rapid means to detect and treat human health outbreaks in developed and developing regions as well as the creation of spatial datasets to drive international health enterprises.
Toward a Spatial Decision Support System (SDSS) for Human Health
While the geographic dimension of human health has long been recognized, the integration of GIS into the health care industry has not received the level of attention as that of more cutting-edge medical technologies. Nonetheless, as revealed in these cases as well as others that are increasingly appearing in the literature (Lang, 2000), GIS can provide a useful tool at the operational, management, and strategic levels of health care resources. For this reason, researchers such as Cromley & McLafferty (2002) have begun advocating for Spatial Decision Support Systems (SDDS) in support of health care services. Furthermore, a fairly long history of decision support systems in health care has been recognized (Shortliffe & Perrault, 2001). The new view is to integrate the spatial element into these systems. It is hoped that this topic provides yet another indicator of the value in using spatial analysis for health care delivery.
