ABSTRACT
Polymer Nanocomposites (PNC) are a fascinating category of material systems, in which nanoscopic fillers are found to induce remarkable improvements in the properties of the polymeric matrix. [1] This improvement is often determined by the interfacial energetic interactions which dictate the matrix chain mobility, filler dispersion, and distribution. The PNC community has widely studied the glass transition temperature (Tg) with emphasis laid primarily on the effects of confinement on the matrix polymer. [2, 3, 4] Dispersion/flocculation has also received attention in the elastomeric nanocomposite community in relation to the wetting behavior of fillers. [5] A consolidated view of both these phenomena is yet to be presented in terms of the interfacial energetics. In this study we investigate bare or short chain silane modified filler systems, in which enthalpic effects dominate. This is a first step towards understanding the effect of surface energetics on the thermomechanical properties of PNCs, such as the Tg and viscoelasticity. We subsequently seek to develop a predictive model for the same invoking an informatics based approach [6], which employs Materials Quantitative Structure-Property Relationships (MQSPR) coupled with a Finite Element Method, to link disparate length scales, reducing the need for detailed calculations.
It was noted by Wang [7] that the thermodynamic driving force for flocculation is determined by the relative attraction of filler to filler ((Wc(FF))) and polymer to polymer (Wc(PP)) over the attraction of filler to polymer ((Wa(FP)) expressed as a nett work of adhesion AWa. The larger the value of AWa the worse the flocculation. This very same rationale may be used in explaining equilibrium morphologies in nanocomposites.
On the other hand we hypothesize that the polymer mobility in the interphase, is dictated by the work of spreading (Ws) which is the difference between the work of adhesion ( Wa (FP)) of the polymer to particle and the work of cohesion of the polymer to itself (Wc (PP)). It however does not depend on the attraction between particles. The more positive the value of Ws (= Wa (FP)- Wc (PP)) the larger the decrease in the mobility of the polymer and therefore more positive the Tg change. This suggests that for every polymeric matrix, there exists a threshold surface energy of the filler below which Ws is negative (Tg decreases) and above which Ws is positive (Tg increases).
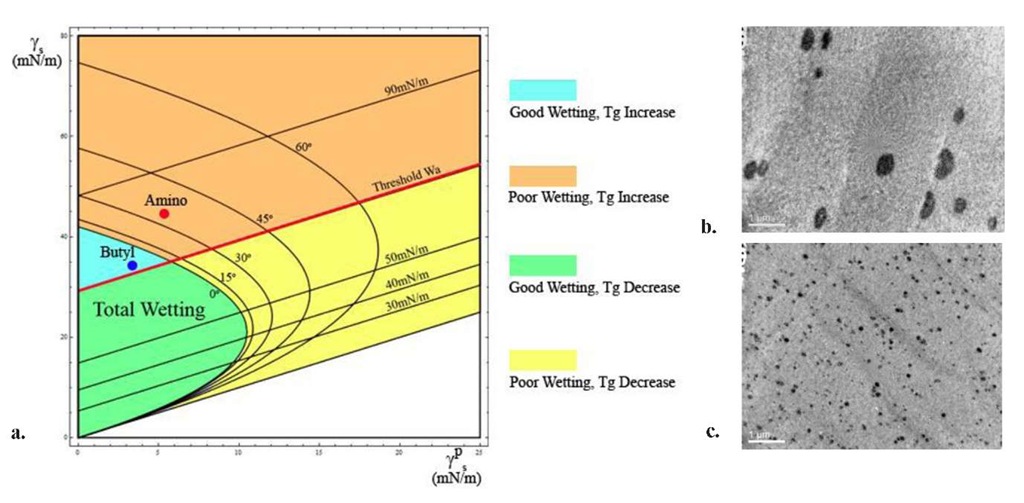
Fig.1a The schematic represents a wettability-adhesion map for Polystyrene. The X and Y axes represent the polar component and the total surface energy of the filler respectively. The curved lines represent iso-contact angle lines of the wetting species (filler) on the wetted polymer. The straight lines represent the iso-work of adhesion lines of polymer and particle 1b TEM Micrograph of 3% Loading of 3-Aminopropyldimethylethoxysilane modified particles in Monodisperse PS 190,000g/mol (AWa=11.8 mN/m) 1c TEM Micrograph of 3% Loading of n-Butyldimethylmethoxysilane modified particles in Monodisperse PS 190,000g/mol (AWa=8.64 mN/m). Scale bars represent 1|am
Note in Fig.1a,b,c that the larger the contact angle the poorer the wetting i.e. the poorer the dispersion. Also, the higher the Wa line, the larger the attraction of particle to polymer and therefore the more positive the change in Tg for the same dispersion state. This implies that beyond a threshold work of adhesion line the Tg always increases. Since the wetting behavior above this line may be good or bad it is possible to have poor dispersions with an increase in Tg. Likewise systems may display excellent dispersions with Tg drops, below the threshold line. The four colored regions in the graph represent all possible scenarios. It must be noted that for the same Ws, the system with a better dispersion will show a larger Tg change as the surface area to volume ratio is larger.
In order to confirm the aforementioned hypothesis, polymer nanocomposites with three different matrices having surface energies ranging from polar to non polar ( Poly(2-VinylPyridine), Polymethylmethacrylate and Polystyrene), filled with colloidal silica nanoparticles surface modified with four different monofunctional silanes of surface energies again varying from polar to nonpolar (amino, butyl, octadecyl, heptafluoro), are being studied. 14±4nm Colloidal Silica particles from Nissan Chemicals are functionalized by refluxing with the silanes in an anhydrous inert environment at 75°C, overnight. The PNC samples are made by solution mixing of particles and polymer and casting the mixture. The surface energies are characterized quantitatively by static contact angle measurements on silane modified silica surfaces [8] and spin coated polymer thin films using the method outlined by van Oss et al [9]. The change in time dependent behavior is monitored by subjecting annealed samples to quantitative dynamic mechanical analysis and by measuring the glass transition temperature independently using modulated differential scanning calorimetry. The degree of nanoparticle clustering is quantified using TEM micrographs and correlated with the interface enthalpy as in Fig .1. We then invoke a finite element model of a 2D representative volume element of the PNC that includes the degree of clustering (related to the AWa) and a gradient of polymer mobility in the interaction zone (related to Ws). Through a comparison to experiment, the parameters used in the FEM model are correlated to the interface enthalpy. MQSPR is then employed to establish quantitative relationships between chemical properties and molecular structure represented by a set of descriptors, which capture the effects of filler functionality. This novel technique combines statistical models of the nanoscopic interactions between polymer molecules and particles, FEM and experimental data for the prediction of PNC thermomechanical properties to enable high throughput materials design.

