Results and discussion
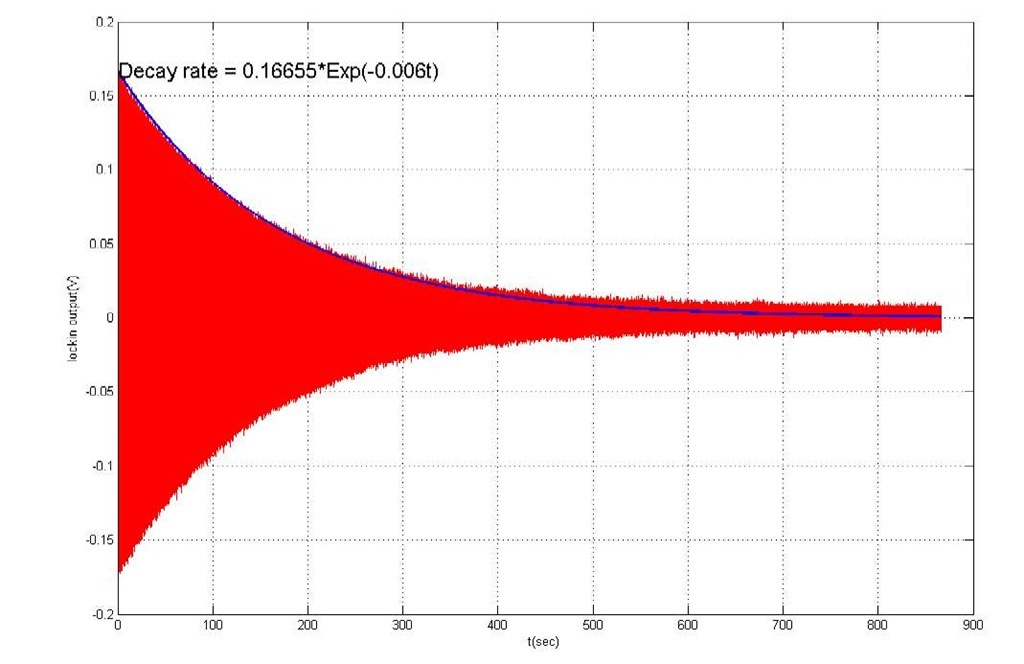
The internal friction of film energy loss can be measured from the dynamic response of the paddle structure provided while testing it in high vacuum (10A-6 torr). In the absence of the air damping effects, measuring the resonant response from forced vibrations can thus reveal the dynamic inelastic behavior of materials. During the experiment, a step voltage is applied to the bottom deflection electrode, and the samples elastic decay behavior of the materials is observed. We verified that the paddle returns to its initial position by observing free damping when the electrostatic force was abruptly removed, and the amplitude of the damping response decays with time. It was using an applied step voltage on the deflection electrode and then the elastic aftereffect behavior was observed. We observed the paddle sample returns to its initial position with free damping when the electrostatic force was suddenly removed from the paddle sample and the amplitude of the damping response was decay with time. Figure 6 shows the results of the damping behavior for the paddle sample tested in the vacuum (1.6E-6 torr).
Internal friction, 5, is defined as the ratio of the energy dissipated per cycle and the maximum elastic energy stored in one cycle. The dissipation of elastic energy in a vibrating sample caused by stress induced defect motion is rate-limited by a kinetic process. Usually, internal friction of vibrating samples can be determined from the rate of decay of the amplitude. From the frequency and free decay data, we can calculate the internal friction from a simply equation:
where y(t) is the vibration amplitude, yo is the initial amplitude, n is the decrement of damping, 5 is the internal friction parameter, fo is the damping frequency.
Figure 6 -the damping behavior for the paddle sample tested in the vacuum (1.6E-6 torr).
Moreover, the resonance-frequency excitation test can be used to find the decay rate of the sample as the consequence of the internal friction. We excite the paddle at its resonance frequency, and abruptly change the paddle excitation, from its stable state and observe its response until the paddle again achieves an equilibrium. The decay rate could be found and the loss angle could be calculated using Equation derived from [2, 3]
Here, An represents the amplitude of the n cycles after removal of the excitation and An+i is just n+1 cycles. 5 is the natural logarithm of amplitude in two successive vibration cycles. Equation above describes to the internal friction with the loss angle, 0, in terms of 5 and k. In addition, a sweep frequency excitation from the bottom deflection electrode can also show the response due to sweep frequency excitation versus time. Using Fast Fourier Transform (FFT) conversion of the time domain into the frequency domain produced the FFT power spectrum gives us several peaks representing the paddles resonant frequency occurred. We can thus evaluate the energy loss contribution to the resonant frequency by repeating the sweep frequency experiment at different nanocrystalline film structures and conditions. Following equation shows that the loss angle 0, which is obtainable directly from the width of the resonant peak at half-maximum height in the FFT power spectrum:
The (a>2-ffli) term is the full width at half-maximum height, and <ar is the resonant frequency. Using this measurement, the point defect relaxation, dislocation relaxation, grain boundary interface relaxation, thermoelastic relaxation, phase transformation, dislocation motion of the film, if any, can be observed from the resonant frequency and drive amplitude (loss mechanism) in each tested cycle. Thus allow us to measure mechanical behavior of the sample with respected to load, time, temperature, resonant frequency, drive amplitude and microstructure.
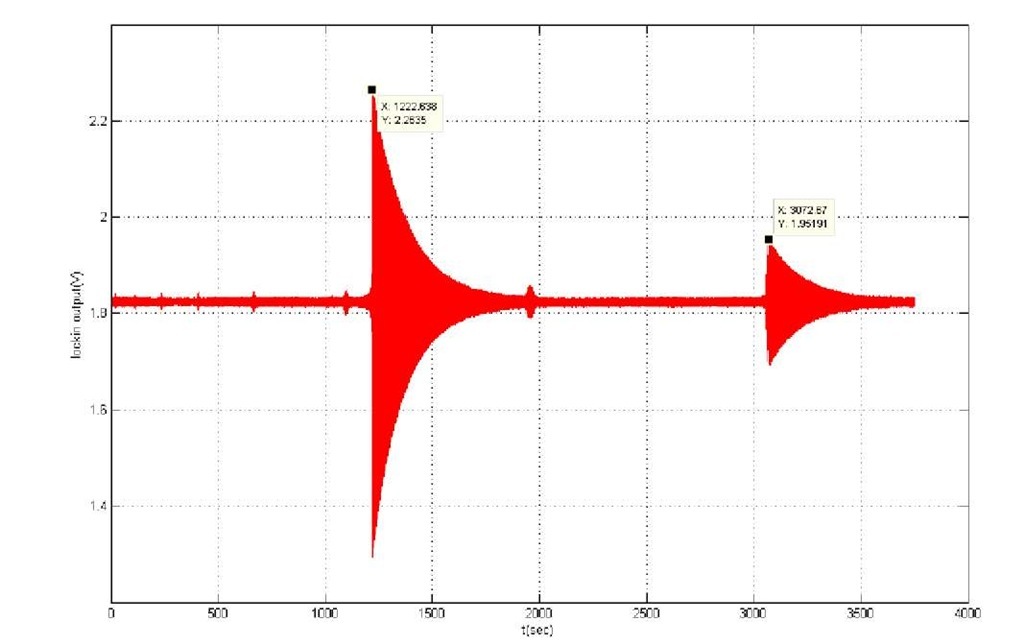
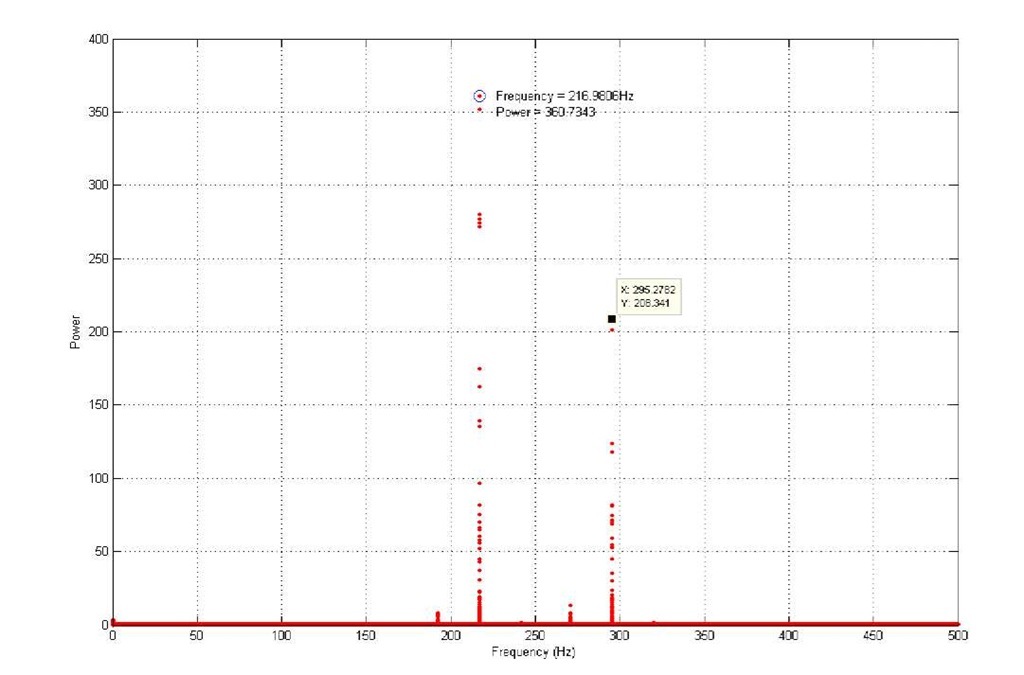
Figure 7 show the results of the damping behavior for the paddle sample. This resonance experiment was use the sine wave on the deflection electrode and the frequency was sweep from 50Hz to 350Hz, sweep rate was 16 stepping per second and increasing 0.005Hz per step, the integration time of lockin amplifier is 300us. In figure 7, we can clearly obtain the there are two larger response at 1222.638 seconds (max) and 3072.67 seconds (2nd) respectively. The second response we have never seen in former measure results that using the low conductance paddle sample with a thin metal layer because of narrower frequency range (50-150Hz). We calculated the frequency of excitation the maximum response to be 147.81Hz, and the second response is 296.05Hz. Figs 8 shows the FFT spectrum tested in Figure 7. In frequency spectrum also show two larger peaks and the maximum one is stand on 216.97Hz, second peak is on 295.27Hz.
Figure 7- the results of the resonance damping behavior for the paddle sample.
Figure 8 – the FFT spectrum for the tested in figure 7
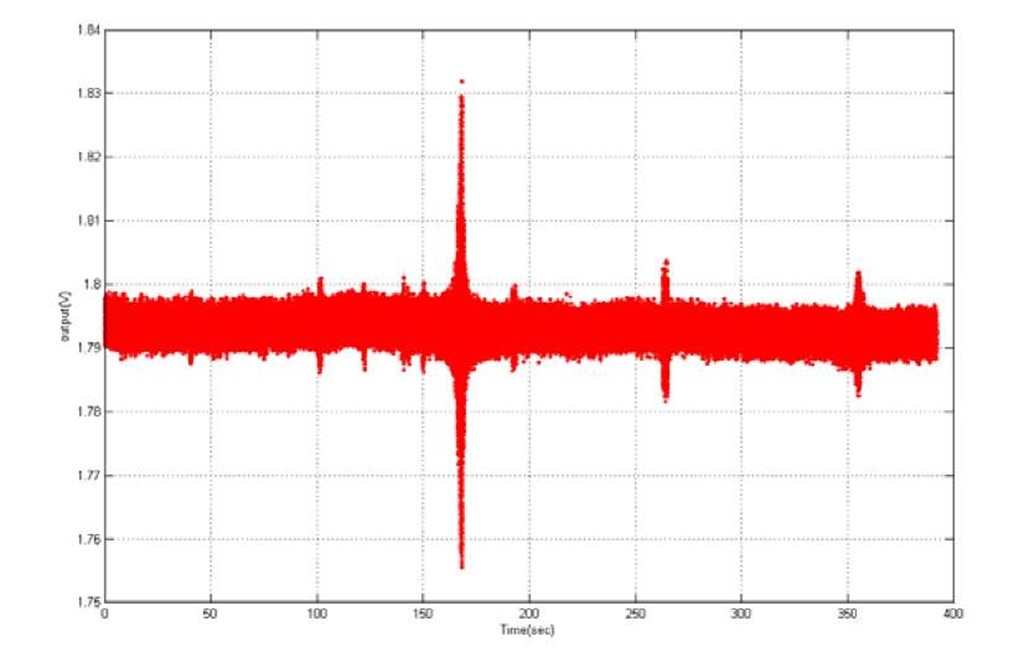
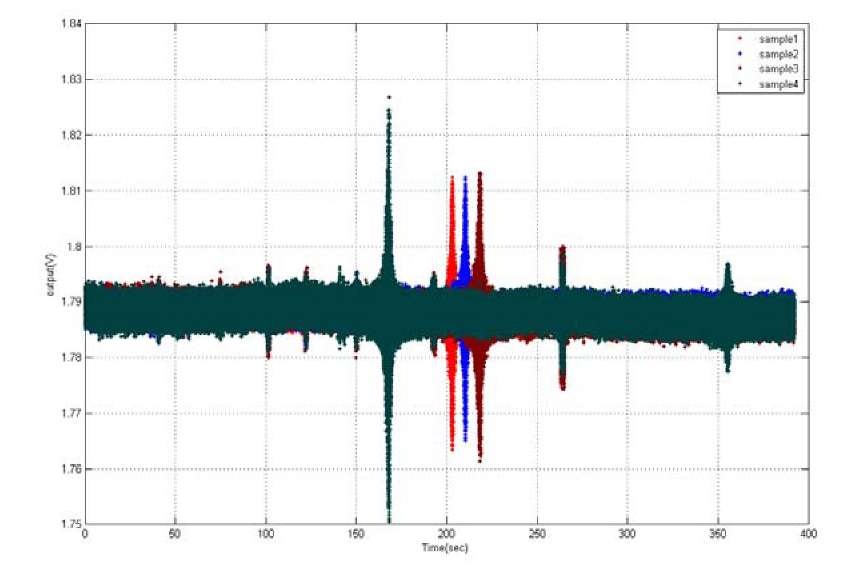
Figure 9 shows the frequency scan of the tested paddle sample with 500nm Al film deposited on top. This result shows the shift comparison of resonance frequency triggered by the electrostatic force. Fig. 10 shows the frequency scan of the tested paddle sample with four different thickness of Al film deposited on top.
Figure 9. The frequency scan for the tested paddle sample with 500nm Al film deposited on top.
Figure 10. The resonant frequencies scan using sweep frequency for four different samples.
These results show the measurement system used here can accurately measures the loss mechanism of thin film using dynamic response which give potential to study the grain boundary motion and dislocation motion in the film.
Conclusion
A technique developed for studying the energy loss behavior of submicron to nanometer scale thin metal films on substrate is presented. The anelastic behavior and internal friction of 200~500 nm Al thin film were studied using the dynamic frequency response of the paddle structure generated by electrostatic force under vacuum pressure. The result show the measurement system used here can accurately measures the loss mechanism of thin film using dynamic response which give potential to study the grain boundary motion and dislocation motion in the nano-scale thin films.

