Results
Cross-sectional study
Factor analysis
A factor analysis revealed components describing almost independent spine shape characters determined by video raster stereography parameters, with respect to the interdependency of theses parameters. Different models for the controls (CON) and for the low back pain patients (LBP) indicated low back pain markers (tab. 3).
Trunk inclination (Tr-Inc), trunk imbalance (Tr-Imb), pelvis tilt (P-Tilt), pelvis torsion (P-Tors), thoracic kyphosis angle (KA-max), lumbar lordosis angle (LA-max), mean (root-mean-square) vertebral side deviation (Side-rms), and mean (root-mean-square) vertebral rotation (Rot-rms) served as variables (tab. 2).
|
Components (CON) n=192 |
Components (LBP) n=213 |
|||||||
|
|
1 |
2 |
3 |
4 |
1 |
2 |
3 |
4 |
|
Tr-Inc |
-0,673 |
-0,083 |
-0,033 |
0,156 |
-0,189 |
-0,099 |
0,045 |
0,756 |
|
Tr-Imb |
-0,031 |
0,065 |
0,046 |
0,946 |
-0,093 |
0,199 |
0,759 |
-0,067 |
|
P-Tilt |
0,088 |
0,029 |
0,829 |
-0,070 |
0,131 |
0,217 |
-0,047 |
0,700 |
|
P-Tors |
-0,148 |
-0,025 |
0,758 |
0,114 |
0,232 |
-0,138 |
0,702 |
0,068 |
|
KA-max |
0,721 |
-0,098 |
-0,055 |
0,318 |
0,798 |
-0,034 |
0,191 |
0,049 |
|
LA-max |
0,739 |
0,001 |
-0,055 |
-0,064 |
0,861 |
0,023 |
-0,067 |
-0,110 |
|
Rot-rms |
0,220 |
0,805 |
0,130 |
0,010 |
-0,036 |
0,768 |
0,210 |
0,167 |
|
Side-rms |
-0,199 |
0,806 |
-0,123 |
0,051 |
0,019 |
0,833 |
-0,118 |
-0,042 |
Table 3. Factor analysis – principle components extraction – for controls (CON: n=192) and low back pain patients (LBP: n=213) (factor loading coefficients over 0,65 printed in bold)
In the rotated component matrix, factor loading coefficients higher than 0,650 were enhanced to mark relevance (tab. 3). A factor analysis for the pain free controls revealed four components with an Eigen value greater than one, explaining 66% of the total variance. The table showed factor loading coefficients constituting independent factors for a summarizing description of human spinal alignment. Factors could be named as ‘sagittal spine shape’ (factor 1: LA-max 0,739 x KA-max 0,721 x Tr-Inc -0,673), ‘vertebral deviations’ (factor 2: Rot-rms 0,805 x Side-rms 0,806), ‘pelvis parameters’ (factor 3: P-Tilt 0,829 x P-Tors 0,758) and ‘trunk deviation’ (factor 4: Tr-Imb 0,946) (tab. 3). For low back pain patients, a component model of all four components explaining a total variance of 64,8 % could be revealed. In the first and most important component ‘sagittal spine shape’ the trunk inclination lost its influence (factor 1: LA-max 0,861 x KA-max 0,798). The second component ‘vertebral deviations’ did not differ from the controls (factor 2: Rot-rms 0,768 x Side-rms 0,833). Compared to the controls, there were some significant changes for the pelvis parameters. For low back pain patients, pelvis torsion was associated with trunk imbalance (factor 3: Tr-Imb 0,759 x P-Tors 0,702), and pelvis tilt was associated with trunk inclination (factor 4: Tr-Inc 0,756 x P-Tilt 0,700). So, the pelvis parameters were influencing the upper body position in the frontal and sagittal plane in back pain patients (tab. 3).
Summarizing the factor analyses, there were four independent components to describe spinal alignment for pain free persons: ‘sagittal spine shape’, ‘vertebral deviations’, ‘pelvis parameters’, and ‘trunk deviation’. Low back pain was indicated by changes of the evidence of pelvis parameters compared to pain free controls. They were no longer an independent component, but were influencing the upper body position or deviation in low back pain patients.
Discriminant analysis
Discriminant analyses for male and female patients and controls included all spine shape parameters used before for the factor analysis.
For males, there was a relatively poor canonical correlation (eta2 = 0,399), but the discriminant function led to a high significant solution for a group separation (Chi2 = 32,810; p < 0,001; Wilks’ Lambda = 0,841). For the males, there was a correctly predicted group membership of 70% using the discriminant function, 72% for the controls and 68% for the low back patients, respectively. Trunk imbalance offered the best capability to separate groups by means of the canonical discriminant function coefficients (Tr-Imb: 0,743) for males (tab. 4).
|
Canonical discriminant coefficients |
||
|
males (n=197) |
females (n=208) |
|
|
Tr-Inc |
0,336 |
0,610 |
|
Tr-Imb |
0,743 |
0,441 |
|
P-Tilt |
0,157 |
0,006 |
|
P-Tors |
0,066 |
0,470 |
|
KA-max |
-0,146 |
-0,183 |
|
LA-max |
-0,350 |
0,105 |
|
Rot-rms |
-0,342 |
-0,374 |
|
Side-rms |
0,067 |
0,340 |
Table 4. Canonical discriminant coefficients for males (controls n=113 and low back pain patients n=84) and females (controls n=79 and low back pain patients n=129) (relevant coefficients printed in bold)
For females, the canonical correlation was a little higher (eta2 = 0,448; Wilks’ Lambda = 0,799) than for males, and the discriminant function also led to a high significant solution for a group separation (Chi2 = 44,570; p < 0,001). The prediction of correct group membership showed a ratio of 69%, 74% for the controls and 65% for the female low back patients, respectively. Trunk inclination and a little less trunk imbalance and pelvis torsion offered the best capability to separate groups by means of the canonical discriminant function coefficients for females (tab. 4).
Summarizing the results of the discriminant analyses, we found poor but acceptable discriminating functions for males and females, where group membership (LBP vs. CON) could be predicted correctly for approximately 70 % of all cases. Trunk imbalance in males and trunk imbalance with trunk inclination and pelvis torsion in females were the most appropriate spine shape variables to separate groups using a multivariate discriminant analysis function.
Evaluating both factor analysis and discriminant analysis, there were video raster stereography spine shape parameters that could be established to be associated with low back pain: trunk inclination and trunk imbalance with pelvis parameters mainly found in females, trunk inclination with trunk imbalance and the lumbar lordosis angle mainly found in males. Univariate analyses confirmed these multivariate findings.
Univariate analysis
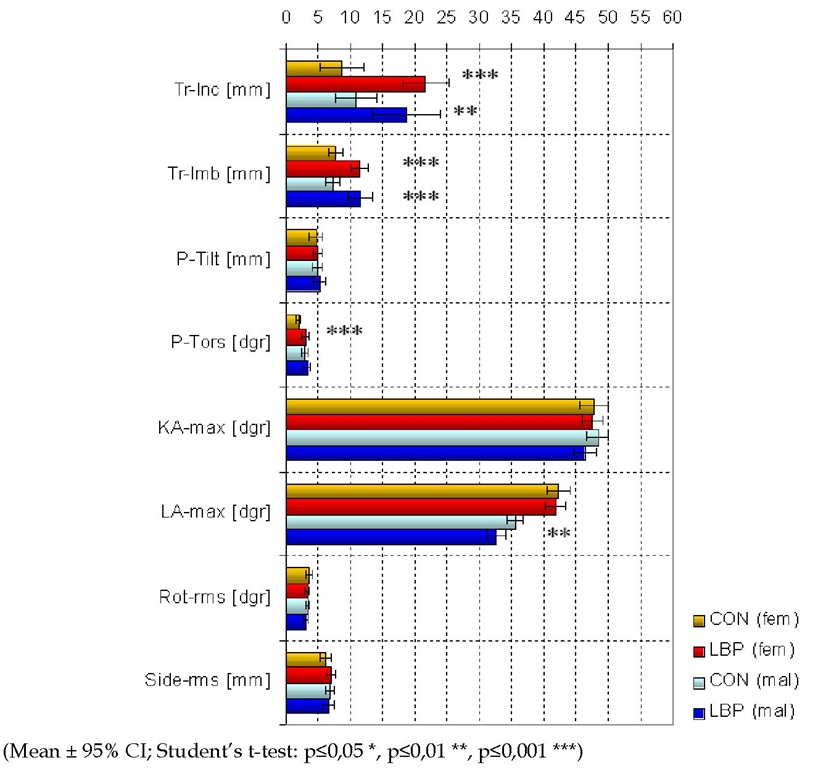
Univariate comparisons revealed statistically significant mean differences between low back pain patients and controls for both men and women in their video raster stereography spinal alignment (tab. 5), illustrated as spine shape profiles (fig. 4).
|
Tr-Inc [mm] |
Tr-Imb [mm] |
P-Tilt [mm] |
P-Tors [dgr] |
KA-max [dgr] |
LA-max [dgr] |
Rot-rms [dgr] |
Side-rms [mm] |
|
|
CON females ± SD |
8,6 15,1 |
7,8 5,3 |
4,7 4,9 |
2,0 1,5 |
47,8 9,7 |
42,2 8,3 |
3.7 1.8 |
6,1 4,0 |
|
LBP females |
21 6 *** |
11 3 *** |
4,9 |
3 1 *** |
47,5 |
41,7 |
3,4 |
7,1 |
|
± SD |
20,1 |
7,7 |
4,0 |
2,8 |
9,3 |
9,0 |
1,9 |
3,7 |
|
CON males |
10,9 |
7,2 |
4,9 |
3,0 |
48,4 |
35,6 |
3,4 |
6,8 |
|
± SD |
16,8 |
6,2 |
3,8 |
2,4 |
9,0 |
6,5 |
1,6 |
3,6 |
|
LBP males |
18,7 * |
11 6 *** |
5,3 |
3,4 |
46,4 |
32,6 ** |
3,1 |
6,6 |
|
± SD |
24,2 |
8,1 |
4,2 |
2,5 |
8,1 |
6,8 |
1,7 |
4,2 |
Table 5. Spine shape parameters for female and male controls vs. low back pain patients (Student’s t-test: p<0,05 *, p<0,01 **, p<0,001 ***)
Fig. 4. Video raster stereography spine shape profiles for males (light and dark blue: CON n=113 and LBP n=84) and females (light and dark red: CON n=79 and LBP n=129)
First of all, trunk inclination (Tr-Inc) (females’ mean difference: 13,0 mm; t=-4,959; p<0,001; males’ mean difference: 7,8 mm; t=-2,534; p=0,012) and trunk imbalance (Tr-Imb) (females’ mean difference: 3,6 mm; t=-3,993; p<0,001; males’ mean difference: 4,4 mm; t=-4,211; p<0,001) differed significantly between low back pain patients and pain free controls. As for women, there was a significant difference in the parameter pelvis torsion (P-Tors) (mean difference: 1,2°; t=-3,811; p<0,001), and for men in the parameter maximum lumbar lordosis angle (LA-max) (mean difference: 3,1°; t=3,204; p=0,002), respectively (tab. 5).
Effect analysis
The effect analysis dealt with changes in low back pain, trunk muscle function, and spinal alignment following a ten-week exercise program, where adaptations were assigned to a process called reconditioning. Effects were analysed using a three-way ANOVA to verify within-subjects effects and interactions with independent factors, like gender and age.
Parameters of low back pain reconditioning
Development of pain state (CR10) and trunk muscle peak forces following the exercise program were described as mean and standard deviation, and the within-subjects effect showed at least very significant increases of peak forces, and a decrease of pain, respectively. Trunk muscle torque was expressed as corresponding masses in kilogram for more transparency (tab. 6).
As for the low back pain state, there were neither significant differences between males and females (F=0,371; p=0,544) nor between younger and older patients (F=0,647; p=0,423) (between subjects factors), and there were no interactions for gender (F=2,910; p=0,091) or age (F=0,941; p=0,334) with the treatment effect, which in itself was very significant (F=60,603; p<0,001) (within-subject factor) (tab. 6).
Table 6. Pain (CR10 points) and trunk muscle peak forces for back extension (Ext), trunk flexion (Flex), lateral flexion to the right (Lat-rt) and to the left (Lat-lt), as well as axial rotation to the right (Rot-rt) and to the left (Rot-lt) before (t1) and after (t2) the exercise program for the total (n=107) of low back pain patients (within-subjects effect: p<0,05 *, p<0,01 **, p<0,001 ***)
Of course, trunk muscle peak forces differed between males and females (extension: F=42,351; p<0,001; flexion: F=23,482; p<0,001; lateral-left: F=44,251; p<0,001; lateral-right: F=33,686; p<0,001; rotation-left: F=40,841; p<0,001; rotation-right: F=47,507; p<0,001), and also between younger and older patients (extension: F=7,745; p=0,006; flexion: F=21,945; p<0,001; lateral-left: F=20,271; p<0,001; lateral-right: F=6,923; p=0,010; rotation-left: F=7,821; p=0,006; rotation-right: F=4,441; p=0,038), but there were no significant interactions at all between grouping variables and the within-subjects factor (p>0,05), while the treatment effect itself was very significant in any dimension (extension: F=30,563; p<0,001; flexion: F=16,969; p<0,001; lateral-left: F=16,727; p<0,001; lateral-right: F=9,280; p=0,003; rotation-left: F=17,515; p<0,001; rotation-right: F=23,462; p<0,001) (tab. 6).
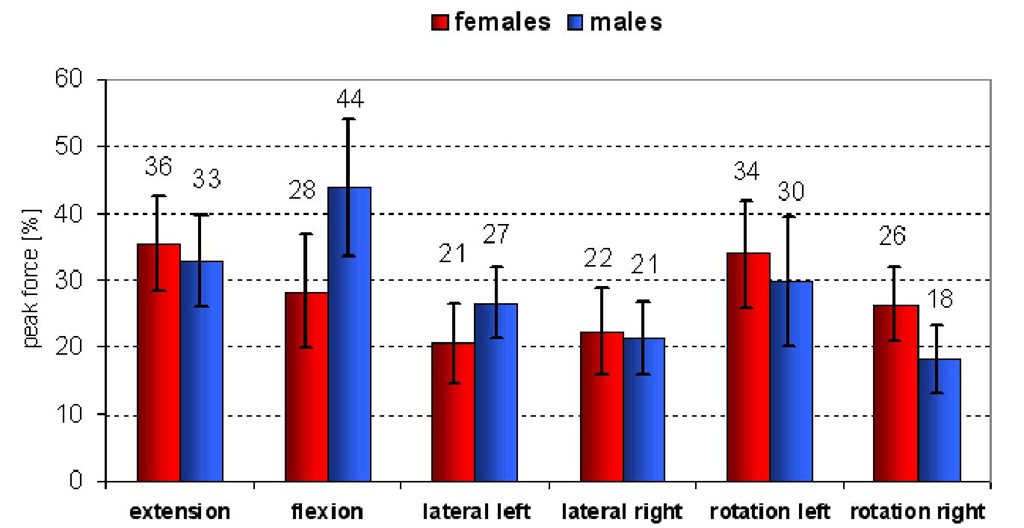
With respect to references in the field of low back pain research, relative peak force increases were illustrated for both males and females separately (fig. 5). Relative increases ranged between approximately 20% to about 40%. Increases were higher in the back extension (approx. 35%) and trunk flexion (from about 30 to 45%) than in the lateral flexion (approx. 25%) and the axial rotation (from about 20 to 30%) (fig. 5).
Fig. 5. Relative increases of trunk muscle peak forces for males (n=46) and females (n=61) (Mean±SEM)
Investigating the relation between clinical out-come and muscle function, multiple regression models for the estimation of low back pain decreases by means of relative peak force increases led to a multiple regression coefficient of R=0,292 (R2=9%). The only predictor showing a tendency for a significant contribution to explain pain decrease was the relative increase of trunk flexion (P=0,216; p=0,055).


