Introduction
Vertebral osteophyte formation is a well-documented phenomenon that is associated with degeneration and altered mechanics of the spine, both of which have been considered to be the result of aging, a purely physiologic response to load bearing, or intrinsic spinal disease as etiologic factors. (Lane et al., 1993, O’Neill et al., 1999) They are recognized radiologically as hyperostosis at the region of the attachment of the annular fibers to the vertebral body and localized increases in bone mineral density. (Nathan et al., 1994) As the etiologic factors, the compressive forces on the vertebral endplates (Nathan et al., 1962), bone mineral density (Kinoshita et al., 1998), obesity (O’Neill et al., 1999) and genetic factors (Sambrook et al., 1999) have been reported as causes, although the absence of a single definitive factor causing spinal degeneration has led to a suggestion that several factors including both genetic and nongenetic ones contribute to the development of osteophyte formation. (Harada et al., 1998, Liu et al., 1997)
On the other hand, low back pain (LBP) is one of the most common musculoskeletal disorders of the elderly, of which risk factor seems to be related to lumbar disc degeneration. (van Tulder et al., 1997) While data from many studies suggest an association with lumbar disc degeneration and LBP (Lawrence, 1969, Simmons et al., 1991, Jayson, 1994), asymptomatic lumbar disc degeneration is common (Powell et al., 1986, Borenstein et al., 2001), and the correlation between LBP and disc degeneration observed in radiographs is only moderate or poor (Witt et al., 1984). Osteophyte formation in the lumbar spine is a characteristic feature of intervertebral disc degeneration, however, the relationship between osteophytes and LBP is less clear (van Tulder et al., 1997). Symmons et al. reported that osteophytes were no more common among women with recurrent back pain compared to those without (Simmons et al., 1991), while O’Neill et al. concluded that osteophytes affecting the lumbar spine are associated with LBP in men (O’Neill et al., 1999). Meanwhile, we often encounter prominent osteophytes in the absence of intervertebral disc degeneration as supporting a lack of association between the two factors reported by Oishi et al (Oishi et al, 2003). They concluded intervertebral disc degeneration and osteophyte formation of the vertebral bodies seemed to represent different factors affecting the lumbar spine. Thus, there are some doubts as to the relationship between osteophyte formation and disc degeneration. We investigated the factors influencing osteophyte formation of the lumbar spine without disc degeneration and estimate the implications of osteophytes from the viewpoint of LBP and gene polymorphism.
Methods
Study subjects
The subjects consisted of Japanese volunteers who attended "a basic health checkup" supported by a local government. A total of 387 elderly persons from 60 to 81 years (average 68.0+6.4 years, 153 males, 234 females), most of whom were engaged in farming and fishing, were invited to participate in the study with a written informed consent form as well as a sheet describing the study outline. Patients with rheumatoid arthrosis, vertebral fracture, or disorders known to affect bone metabolism, including diabetes mellitus and other endocrinologic diseases were excluded from this study.
Evaluation of chronic LBP
Two spine surgeons performed a brief interview including visual analogue scale (VAS) for low back pain (0-100) and physical examination regarding LBP after taking blood samples and radiograms of the lumbar spine. LBP was defined as more than 20 in VAS and lasting for recent 3 months. Body weight, height, body mass index (BMI), body fat ratio, bone stiffness (QUS), back muscle strength, smoking status and alcohol intake were evaluated. Bone stiffness was measured with a quantitative ultrasound (QUS) densitometry device (A-1000PlusII; LUNAR, WI, USA) to calculate the Stiffness Index on the calcaneus recognized by the American Food and Drug Administration (FDA) and which has become the world standard. Back muscle strength was determined as the maximal isometric strength of the trunk muscles in standing posture with 30° lumbar flexion using a digital back muscle strength meter (T.K.K.5402, TAKEI Co., Japan).
Radiographic evaluation
The participants were instructed to stand on both feet shoulder-width apart while maintaining a level gaze. Film-focus distance was unified at 150 cm, and a film was correctly put along a gravity plum line. According to Miyakoshi (Miyakoshi et al., 2003), the degree of disc height narrowing was scored as 0 (0-20% reduction in disc height, as compared with the L1/2 disc), 1 (20-50% reduction), or 2 (more than a 50% reduction), and the total score from the L2/3 to the L5/S1 disc was defined as the disc score. The disc score of 0 was defined as "no disc degeneration". Osteophyte formation was assessed according to Nathan’s classification (0-4) (Nathan et al., 1962), and a total number from L1/2 to L5/S1 (Osteophyte score) of more than 6 was defined as osteophyte (+).
Classification of osteophyte formation
The cases with osteophyte formation were classified by the presence of disc height narrowing into two groups: Group A; osteophyte (+) with disc height narrowing, Group B; osteophyte (+) without disc height narrowing. Group C was defined as the cases without osteophyte formation.
Selected polymorphisms
The gene polymorphism examinations were conducted in accordance with "Ethical Guidelines for Human Genome and Gene Research" (approved: March 29, 2001, implemented: April 1, 2001), with adequate explanation provided to the subjects. The genotypes of the alcohol sensitivity related polymorphisms (alcohol dehydrogenase 2 (ADH2 Arg47His), aldehyde dehydrogenase 2 (ALDH2 Glu487Lys)), tobacco sensitivity related polymorphisms (NADH quinone oxidoreductase 1 (NQO1 C609T), glutathione S transferase M1 (GSTM1), glutathione S transferase T1 (GSTT1)), inflammation related polymorphisms (interleukin 1p (IL-1B), tumor necrosis factor a (TNF-A)), longevity-associated polymorphism of mitochondrial DNA (mt5179), allergy-associated polymorphism of interleukin-4 (IL-4), immunity-associated polymorphism of CD14, vitamin D receptor (VDR) and transforming growth factor P (TGFB1) were characterized by a polymerase chain reaction with the confronting two-pair primers (PCR-CTPP) method (Hamajima et al., 2000). This is a new genotyping method invented independently, recently found to be based on the same logic as bi-directional PCR amplification of specific alleles. Twenty-eight subjects were excluded because of inadequate blood samples. A total of 197 subjects in group A, 93 in group B and 65 in group C were recruited for the polymorphism study. To characterize the features of osteophyte formation without disc degeneration, group B was compared with combined groups A and C (n=262).
Results
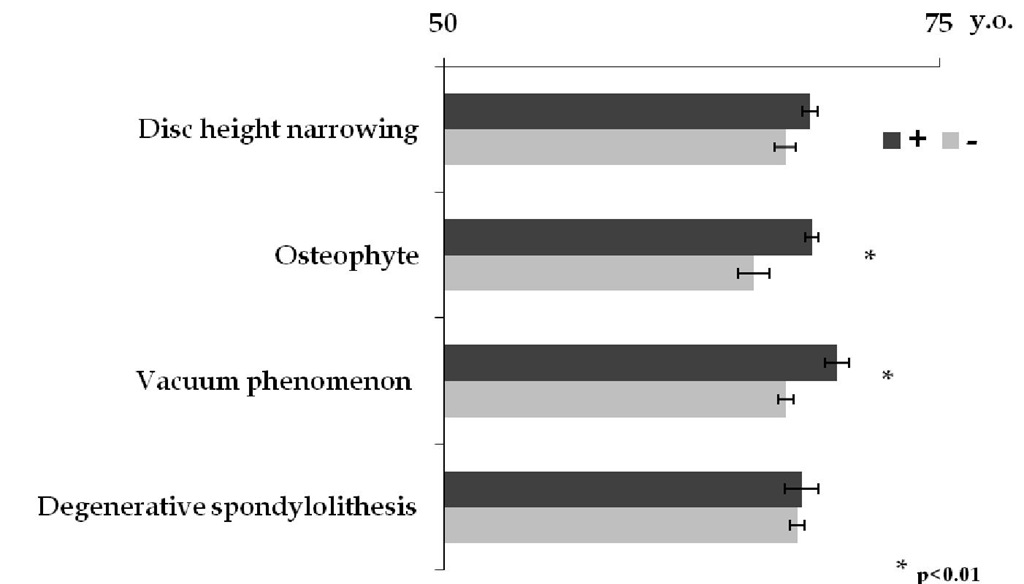
Disc height narrowing and presence of osteophytes were observed in 245 cases (63.3%) and 316 cases (81.6%), respectively. Vacuum phenomenon and degenerative spondylolithesis were seen in 107 cases (27.6%) and 73 cases (18.9%), respectively. Osteophye formation and vacuum phenomenon were significantly seen in elderly person. (p<0.01) (Fig.1) Whereas disc height narrowing was almost seen in L4/5 and L5/s1, osteophyte formation was extensively presented from L1/2 to L5/s1.
Fig. 1. X-ray findings and averaged age
Disc score and osteophyte score
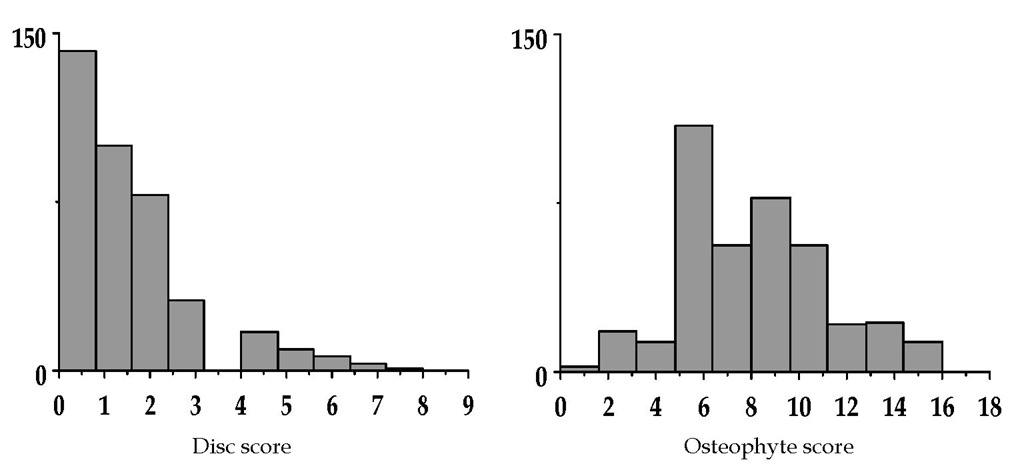
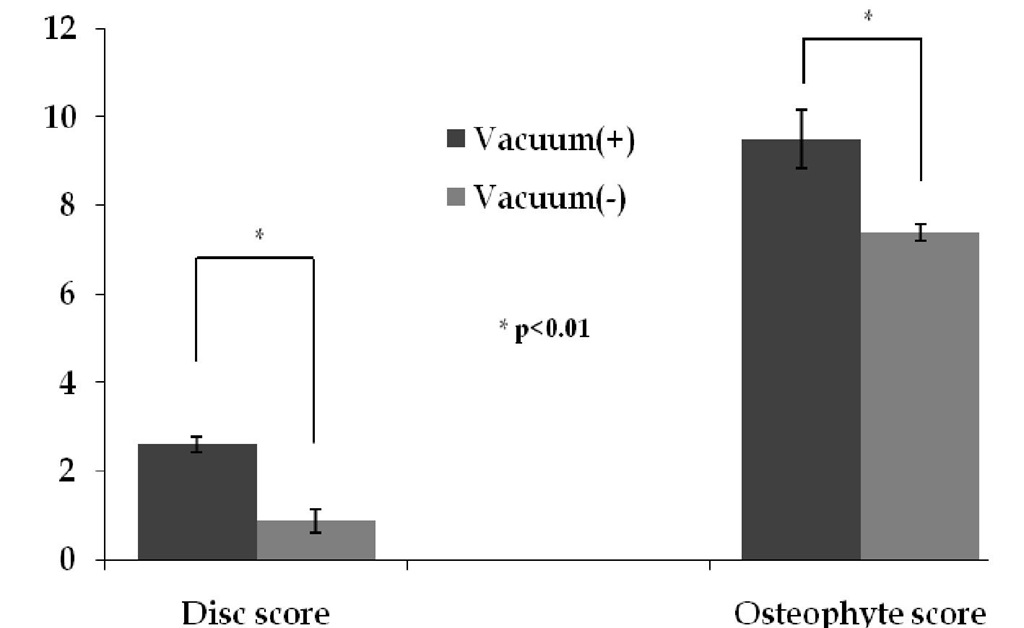
Averaged disc score and osteophyte score were 1.4+1.5 and 8.3+3.1, respectively. (Fig.2) There were no significant correlation between Disc score and Osteophyte score with Spearman’s rank test. (p=0.084, r=0.293) Multiple regression analysis revealed that Disc score was associated with age, and Osteophyte score was associated with age, gender (male > female). (Table 1) Subjects who present vacuum phenomenon had significantly higher Disc score and Osteophyte score. (p<0.01) (Fig. 3)
According to the classification of osteophyte formation (2.4), Group A (osteophyte (+) with disc height narrowing) and Group B (osteophyte (+) without disc height narrowing) were seen in 217 and 99 cases, respectively. Group C (without osteophyte formation) was seen in 71 cases. Reduction of disc height was significantly associated with the presence of osteophyte. (p<0.01) (Table 2)
Fig. 2. Frequency distribution of disc score and osteophyte score
|
Disc score |
Osteophyte score |
|||
|
r |
P |
r |
P |
|
|
Age |
0.150 |
0.006 |
0.122 |
0.021 |
|
Gender |
0.061 |
0.568 |
0.400 |
<0.001 |
|
Height |
0.181 |
0.664 |
0.462 |
0.223 |
|
Weight |
0.312 |
0.619 |
0.593 |
0.283 |
|
BMI |
0.271 |
0.592 |
0.224 |
0.617 |
|
Body fat ratio |
0.015 |
0.891 |
0.142 |
0.156 |
|
Brinkman index |
0.106 |
0.089 |
0.061 |
0.276 |
|
Alcohol consumptio |
0.044 |
0.461 |
0.002 |
0.970 |
|
Bone stiffness |
0.046 |
0.392 |
0.046 |
0.340 |
Data are correlation coefficients (r) by Spearman’s rank test and statistical significance (p value)
Table 1. Correlations between the parameters of physical factors and Disc score, Osteophyte score
Fig. 3. Disc score and Osteophyte score according to the presence of vacuum phenomenon.
|
Reduction of Disc height (+) |
Reduction of Disc height (-) |
Total |
|
|
Osteophte (+) |
217 case * (Group A) |
99 cases (Group B) |
316 cases |
|
Osteophte (-) |
28 cases |
43 cases |
71 cases (Group C) |
|
Total |
245 cases |
142 cases |
387 cases |
* p<0.01
Table 2. Presence of disc height loss and osteophyte formation


