Sometimes when people make a movie they lower the overall intensity in order to create a special atmosphere. Some overdo this and the result is that the viewer cannot see anything except darkness. What do you do? You pick up your remote and adjust the level of the light by pushing the brightness button. When doing so you actually perform a special type of image processing known as point processing.
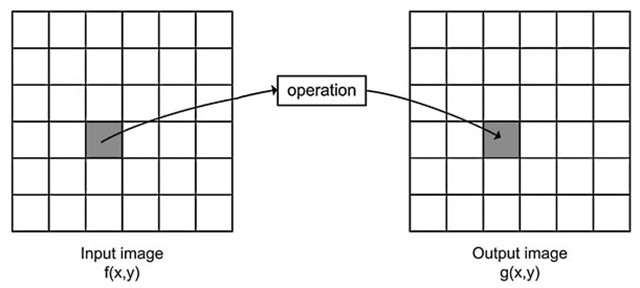
Say we have an input image f(x, y) and wish to manipulate it resulting in a different image, denoted the output image g(x,y). In the case of changing the brightness in a movie, the input image will be the one stored on the DVD you are watching and the output image will be the one actually shown on the TV screen. Point processing is now defined as an operation which calculates the new value of a pixel in g(x, y) based on the value of the pixel in the same position in f(x, y) and some operation. That is, the values of a pixel’s neighbors in f(x, y) have no effect whatsoever, hence the name point processing. In the forthcoming topics the neighbor pixels will play an important role. The principle of point processing is illustrated in Fig. 4.1. In this topic some of the most fundamental point processing operations are described.
Gray-Level Mapping
When manipulating the brightness by your remote you actually change the value of b in the following equation:
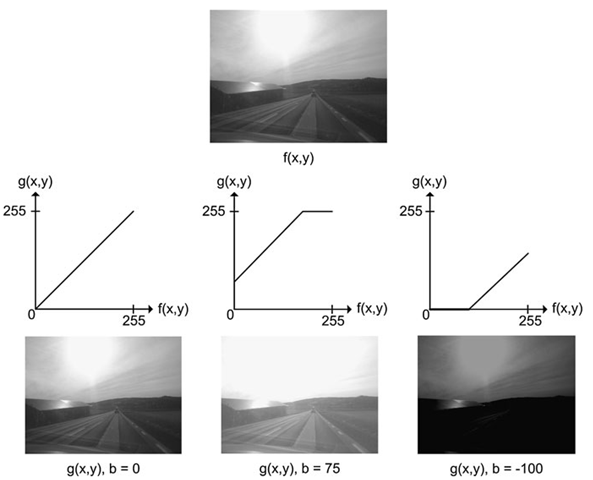
Every time you push the ‘+’ brightness button the value of b is increased and vice versa. The result of increasing b is that a higher and higher value is added to each pixel in the input image and hence it becomes brighter. If b > 0 the image becomes brighter and if b < 0 the image becomes darker. The effect of changing the brightness is illustrated in Fig. 4.2.
Fig. 4.1 The principle of point processing. A pixel in the input image is processed and the result is stored at the same position in the output image
Fig. 4.2 If b in Eq. 4.1 is zero, the resulting image will be equal to the input image. If b is a negative number, then the resulting image will have decreased brightness, and if b is a positive number the resulting image will have increased brightness
An often more convenient way of expressing the brightness operation is by the use of a graph, see Fig. 4.3. The graph shows how a pixel value in the input image (horizontal axis) maps to a pixel value in the output image (vertical axis). Such a graph is denoted gray-level mapping. In the first graph, the mapping does absolutely nothing, i.e., g(142,42) = /(142,42). In the next graph all pixel values are increased (b > 0), hence the image becomes brighter. This results in two things: i) no pixel will be completely dark in the output and ii) some pixels will have a value above 255 in the output image. The latter is no good due to the upper limit of an 8-bit image and therefore all pixels above 255 are set equal to 255 as illustrated by the horizontal part of the graph. When b < 0 some pixels will have negative values and are therefore set equal to zero in the output as seen in the last graph.
Just like changing the brightness on your TV, you can also change the contrast. The contrast of an image is a matter of how different the gray-level values are. If we look at two pixels next to each other with values 112 and 114, then the human eye has difficulties distinguishing them and we will say there is a low contrast. On the other hand if the pixels are 112 and 212, respectively, then we can easily distinguish them and we will say the contrast is high.
Fig. 4.3 Three examples of gray-level mapping. The top image is the input. The three other images are the result of applying the three gray-level mappings to the input. All three gray-level mappings are based on Eq. 4.1
Fig. 4.4 If a in Eq. 4.2 is one, the resulting image will be equal to the input image. If a is smaller than one then the resulting image will have decreased contrast, and if a is higher than one then the resulting image will have increased contrast
The contrast of an image is changed by changing the slope of the graph1:
If a > 1 the contrast is increased and if a < 1 the contrast is decreased. For example when a = 2 the pixels 112 and 114 will get the values 224 and 228, respectively. The difference between them is increased by a factor 2 and the contrast is therefore increased. In Fig. 4.4 the effect of changing the contrast can be seen.
If we combine the equations for brightness, Eq. 4.1, and contrast, Eq. 4.2, we have
which is the equation of a straight line. Let us look at an example of how to apply this equation. Say we are interested in a certain part of the input image where the contrast might not be sufficient. We therefore find the range of the pixels in this part of the image and map them to the entire range, [0, 255] in the output image. Say that the minimum pixel value and maximum pixel values in the input image are 100 and 150, respectively. Changing the contrast then means to say that all pixel value below 100 are set to zero in the output and all pixel values above 150 are set to 255 in the output image. The pixels in the range [100, 150] are then mapped to [0, 255] using Eq. 4.3 where a and b are defined as follows:
where /1 = 100 and /2 = 150.
Non-linear Gray-Level Mapping
Gray-level mapping is not limited to linear mappings as defined by Eq. 4.3. In fact the designer is free to define the gray-level mapping as she pleases as long as there is one and only one output value for each input value. Often the designer will utilize a well defined equation/graph as opposed to defining a new one. Below three of the most common non-linear mapping functions are presented.
Gamma Mapping
In many cameras and display devices (flat panel televisions for example) it is useful to be able to increase or decrease the contrast in the dark gray levels and the light gray levels individually since humans have a non-linear perception of contrast. A commonly used non-linear mapping is gamma mapping, which is defined for positive γ as
Fig. 4.5 Gamma-mapping curves for different gammas
Some gamma-mapping curves are illustrated in Fig. 4.5. For γ = 1 we get the identity mapping. For 0 < γ < 1 we increase the dynamics in the dark areas by increasing the mid-levels. For γ > 1 we increase the dynamics in the bright areas by decreasing the mid-levels. The gamma mapping is defined so that the input and output pixel values are in the range [0, 1]. It is therefore necessary to first transform the input pixel values by dividing each pixel value with 255 before the gamma transformation. The output values should also be scaled from [0, 1] to [0, 255] after the gamma transformation.
A concrete example is given. A pixel in a gray-scale image with value vin = 120 is gamma mapped with γ = 2.22. Initially, the pixel value is transformed into the interval [0,1] by dividing with 255, v\ = 120/255 = 0.4706. Secondly, the gamma mapping is performed v2 = 0.47062.22 = 0.1876. Finally, it is mapped back to the interval [0,255] giving the result vout = 0.1876 · 255 = 47. Examples are illustrated in Fig. 4.6.
Fig. 4.6 Gamma mapping to the left with γ = 0.45 and to the right with γ = 2.22. In the middle the original image
Logarithmic Mapping
An alternative non-linear mapping is based on the logarithm operator. Each pixel is replaced by the logarithm of the pixel value. This has the effect that low intensity pixel values are enhanced. It is often used in cases where the dynamic range of the image is too great to be displayed or in images where there are a few very bright spots on a darker background. Since the logarithm is not defined for 0, the mapping is defined as
where c is a scaling constant that ensures that the maximum output value is 255. It is calculated as
where umax is the maximum pixel value in the input image.
The behavior of the logarithmic mapping can be controlled by changing the pixel values of the input image using a linear mapping before the logarithmic mapping. The logarithmic mapping from the interval [0,255] to [0,255] is seen in Fig. 4.7. This mapping will clearly stretch the low intensity pixels while suppressing the contrast in high intensity pixels. An example is illustrated in Fig. 4.7.


