So far we have restricted ourselves to gray-scale images, but, as you might have noticed, the real world consists of colors. Going back some years, many cameras (and displays, e.g., TV-monitors) only handled gray-scale images. As the technology matured, it became possible to capture (and visualize) color images and today most cameras capture color images.
In this topic we turn to the topic of color images. We describe the nature of color images and how they are captured and represented.
What Isa Color?
It was also stated that only energy within a certain frequency/wavelength range is measured. This wavelength range is denoted the visual spectrum, see Fig. 2.2. In the human eye this is done by the so-called rods, which are specialized nerve-cells that act as photoreceptors. Besides the rods, the human eye also contains cones. These operate like the rods, but are not sensitive to all wavelengths in the visual spectrum. Instead, the eye contains three types of cones, each sensitive to a different wavelength range. The human brain interprets the output from these different cones as different colors as seen in Table 3.1 [4].
So, a color is defined by a certain wavelength in the electromagnetic spectrum as illustrated in Fig. 3.1.
Since the three different types of cones exist we have the notion of the primary colors being red, green and blue. Psycho-visual experiments have shown that the different cones have different sensitivity. This means that when you see two different colors with the same intensity, you will judge their brightness differently. On average, a human perceives red as being 2.6 times as bright as blue and green as being 5.6 times as bright as blue. Hence the eye is more sensitive to green and least sensitive to blue.
When all wavelengths (all colors) are present at the same time, the eye perceives this as a shade of gray, hence no color is seen! If the energy level increases the shade becomes brighter and ultimately becomes white. Conversely, when the energy
Table 3.1 The different types of photoreceptor in the human eye. The cones are each specialized to a certain wavelength range and peak response within the visual spectrum. The output from each of the three types of cone is interpreted as a particular color by the human brain: red, green, and blue, respectively. The rods measure the amount of energy in the visual spectrum, hence the shade of gray. The type indicators L, M, S, are short for long, medium and short, respectively, and refer to the wavelength level is decreased, the shade becomes darker and ultimately becomes black. This continuum of different gray-levels (or shades of gray) is denoted the achromatic colors and illustrated in Fig. 3.2. Note that this is the same as Fig. 2.18.
|
Photoreceptor cell |
Wavelength in nanometers (nm) |
Peak response in nanometer (nm) |
Interpretation by the human brain |
|
Cones (type L) |
[400-680] |
564 |
Red |
|
Cones (type M) |
[400-650] |
534 |
Green |
|
Cones (type S) |
[370-530] |
420 |
Blue |
|
Rods |
[400-600] |
498 |
Shade of gray |
Fig. 3.1 The relationship between colors and wavelengths
Fig. 3.2 Achromatic colors
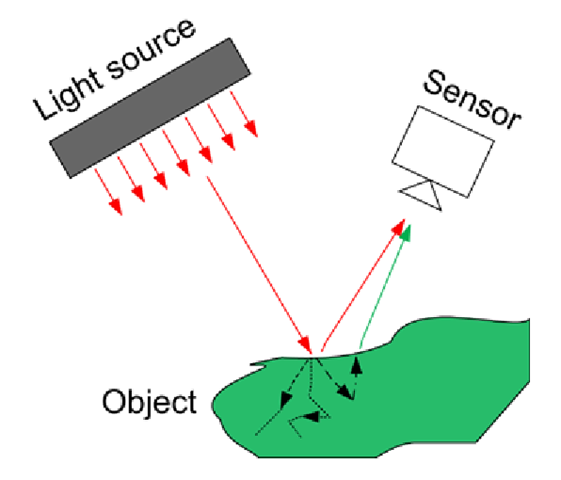
An image is created by sampling the incoming light. The colors of the incoming light depend on the color of the light source illuminating the scene and the material the object is made of, see Fig. 3.3. Some of the light that hits the object will bounce right off and some will penetrate into the object. An amount of this light will be absorbed by the object and an amount leaves again possibly with a different color. So when you see a green car this means that the wavelengths of the main light reflected from the car are in the range of the type M cones, see Table 3.1. Ifwe assume the car was illuminated by the sun, which emits all wavelengths, then we can reason that all wavelengths except the green ones are absorbed by the material the car is made of. Or in other words, if you are wearing a black shirt all wavelengths (energy) are absorbed by the shirt and this is why it becomes hotter than a white shirt.
When the resulting color is created by illuminating an object by white light and then absorbing some of the wavelengths (colors) we use the notion of subtractive colors. Exactly as when you mix paint to create a color. Say you start with a white piece of paper, where no light is absorbed. The resulting color will be white. If you then want the paper to become green you add green paint, which absorbs everything but the green wavelengths. If you add yet another color of paint, then more wavelengths will be absorbed, and hence the resulting light will have a new color. Keep doing this and you will in theory end up with a mixture where all wavelengths are absorbed, that is, black. In practice, however, it will probably not be black, but rather dark gray/brown.
Fig. 3.3 The different components influencing the color of the received light
The opposite of subtractive colors is additive colors. This notion applies when you create the wavelengths as opposed to manipulating white light. A good example is a color monitor like a computer screen or a TV screen. Here each pixel is a combination of emitted red, green and blue light. Meaning that a black pixel is generated by not emitting anything at all. White (or rather a shade of gray) is generated by emitting the same amount of red, green, and blue. Red will be created by only emitting red light etc. All other colors are created by a combination of red, green and blue. For example yellow is created by emitting the same amount of red and green, and no blue.
Representation of an RGB Color Image
A color camera is based on the same principle as the human eye. That is, it measures the amount of incoming red light, green light and blue light, respectively. This is done in one of two ways depending on the number of sensors in the camera. In the case of three sensors, each sensor measures one of the three colors, respectively. This is done by splitting the incoming light into the three wavelength ranges using some optical filters and mirrors. So red light is only send to the “red-sensor” etc. The result is three images each describing the amount of red, green and blue light per pixel, respectively. In a color image, each pixel therefore consists of three values: red, green and blue. The actual representation might be three images—one for each color, as illustrated in Fig. 3.4, but it can also be a 3-dimensional vector for each pixel, hence an image of vectors. Such a vector looks like this:
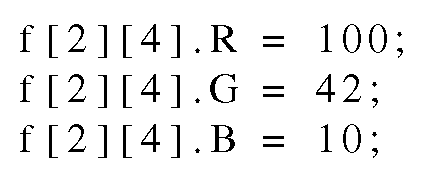
In terms of programming a color pixel is usually represented as a struct. Say we want to set the RGB values of the pixel at position (2,4) to: Red = 100, Green = 42, and Blue = 10, respectively. In C-code this can for example be written as
Fig. 3.4 A color image consisting of three images; red, green and blue
Typically each color value is represented by an 8-bit (one byte) value meaning that 256 different shades of each color can be measured. Combining different values of the three colors, each pixel can represent 2563 = 16,777,216 different colors.
A cheaper alternative to having three sensors including mirrors and optical filters is to only have one sensor. In this case, each cell in the sensor is made sensitive to one of the three colors (ranges of wavelength). This can be done in a number of different ways. One is using a Bayer pattern. Here 50% of the cells are sensitive to green, while the remaining cells are divided equally between red and blue. The reason being, as mentioned above, that the human eye is more sensitive to green. The layout of the different cells is illustrated in Fig. 3.5.
The figure shows the upper-left corner of the sensor, where the letters illustrate which color a particular pixel is sensitive to. This means that each pixel only captures one color and that the two other colors of a particular pixel must be inferred from the neighbors. Algorithms for finding the remaining colors of a pixel are known as demosaicing and, generally speaking, the algorithms are characterized by the required processing time (often directly proportional to the number of neighbors included) and the quality of the output. The higher the processing time the better the result.
Fig. 3.5 The Bayer pattern used for capturing a color image on a single image sensor. R = red, G = green, and B = blue
Fig. 3.6 (a) Numbers measured by the sensor. (b) Estimated RGB image using Eq. 3.2
How to balance these two issues is up to the camera manufactures, and in general, the higher the quality of the camera, the higher the cost. Even very advanced algorithms are not as good as a three sensor color camera and note that when using, for example, a cheap web-camera, the quality of the colors might not be too good and care should be taken before using the colors for any processing. Regardless of the choice of demosaicing algorithm, the output is the same as when using three sensors, namely Eq. 3.1. That is, even though only one color is measured per pixel, the output for each pixel will (after demosaicing) consist of three values: R, G, and B.
An example of a simple demosaicing algorithm is to infer the missing colors from the nearest pixels, for example using the following set of equations:
where f(x,y) is the input image (Bayer pattern) and g(x,y) is the output RGB image. The RGB values in the output image are found differently depending on which color a particular pixel is sensitive to: [R, G, B]b should be used for the pixels sensitive to blue, [R, G, B]R should be used for the pixels sensitive to red, and [R, G, B]gb and [R, G, B]gr should be used for the pixels sensitive to green followed by a blue or red pixel, respectively.
In Fig. 3.6 a concrete example of this algorithm is illustrated. In the left figure the values sampled from the sensor are shown. In the right figure the resulting RGB output image is shown using Eq. 3.2.
Fig. 3.7 (a) The RGB color cube. (b) The gray-vector in the RGB color cube
|
Corner |
Color |
|
|
(0, 0, 0) |
Black |
 |
|
(255, 0,0) |
Red |
 |
|
(0, 255, 0) |
Green |
 |
|
(0, 0, 255) |
Blue |
 |
|
(255, 255, 0) |
Yellow |
 |
|
(255, 0, 255) |
Magenta |
 |
|
(0, 255, 255) |
Cyan |
 |
|
(255, 255, 255) |
White |
Table 3.2 The colors of the different corners in the RGB color cube


