A number of Interface Models have been implemented for the Periscope system [44]. Examples of holistic, analytical, and hybrid as well as specialized interfaces are presented below. In Fig. 10.14, a holistic interface with two visualization dimensions is presented. In this interface, each sphere represents a set of documents in a particular language, while sphere slices represent distribution of documents within DNS domains. Mapping of attributes to visualization dimensions is flexible and the same interface may be used differently: subsequent spheres may represent the number of keywords found in the document (1,2, 3,…), while colored slices may represent the number of documents in a particular format (e.g., pdf, txt, html, doc).
Fig. 10.16 An example of a universal interface—holistic or analytical
In Fig. 10.15, an example analytical interface is presented. This interface uses a metaphor of a multilevel store to enable visualization with a high number of different visualization dimensions. The following visualization dimensions are used in this interface: object positions in x, y, and z axes, object color, size, shape and blinking (temporary color change). Therefore, by the use of this interface, seven different attributes may be visualized at the same time, permitting users to perform detailed analyses of the result. In the presented example, glyph colors represent the document language, position on the x axis represents the modification date, y axis represents the host address, z axis represents the document size, while shape represents the file type. If a URL has been re-indexed within last 10 days (a user controllable parameter), the corresponding glyph blinks.
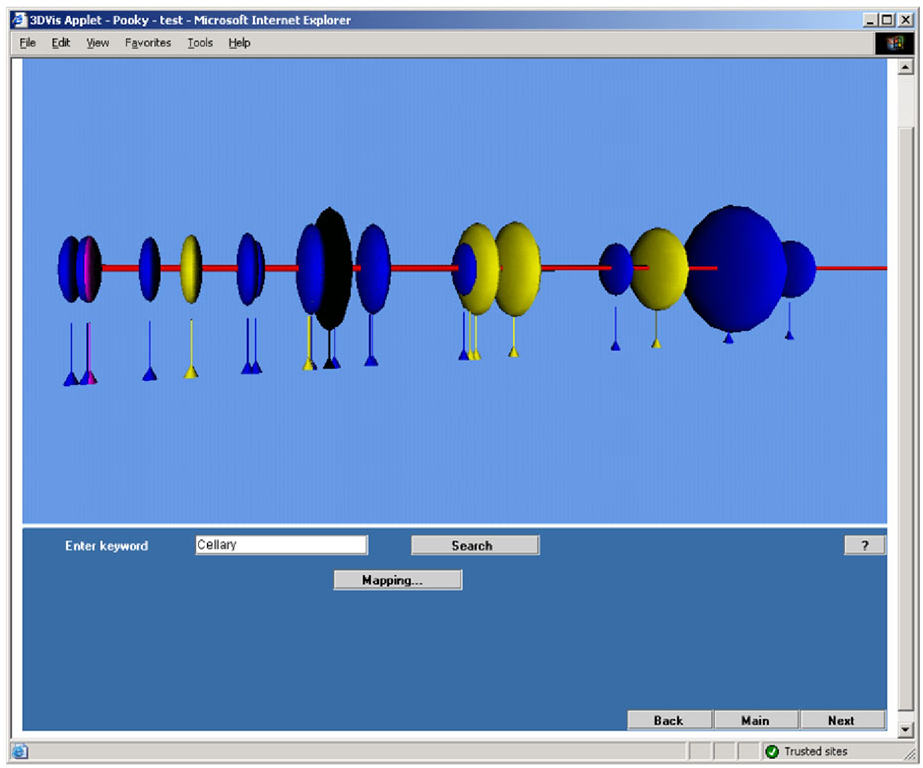
While the above-presented interfaces can be clearly categorized as holistic or analytical, the interface presented in Fig. 10.16 can be used as either holistic or analytical. This interface has three visualization dimensions: position on x axis, glyph color, and glyph size. Each glyph may represent a group of documents (holistic view) or a single document (analytical view). To allow a user to distinguish between these two views, in an analytical interface each glyph is tied to a visual tag being an anchor to the document. This interface provides a user with enhanced interaction possibilities. Each glyph may be shifted along the axis, and therefore a user may group objects of interest to work with.
Fig. 10.17 An example of a hybrid interface
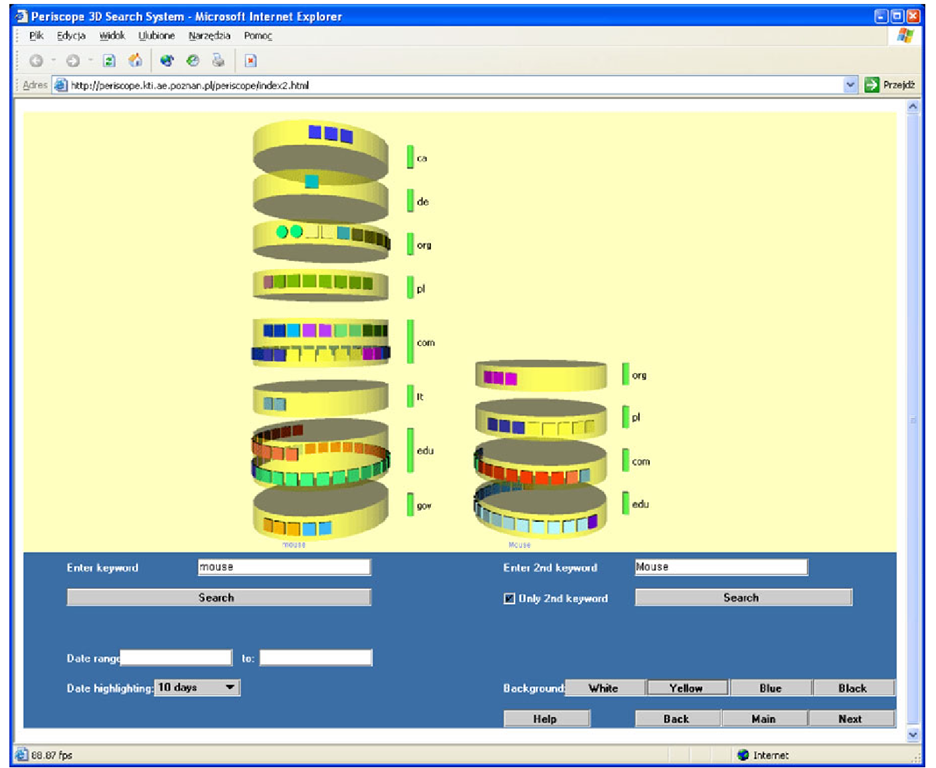
In Fig. 10.17, an example hybrid interface is presented. This interface joins a holistic, aggregated view of documents grouped by domains (each coaxial cylinder represents a different domain) with an analytical, detailed view of all documents (each tile on the cylinders represent one document). Additional visualization dimension—object color—is used to represent the website of the document. Tiles with the same color represent documents found on the same website. The interface presented in Fig. 10.17 permits also a comparative visualization of search results for two different queries (each set of coaxial cylinders represents one query).
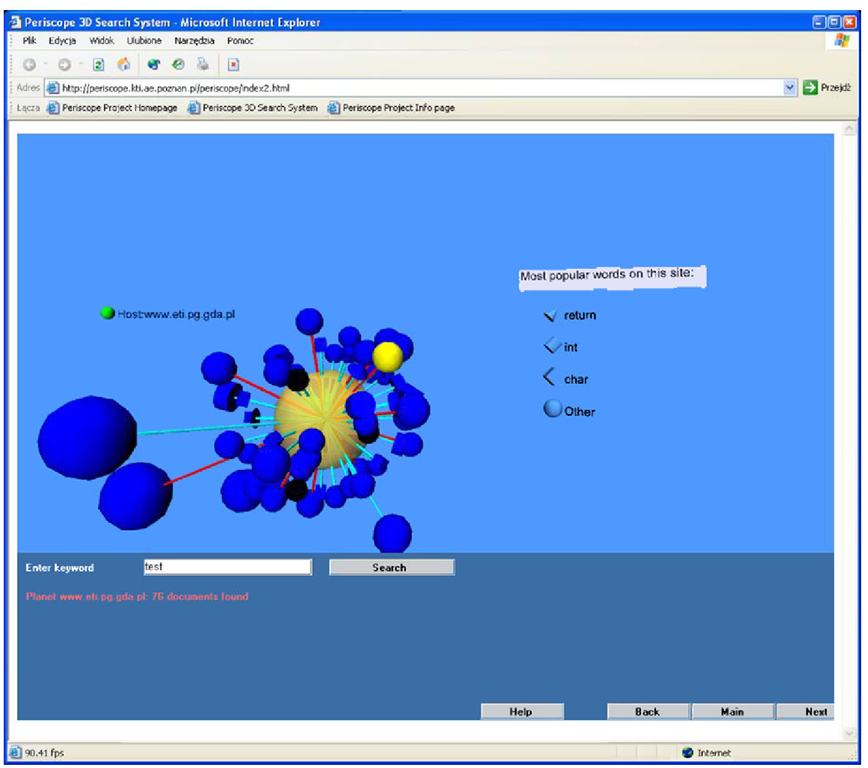
The Periscope system may be also equipped with specialized interfaces that enrich the exploration possibilities within the search result. In Fig. 10.18, an example interface used to visualize documents found on a single website is presented. Properties of each document may be expressed by the use of the following visualization dimensions: glyph color, size, shape, and the color and length of the join.
Fig. 10.18 An example of a specialized interface—a host view
Conclusions
The AVE method described in this topic permits a readable and comprehensive presentation of search results retrieved from an indexing search engine. In order to maximize readability of the presented information according to proposed readability prerequisites, a proper visualization interface is automatically chosen based on collection of available visualization interfaces. To enhance perception of presented data, a user may assign different search result properties to visual dimensions of the interface emphasizing features necessary for retrieval of important information. Then—in an interactive multi-step process—a user may refine his/her query and apply an appropriate visualization method, eventually finding the required documents.
The method has been implemented in a prototype system called Periscope built on top of an indexing search engine. Important features of the Periscope system, which support a user in the process of search result analysis, include:
• model switching—a user can switch from one model to another to visualize different aspects of the search result;
• attribute mapping—a user can freely assign search result attributes to visualization dimensions and—therefore—modify the method of visualization to highlight important features of the search result;
• comparative searches—using special models, a user can compare in a single 3D scene search results of two or more different queries.


