Example: Juvenile Crime Thematic Map
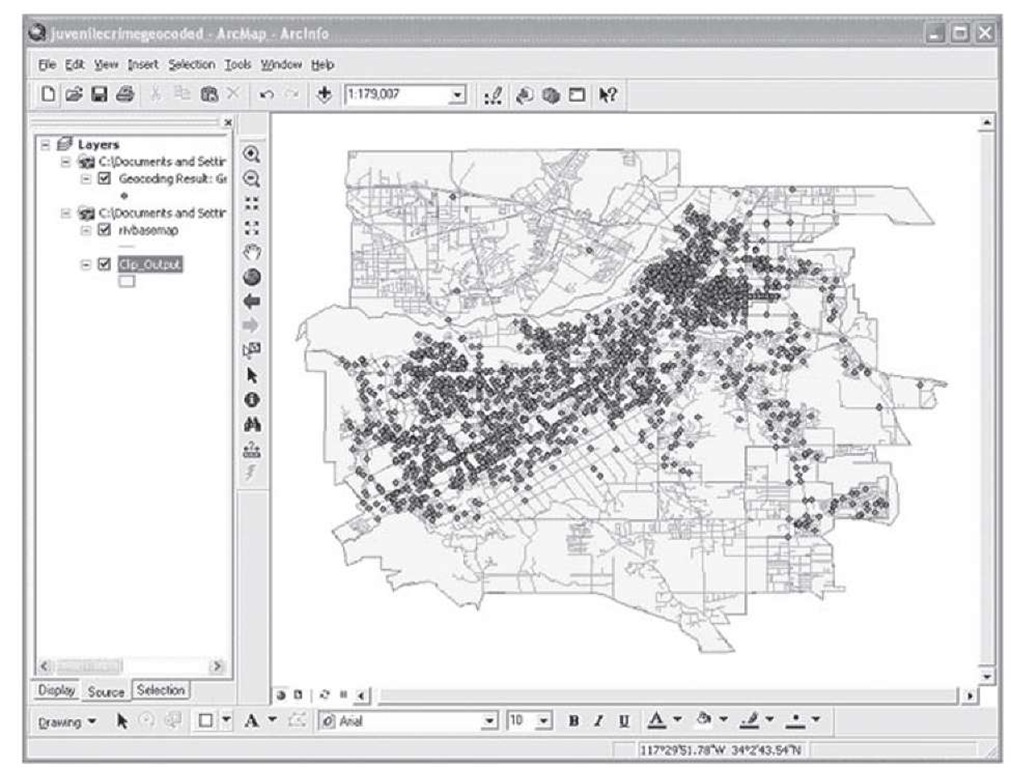
First, browse to the location on your computer where you have stored the geoco-ded map of juvenile crime that you created in the previous section and doubleclick on the filename to open this map in ArcGIS. Your .mxd file should look similar to Figure 1.88.
FIGURE 1.88 Pin map of youth violent incidents, Riverside
Now you will learn how to create a thematic map demonstrating differences in rates of juvenile crime in Riverside, CA, in 2002, by building from the existing geocoded map you created in the previous section.
First, we will need to join the polygon layer containing the block group divisions for Riverside to the point layer containing the geocoded incidents of juvenile crime in Riverside for 2002.
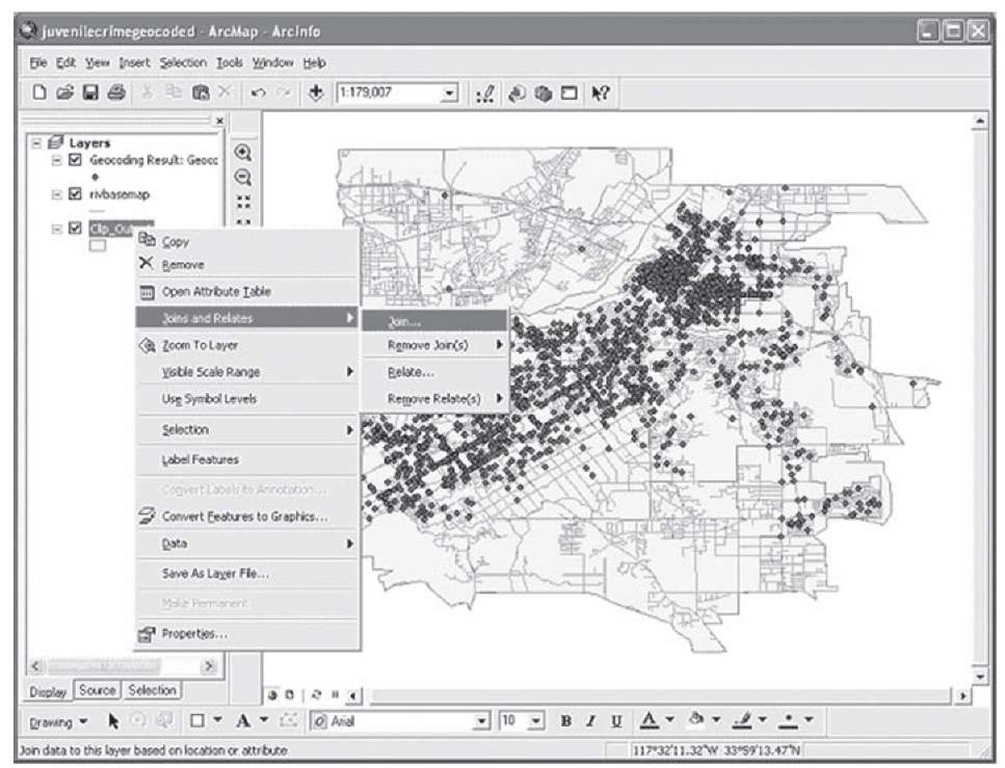
Step 1 Right-click the mouse on the name of the layer containing the polygon data (in this case it is clip_output) in the open .mxd file. Select Joins and Relates > Join as shown in Figure 1.89.
FIGURE 1.89 The Join submenu
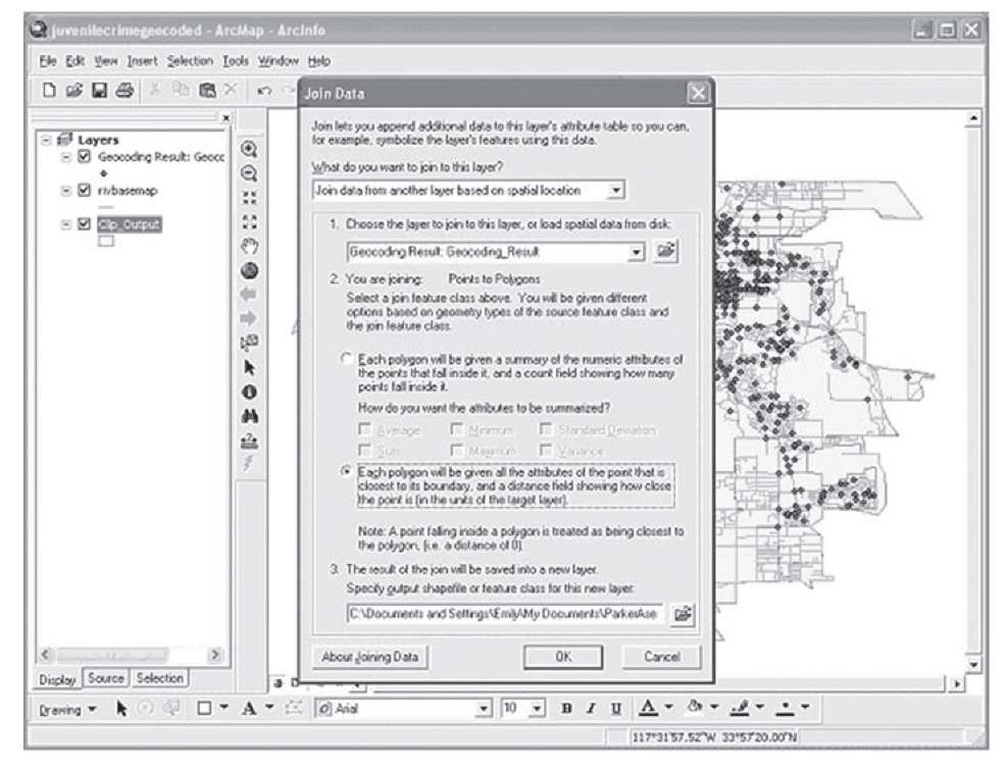
Step 2 Use the Join submenu to specify that the point layer will be joined to the polygon layer based on spatial location. Turn on the radio button specifying that each polygon will contain all attributes of the point data set and specify the location and filename to save the result of the join as in the example in Figure 1.90.
Figure 1.90 Placing geocoded data into spatial units on the map
Note that ArcGIS also provides the option to associate a summary format of the attributes of the join layer, which may be useful under some conditions. For the purposes of this example it is necessary to carry all attributes over from the point layer.
ArcGIS will automatically add the resulting joined layer to the map for you. Open up the attribute table of the joined layer to see that the fields from both the polygon layer and the point layer are now contained in one joined layer. Join can be used to combine attributes from multiple sources to create a single layer that can be used for analyses. Now you can create the thematic map showing the differential juvenile crime rates between census block groups for Riverside in 2002.
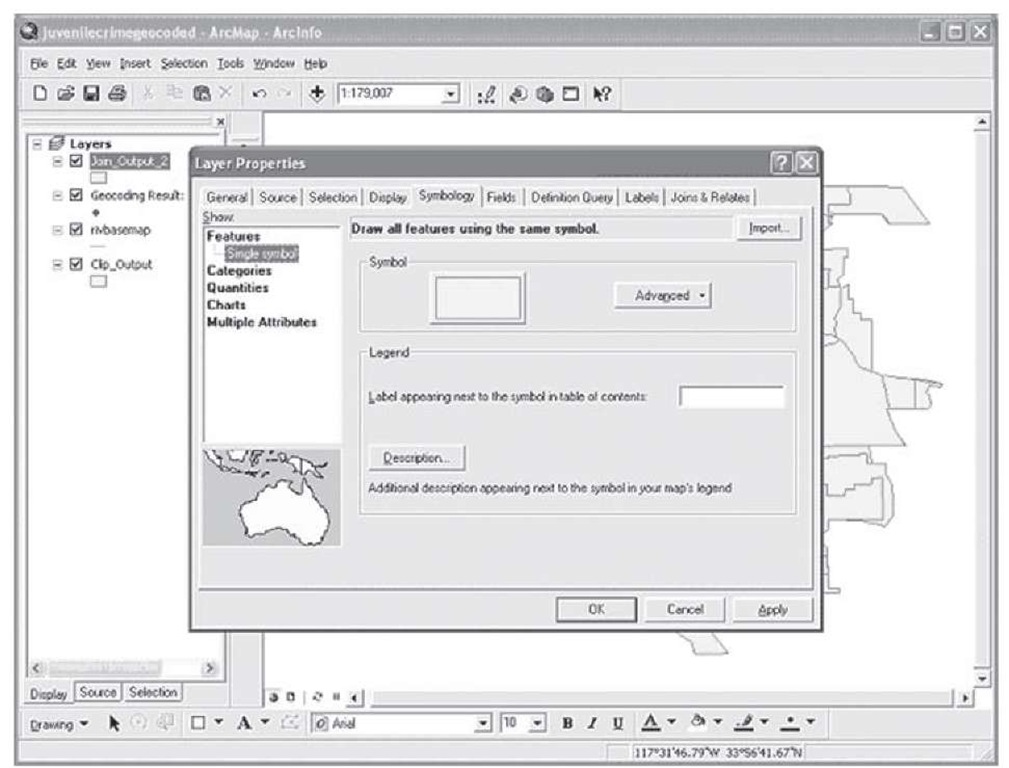
Step 3 Right-click on the joined layer name and select properties. The Layer Properties dialog box should appear. Select the Symbology tab as shown in Figure 1.91.
Figure 1.91 A thematic map from the geocoded data
In the show panel, select Quantities. Then, select Graduated colors.
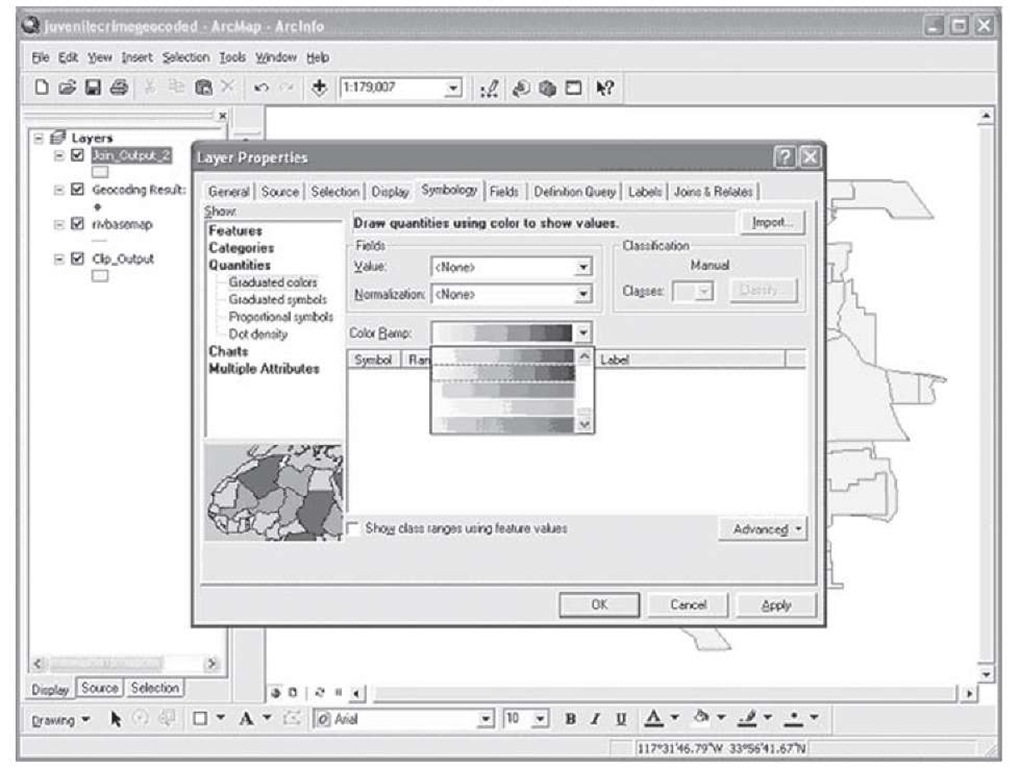
Use the Color Ramp pulldown to browse through the available color options as in Figure 1.92. Select the color ramp of your choice.
Figure 1.92 Graduate colors for a thematic map
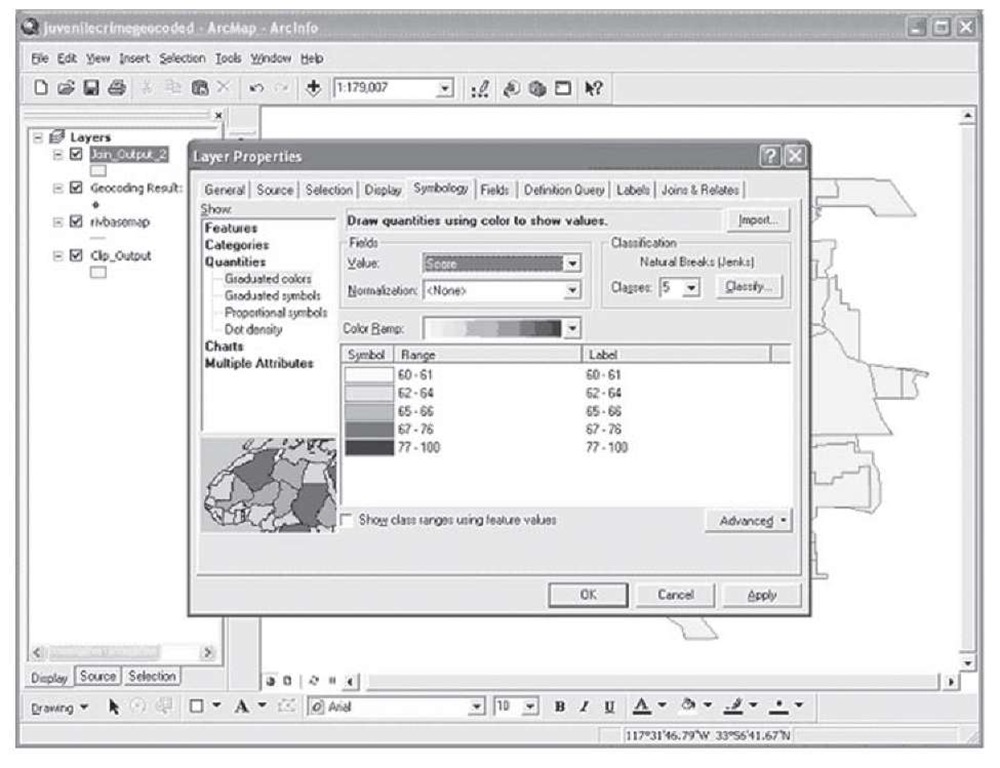
Step 4 In the Value drop down, select the Score field. The dialog will automatically populate with the number of values in each class according to the number of classes specified in the classes box, as shown in Figure 1.93.
FIGURE 1.93 Finalizing the nature of a thematic map
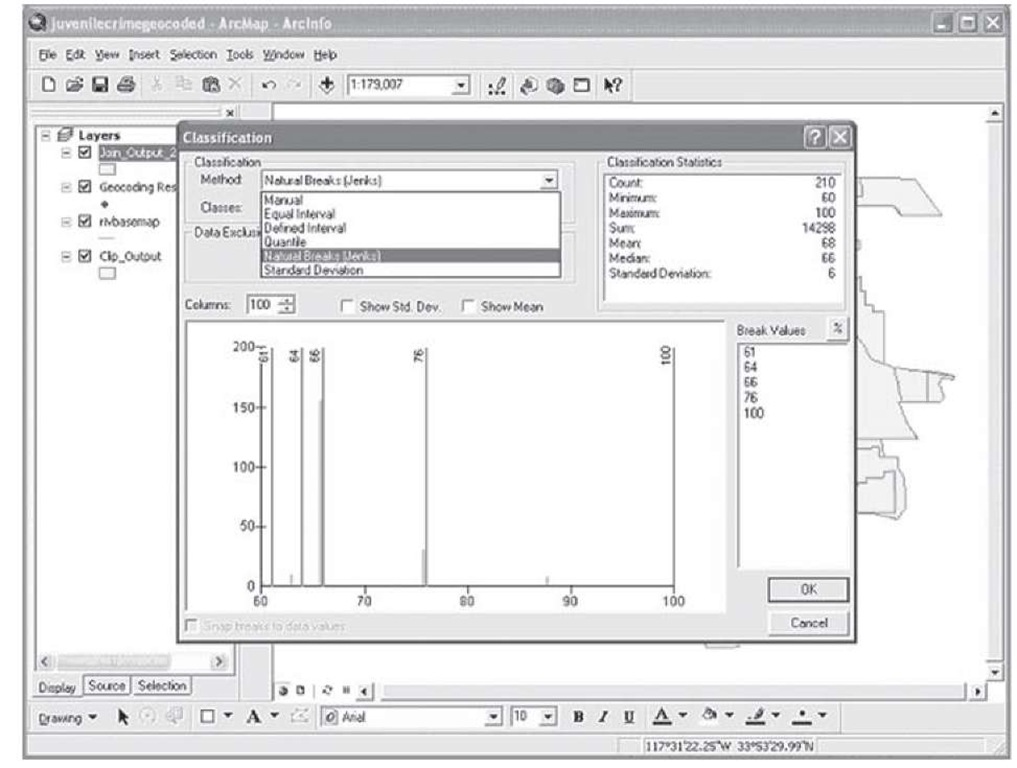
Use the classes pulldown to experiment with the different number of classes that can be used with the automatic classes option. ArcGIS is set to the "Natural Breaks" option for classes by default. Click on the Classify and use the Method pulldown to see additional options for classification. The most appropriate method of classification will depend upon the data you are presenting, and the audience to whom you are presenting. The syntax used for the various methods can be found in the ArcGIS online help (Figure 1.94).
FIGURE 1.94 Selecting category boundaries for a thematic map
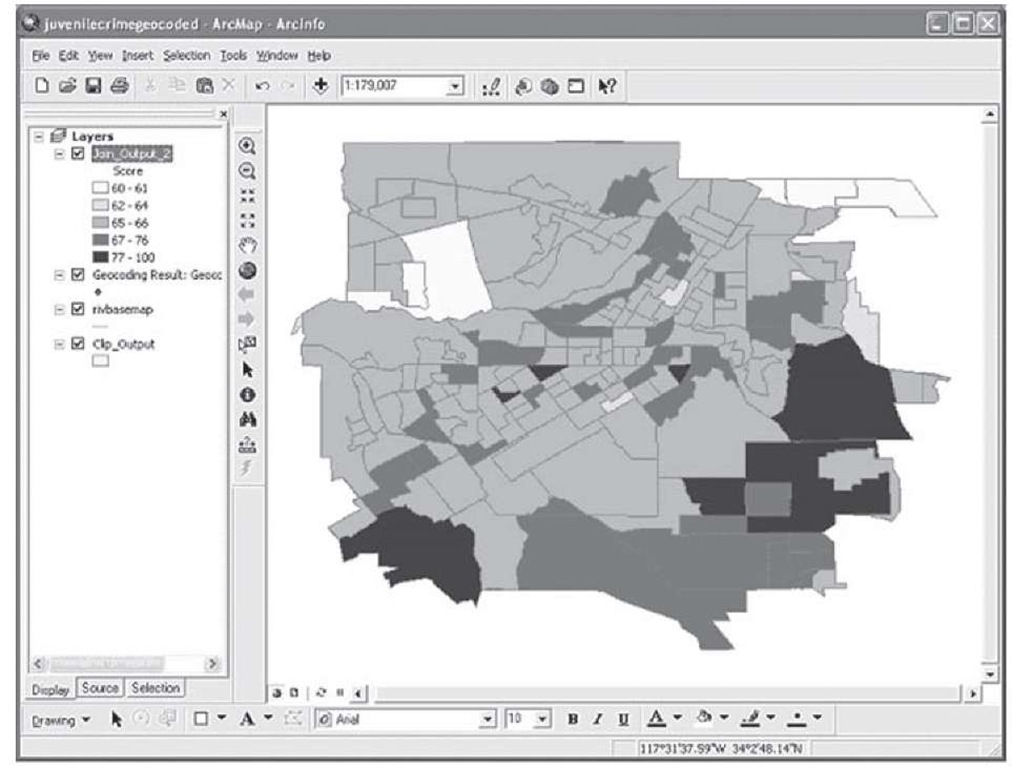
The Break Values in the box on the right can also be edited manually by clicking with the mouse and then using the keyboard to enter the desired values. After taking a minute to explore the Classification dialog box, click cancel to return to the Symbology tab of the Layer Properties dialog box. In the Layer Properties box, click Apply. You will see some changes occurring in the map behind the dialog box. Click OK to dismiss the dialog box and display your thematic map as shown in Figure 1.95.
FIGURE 1.95 A new thematic map
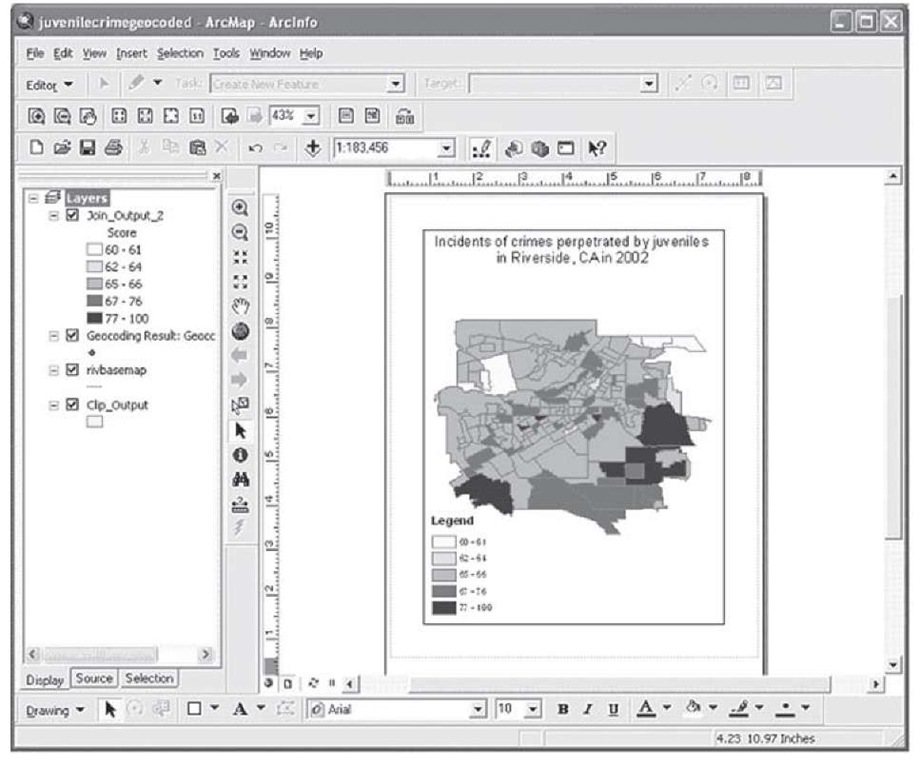
Step 5 Use the layout view to add a legend and title. Once finished, save your work. Your finished product should look similar to the map in Figure 1.96.
FIGURE 1.96 Hot spots of juvenile violence
A simple look at our map of instances of juvenile crime reveals several "hot spots" where these incidents are more prevalent. Specifically, the lower west end and the mid to lower east end of town have significantly larger amounts of juvenile crime than other areas of the city. Additionally, there are two areas that seem particularly low in comparison to the hot spots. It might be of interest to the researcher to pursue further investigation into these areas in terms of specific characteristics that might lead to these differential rates. For example, by taking a look at the census block group data, a researcher could examine the number of divorced parents in these areas to see if there is a difference in this rate that correlates with the difference in juvenile perpetrated crime.
Since we have census data associated with the files we are currently using, we can use the current map to take a quick look at the divorce rates by block group to see an illustration of how this type of comparison would work.
Step 1 Double-click on the layer name Join_Output_2 to open up the Layer Properties. Select the Symbology tab.
Step 2 Replace Score for the value field with Divorced using the pulldown menu. Click Apply. Click OK.
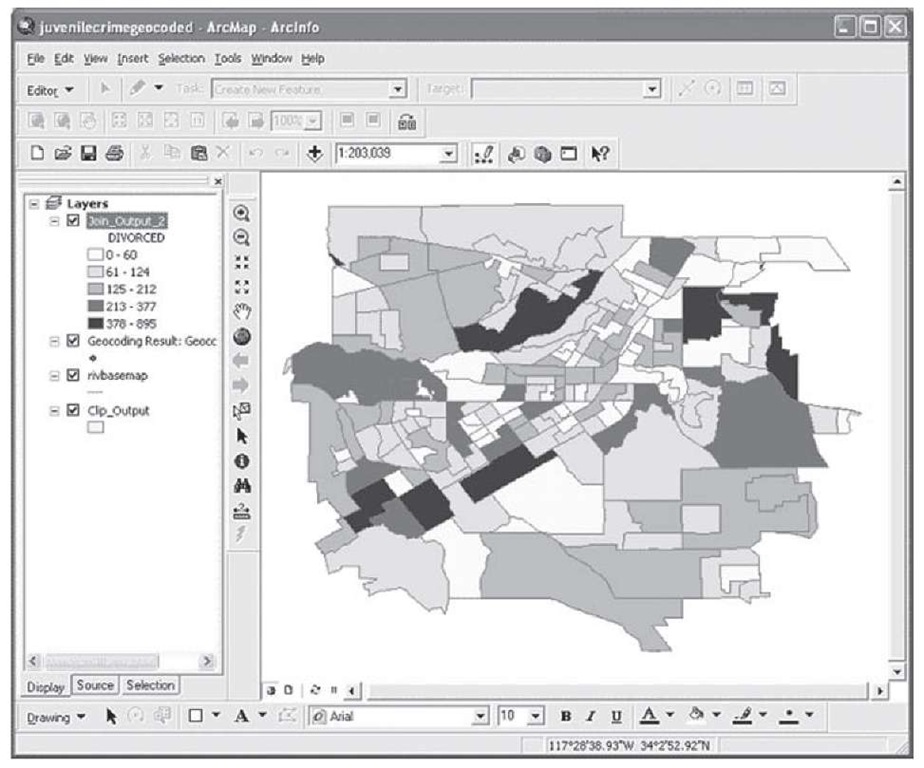
Notice the changes in the map. The symbology now reflects the number of divorced individuals by block group in Riverside as according to the U.S. Census 2000 data. The results should look something like the map in Figure 1.97.
FIGURE 1.97 Thematic map of divorce, Riverside, 2000
Compare the results of the map of divorces with the map of the instances of juvenile crime to look for correlations. The comparison shows that while the areas of high juvenile crime are not the areas with the highest number of divorces, they are in areas with relatively high divorce when compared to the areas lower in juvenile crime. Using the additional census variables contained in the data, experiment with different symbology schemes to find out if any of the other census variables have a significant relationship with the instances of juvenile crime. When you are finished, you may exit out of ArcMap without saving the maps of the census variables. You have completed the thematic mapping section.
Conclusion
In this section you have learned a great deal about coding, and the basics of how to get your data into a map. You have also learned how to display these data in useful ways with the thematic map, and along the way you have done some basic analysis of the relationships the data show when examined in a geographic context. You can see already the powerful way relationships and the differences across space and geographic, political, or administrative boundaries can be shown on these maps. But this is only the basics; you can now use the techniques you have learned to produce some very powerful and interesting maps that address public policy, history, social relations, and economic and political change—at the neighborhood level, the city level, the state level, the national level, and across the world.
Section 2 explores the power of maps for combining data from different sources and many variables and relationships simultaneously. Once you learn how to make maps that convey complex information in accessible and powerful forms, you will begin to see the benefits of GIS as a tool for research, policy, and making the places we live in better, safer, and healthier. However, all of the techniques in the next section are based on the knowledge you have gained by the end of Section 1. Proceed to Section 2 and see how what you have learned can be put to powerful uses.
