Introduction
The tachograph is a device fitted to motor vehicles which makes a recording on a paper chart of the speeds traveled and distances driven, together with details of the driver’s periods of work and rest. It is most widely used in the countries of the European Union, where it is a requirement in most larger goods and passenger-carrying vehicles.
This article lays particular emphasis on the instrument as it is specified in EU Regulations, although the principles of chart analysis and the use of tachograph data described here are applicable to all types of machine. In any case, the user of tachograph data must be aware of the characteristics of the particular make and model from which it comes in order to appreciate the amount of information available and its limitations. The present range of models is large and new instruments appear from time to time; this article cannot therefore cover every detail of every instrument which will be encountered.
The Forensic Use of Tachograph Data
Tachograph data has two forensic applications:
1. in road accident investigation, to determine speeds at and immediately before an incident, the rate of braking, and the manner of driving;
2. in general criminal investigation, to find the route traveled and the time that a vehicle was at a particular location.
The Tachograph Chart
Figure 1A and 1B shows typical tachograph charts, and illustrate the information provided by the instrument. The shape and design are not specified by the EU regulations, but the chart pattern shown here has become the standard for the industry. Other designs do exist, but the instruments which require them are obsolescent.
The chart is a disc (123 mm in diameter) coated with a material which blackens under pressure. In the center is an area where the driver writes his name, the starting and finishing places for his day’s driving, the date, vehicle number and odometer readings.
Printed round the edge of the chart, and repeated further in, is the time scale of 24 h. Between these is the field where the speed is recorded, usually with a maximum of 125 kmh-1. Further in is the work mode field, where the driver indicates whether he is driving, engaged on other work, or resting. The indication is made either by the track in which the recording line runs (Fig. 1a) or by the thickness of the line (Fig. 1b). It is sometimes possible to extract useful information from the mode of work line when the vehicle has been moving very slowly.
The innermost recording is of distance, shown by a zig-zag line. One stroke of this line is made during 5 km of travel; a complete V indicates 10 km of movement, whereas other distances will create partial strokes.
The Tachograph Instrument
All current models of tachograph combine their function with that of a speedometer, and are therefore designed to be mounted in a vehicle’s dashboard. Figures 2 and 3 show two modern instruments. Externally they have the usual speedometer features – a speed dial and an odometer display – together with a clock and knobs with which the driver and a colleague can indicate their modes of work. (Most instruments hold two charts to cater for there being two drivers crewing the vehicle.)
In the majority of instruments the chart lies behind the face, which is hinged to open downward to allow insertion and removal. Figure 4 shows an open instrument with a chart in place. The spindle on which it is mounted rotates once in 24 hours. When the instrument is closed the chart bears against three styluses which move up and down to make the recordings. The spindle and the hole in the center of the chart are oval to ensure the correct orientation of the chart with respect to time.
With the instrument in Fig. 3 the charts are inserted through two slots in the base, from where they are automatically positioned against the recording styluses.
Tachographs may operate either mechanically or electronically. Mechanical types, in which a rotating cable from the vehicle gearbox drives a cup-and-magnet system, are now obsolescent. Typical models are the Kienzle 1311 and the Veeder Root 1111. Electronic types receive a train of pulses from a transducer at the gearbox, the frequency of which is translated as speed. There are many models, for example: Motometer EGK100, Jaeger G.50 and G.51, Kienzle 1314, 1318 and 1319, Veeder Root 1400, 8300 and 8400.
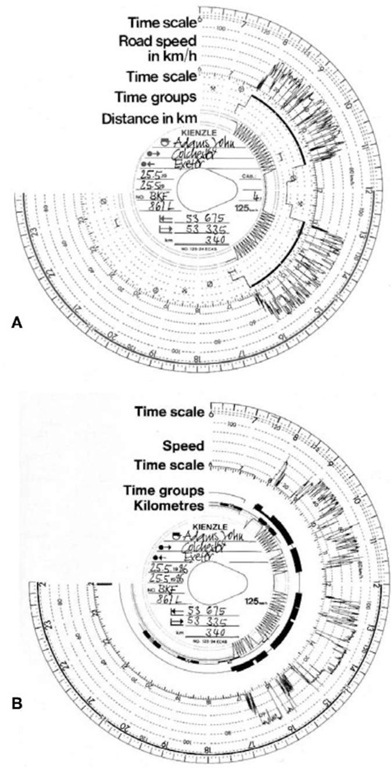
Figure 1 Tachograph chart showing recordings with (A) ‘manual’ time group recordings and (B) ‘automatic’ time group recordings.
The Principles of Chart Analysis
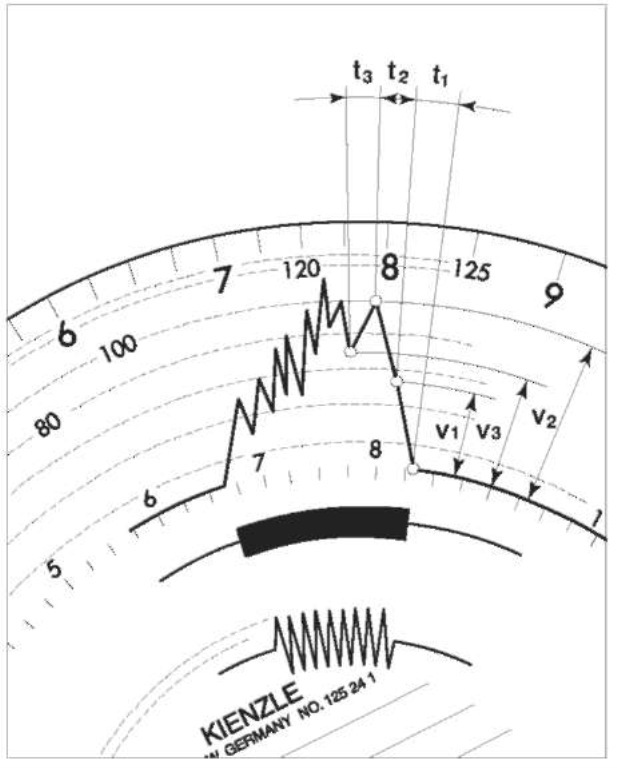
Figure 5 shows a schematic tachograph trace and the quantities to be measured in an analysis. The speed trace is thought of as a series of points connected by straight lines. The speed at each point (vi, v2, v3)is measured, as are the time intervals between them (ti, t2, t3). This provides a plot of speed against time, which can then be integrated to yield a plot of speed against distance. Figure 6 shows a real tachograph trace, Table 1 the tabulated analysis, and Figure 7 the resulting plot. (This trace and analysis is used for the case example at the end of this article.)
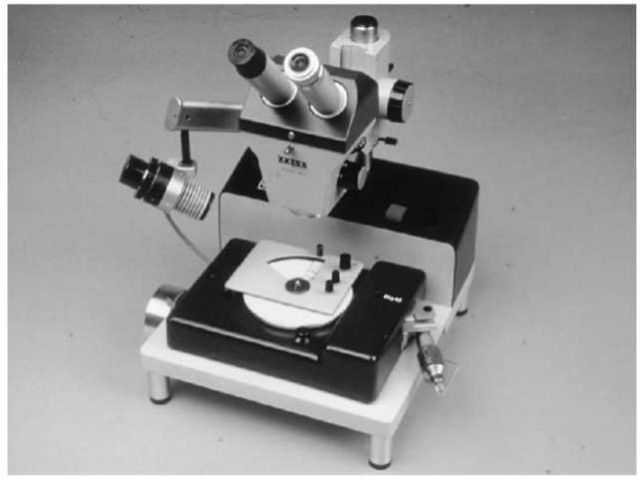
There are various approaches to making these measurements. Taking the speed from the chart is relatively straightforward, and can be done from a photographic enlargement or with a traveling microscope. Allowance has to be made for the accuracy of the speed recordings. Measurement of the time intervals is, however, not at all easy. Because the chart rotates just once in 24 hours, one minute occupies only 0.25°, and in one second it turns through only 15 seconds of arc. It is usual to mount the chart beneath a microscope on a rotating table which is turned by a micrometer.
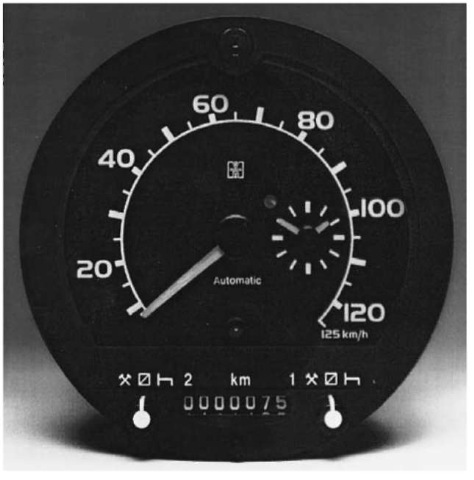
Figure 2 The face of a Veeder Root model 8400 tachograph.
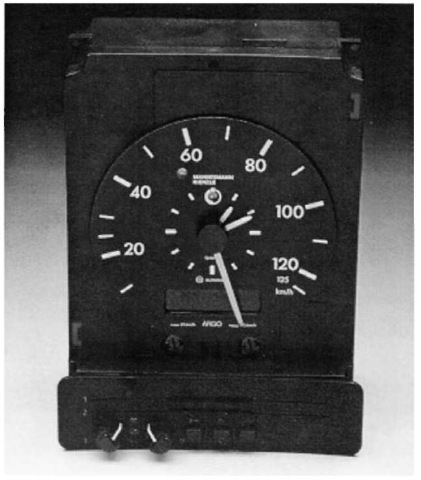
Figure 3 The face of Kienzle model 1319 tachnograph. The charts are inserted through the slots in the base.
Figure 8 shows one such microscope, as produced by VDO Kienzle. A glass plate etched with a vertical cursor line, 3 um wide, lies over the chart, and this combines with a horizontal line in one eyepiece to form a ‘crosswire’ in the field of view. Points for measurement are brought successively under the crosswire by rotating the chart table and moving it backwards and forwards, and transducers are attached to these two movements. Signals from the transducers, which are interpreted as time and speed, are fed to a microcomputer, where listings of these quantities and graphs of speed versus time and distance are produced.
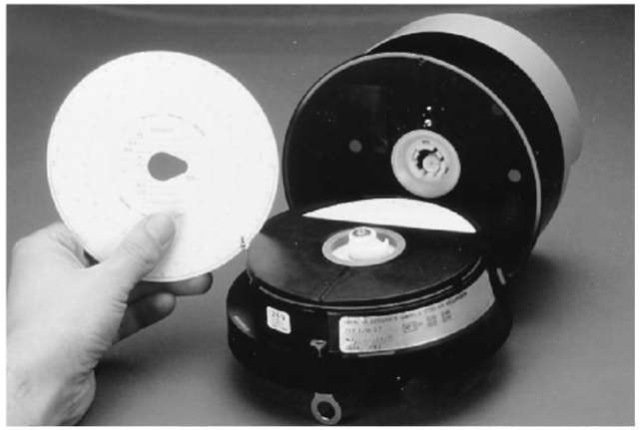
Figure 4 An opened Kienzle model 1318 tachograph showing the insertion of a chart.
Figure 5 Schematic speed trace showing time intervals and speeds.
It is very important to recognize when measuring time intervals that the line along which the recording stylus moved was unlikely to have passed exactly through either the center of rotation of the chart when mounted on the microscope or when mounted in the tachograph instrument, or through the geometric center of the chart itself. This is illustrated in exaggerated form in Fig. 9. If the vertical cursor is not arranged such that it lies along the line on which the stylus moved, any time intervals measured between
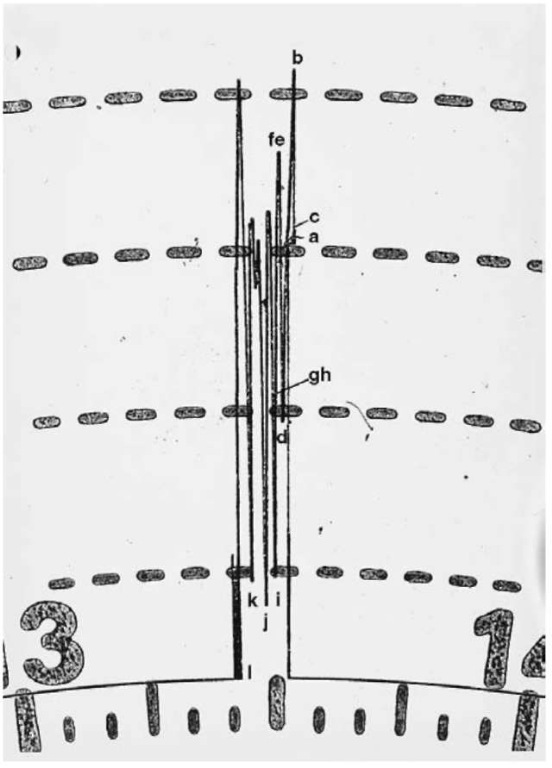
Figure 6 A real tachograph speed trace with analysis points.
Table 1 Data from tachograph chart shown in Fig. 6: the analysis points a … / run backwards from the end of the driving points at different speeds will be in error. In the VDO Kienzle microscope the glass plate carrying the cursor line can be swivelled about a point at the outer edge of the chart, and this adjustment is used to set the line in what the analyst judges to be the correct position.
| Point | Speed | Time | Distance |
| (kmh-1) | (s) | (m) | |
| a | _ | 0 | 0 |
| b | 81 | 0 | 0 |
| c | 61 | 32 | 630 |
| d | 38 | 67 | 1110 |
| e | 71 | 83 | 1355 |
| f | 71 | 87 | 1435 |
| 9 | 40 | 111 | 1805 |
| h | 39 | 116 | 1860 |
| / | 19 | 122 | 1905 |
The Accuracy of the Speed Record
The EU regulations require that having been installed and calibrated, the tachograph record may not have an error in its speed figures greater than +6kmh_1.
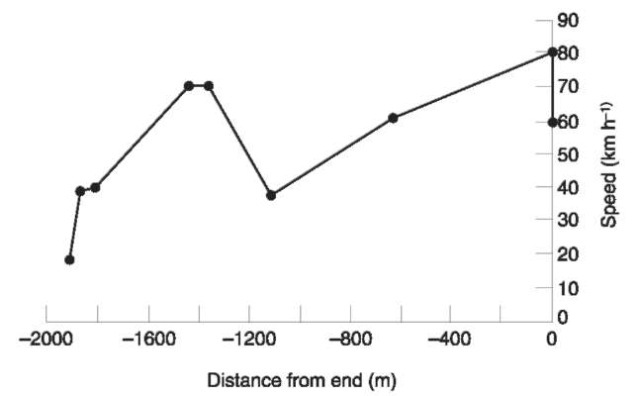
Figure 7 Plot of speed data from Fig. 6 against distance.
Figure 8 The Kienzle microscope with computer-linking modifications
The analyst may be content to use this as a probable error figure, but the author’s experience is that although the error is generally not greater than + 3kmh_1, there are occasional cases where it is substantially more than +6kmh_1. It is therefore desirable that the calibration in each case be checked, and various methods have been devised for this.
Calibration checks on the tachograph installation
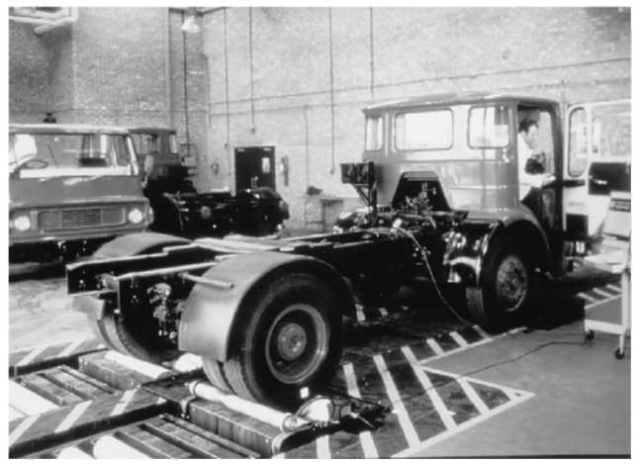
The most straightforward method of checking the accuracy of a tachograph system is to employ a ‘rolling road’ of the sort used when tachographs are installed in vehicles (Fig. 10). A chart is placed in the instrument, and the vehicle is then effectively driven through a range of known speeds. The chart will then show how each speed is recorded, from which the amount of error is found.
Some agencies find the rolling road method quite inconvenient, and instead use a method which requires no special facilities and which can be employed in any open space. The procedure is in two stages: first the signal sent from the vehicle’s gearbox is measured (either as pulses per kilometer in electronic systems or turns per kilometer in mechanical ones) in one of two ways, and then the way the tachograph instrument responds to a known set of input signals is found.
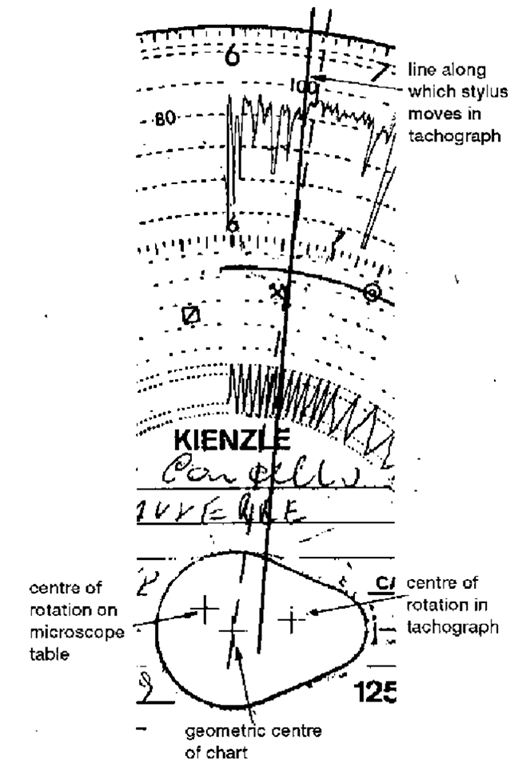
Figure 9 The need for an adjustable cursor when analyzing a chart.
Figure 10 Calibration of a tachograph installation on a Har-tridge Rolling Road.
The first of the two ways of measuring the signal is called the 20-meter track, and is one which may actually be used by some installers. It is fully described in manuals produced by tachograph manufacturers for the guidance of their agents. It is appropriate for vehicles which can be moved slowly in a straight line; thus they need not be fully mobile, and may have, for example, accident damage to the steering gear or the engine coolant system. The test can even be performed by towing the vehicle.
In this method, the drive to the tachograph is either disconnected and a turn or pulse counter is attached to it, or, with later electronic models, a pulse counter is plugged into a socket in the head itself. The vehicle is then driven slowly on a straight and level surface for 20 m, the distance being measured exactly. From the number of pulses and the distance, the rate per meter is calculated: this is usually referred to as the w figure.
The second way is called the static method, and is appropriate for vehicles which cannot be moved, either through accident damage or through restriction of space. In this method a turn or pulse counter is attached in the same way as in the 20-metre track method. One of the driven wheels of the vehicle is then lifted off the ground and its circumference is measured with a tape; later the other driven wheels are also measured. The raised wheel is then rotated manually ten times and the resulting turn or pulse reading noted. From these data the w figure can be calculated, remembering to take account of the effect of the axle differential, since in general ten turns of a single wheel is equivalent to five turns of the whole axle.
If the accident damage is so great that neither of these methods can be used, the investigator may have to resort to examining gear trains and counting gear teeth.
Having determined w, the response of the tachograph instrument itself is found by driving it in steps through its speed range with a sequence of signals generated by a specially constructed test unit. These units are produced by the tachograph manufacturers for the use of their installation agents, and display either the mechanical rotation rate or the electronic pulse rate (in units of min-1). A new tachograph chart is put in the instrument and a test chart similar to that in Fig. 11 is produced.
The sequence of tests in Fig. 11 are as follows.
1. The instrument is taken up to its maximum speed (140 km h-1 in this example) and then very quickly back to zero to check the straightness of the recording stylus movement;
2. This is repeated three times;
3. Next the instrument is taken to an indicated speed of 60kmh-1: at this speed the input figure (in min- 1) is known as the characteristic coefficient or k figure, and should be, in a correctly calibrated system, approximately equal to the w figure of the vehicle;
4. The speed is taken from zero up to the maximum in 20 km h_1 steps, holding each step for two minutes, and then back down to zero at the same speeds between the steps (130kmh_1, 110kmh_1 etc.);
5. Finally, the instrument is run at 60 km h_1 for as long as it takes 1 km to be recorded on its odometer, and the actual number of turns or pulses delivered is noted: this should equal the k figure; during the last test the activity mode switch is also changed through its four settings.
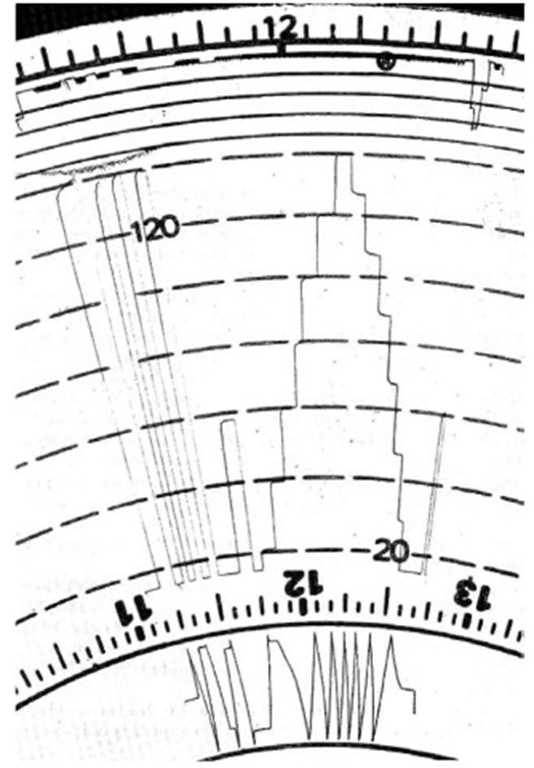
Figure 11 A typical head test chart.
The information from part (4) of the test can now be used, together with the w figure, to construct a graph of how the recording on the chart at any point relates to the true speed. This can be done manually or by using the software associated with the VDO Kienzle computer-linked microscope.
The ‘route-trace’ method of calibration
An alternative to the direct methods of calibration is the so-called route-trace method. This can only be used when the route the vehicle has taken is known, and is particularly appropriate when the vehicle is unavailable for testing or has been so seriously damaged as to make the other methods impossible. The tachograph record can also be used to find the route that a vehicle has taken (see below). The calibration method is an inversion of this procedure, and briefly involves attempting to match the recorded pattern of driving to the known route. A system which is in calibration will give an immediate match, whereas one which is out of calibration will require an adjustment of its speeds by some factor before the match is found. Thus the calibration method is one of finding what this adjustment factor is.
Problems of Interpretation
Once the cursor on the analyzing microscope has been correctly aligned and the errors, if any, in the speed record have been determined, the chart can be analyzed. However, the limitations of the recording and the individual instruments must be recognized.
Time intervals
The clock in most tachograph instruments advances the chart in one-second steps and it is, therefore, not possible in principle to measure time intervals with a precision greater than + 2 s. In any case the edge of the speed recording trace is insufficiently smooth for these steps to be resolved. With a good trace, a confidence of + 2s can probably be assumed, but in some instruments an unsteadiness will be evident which means that wider uncertainty must be accepted. It is found that although some manufacturers’ instruments yield consistently good traces, other manufacturers produce tachographs which are invariably poor.
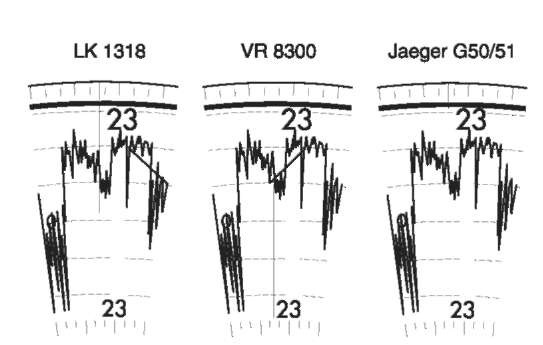
Figure 12 shows an example of a poor trace. The drive train from the clock to the chart is somewhat loose, and as well as allowing a generally unsteady speed trace as the stylus moves up and down, it permits the stylus, as it falls after rising to a maximum, to track back along the groove it has made on the chart instead of drawing a new line. This effectively drives the clock backwards for a few seconds (20 s being typical) until the slack is taken up, and only then will the stylus start to follow a new track.
Impacts to the vehicle
A severe impact to the vehicle will generally produce a disturbance of the tachograph recording traces (Figs 6 and 13). When such a disturbance is apparent on the speed trace, it is obviously an indication of the speed of the vehicle at the moment of impact and is an item of information easily read from the chart.
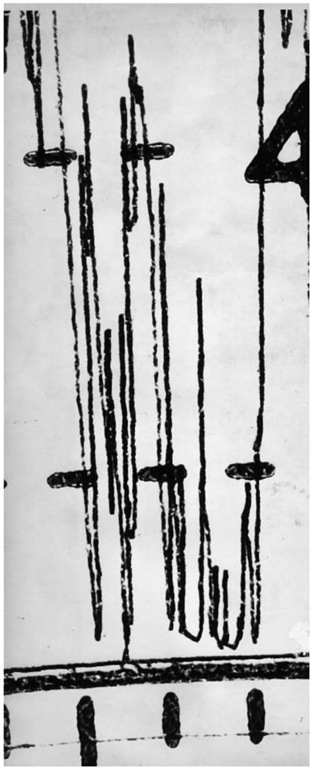
Figure 12 An unsteady trace from a Jaeger instrument.
However, some caution is needed before interpreting it. The disturbance is properly caused by a shock to the tachograph itself, and its magnitude therefore depends on the proximity of the impact to the instrument. A collision with a pedestrian, where the pedestrian meets the vehicle very close to the instrument panel, can cause a clear disturbance, whereas a severe impact from another vehicle to the rear of an articulated lorry may have little or no effect on the recording.
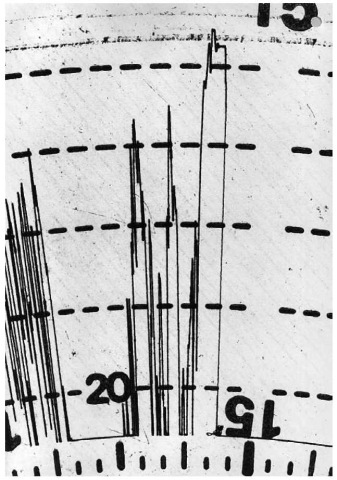
Figure 13 Chart showing lock-up and impact at zero speed.
If heavy braking is taking place at the time of the impact, the speed at which the disturbance appears may be affected by other factors.
Finally, a severe impact will often derange the instrument for at least a few seconds, such that little or no reliance can be placed on any features which may immediately follow it.
Response of the instrument
The EU Regulations require tachograph instruments to be able to follow ‘acceleration changes’ of 2 m s-2. Since during braking the deceleration of a vehicle may well be as much as 7m s-2, there is the possibility that the speed-recording stylus may not be able to keep up with the changing speed. This does not, in fact, appear to be a problem in Kienzle, Motometer, Jaeger and mechanical Veeder Root tachographs, but there is a difficulty with electronic Veeder Root instruments. Earlier Veeder Root 1200 and 1400 series tachographs only just met the 2 m s- 2 requirement; early 8300 series models had a response of 2.5m s-2, whereas later 8300 series and all 8400 series models have a response of 5.7m s-2. The consequence of a response of 2 or 2.5 m s- 2 is that during heavy braking the speed being recorded at any moment will be greater than the true speed, and any event recorded during the braking, for example an impact, will be shown at too high a speed. It also means that it is not possible for an analyst to give an opinion as to whether a particular piece of braking was at a normal or an emergency rate.
A response of 5.7 m s- 2, however, is much closer to the braking rate which can be expected of a lorry in an emergency, and will generally allow a reasonable speed for an impact to be recorded.
An even higher response rate leads to a difficulty where there has been wheel slip during braking.
Tyre slip effects
The tachograph records the speed of rotation of the wheels to which it is connected: almost always the driven wheels of the vehicle. Therefore, if for some reason those wheels slip, i.e. rotate at a speed which does not correspond to the speed of the vehicle over the ground, the recording will be in error.
Wheel slip particularly occurs during heavy braking, notably when the driven wheels lock. An instrument with a fast response will react to wheel locking as though the vehicle had instantaneously come to a halt: the stylus will fall very quickly to its base position even though the vehicle is still traveling forward, and an impact may even appear to have been at zero speed. An example is shown in Fig. 13, where, because the vehicle has skidded, the prominent impact feature will certainly be at a level much lower than the true speed. The operation of an antilock braking system will also cause the speed of the wheels to be less than the road speed of the vehicle.
The opposite can occur if one of the driven wheels lifts off the road, allowing it to spin. This typically occurs as a vehicle starts to roll onto its side. In Fig. 14 the speed at C would appear to be that at which the accident occurred. In fact the correct speed is at B, from which the trace has jumped to C as the wheels on one side of the lorry lifted from the road.
Determining at which point the true recording ends is not always a simple matter in these cases, but can often be resolved by using the route-trace method (see below).
Low speed behavior
Incidents at low speed cause particular problems in the interpretation of tachograph data because all instruments have a level below which they do not record speed. In all current models this is about 5kmh- 1, although in some older instruments it is somewhat higher, up to 16kmh-1. It cannot therefore be said, for example, whether a vehicle which has slowed before entering a main road actually stopped or merely reduced its speed to, say, 5 km h- 1 before proceeding. Nor may it be possible to say whether or not during an apparent stationary period the vehicle was moved a small distance.
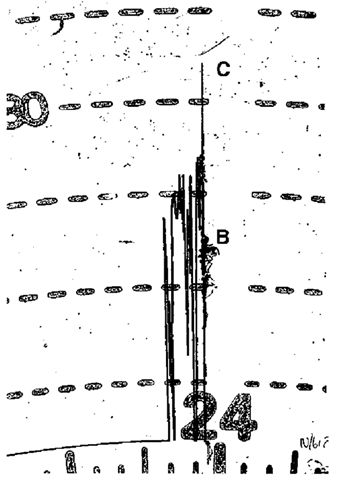
Figure 14 Spin-up in roll-over.
Some information can, however, be gained from the mode-of-work trace. Movement of the vehicle generates a thicker line, made by an oscillation, or an increased oscillation, of the recording stylus (see the examples in Fig. 1). A small gap in the thick line can be taken as a brief stationary period.
The threshold for this thick line depends on the model. Mechanical instruments will produce a noticeable movement in the stylus only when the vehicle has moved for about 20 m or more. Electronic instruments have a critical speed at which the line is made. The mode trace in Kienzle 1318 and 1319 instruments, however, operates during driving in the same way as the zig-zag distance trace, making one stroke over a distance of 50 m.
Falsifications and Diagnostic Signals
Tachographs have always been prone to attempts by drivers to falsify the recordings, either to show lower speeds or shorter hours of work. Most falsifications are readily apparent on careful examination, for example by comparing the apparent average speed during a journey with the recorded distance and the time taken, or by comparing the total recorded distance for the day’s driving with the difference in the hand-written odometer figures. Figure 15 shows a commonly attempted falsification, where driving has stopped at 1736, the clock has been rewound, and driving has resumed, apparently earlier, at 1623.
The scope for such tampering is greatly increased with electronic instruments, and therefore various ‘diagnostic’ features are incorporated in them to show when certain irregularities occur. These depend on the individual models of instrument, and a full account of them is beyond the scope of this article. However, two examples are as follows.
If the pulse sender is disconnected in an attempt to make it appear that the vehicle is not being driven, the speed stylus will oscillate between zero and, typically, 30kmh_1 to make a broad band (Fig. 16).
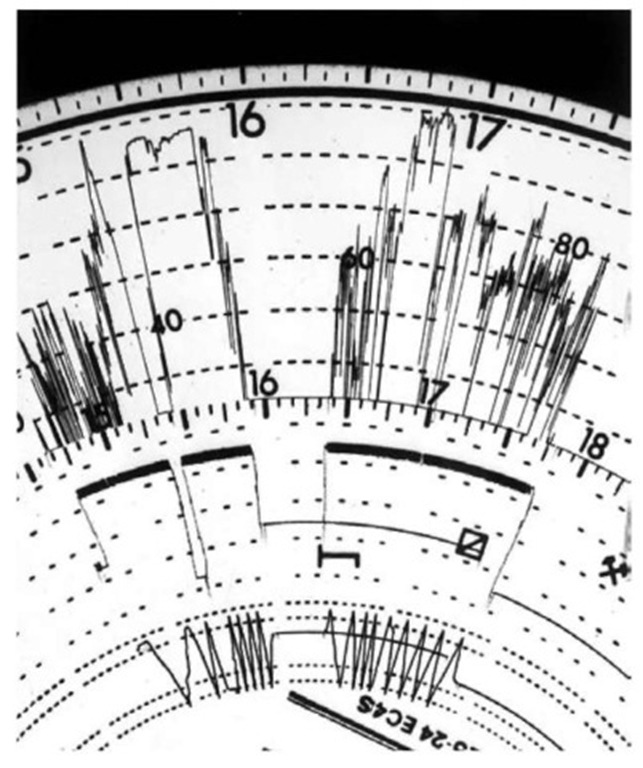
Figure 15 Fraudulent rewinding of tachograph clock. The overlapping traces show that the time was turned back from 1736 hrs to 1623 hrs.
If the electrical supply to the instrument is interrupted, in an attempt to halt recording for a period, then, on reconnection, the speed stylus will execute a characteristic movement, for example a full-scale deflection or a dip to zero speed (Fig. 17).
Other attempts at falsification which can be more difficult to detect include connecting the wires from the pulse sender to earth; reducing the voltage to the tachograph, such that the clock continues to operate but the other electronic systems fail; connecting certain spare terminals on the back of the instrument together, again to cause some of the electronic functions to fail.
Case Example
Figure 6 is an enlarged section of a tachograph recording made by a tourist bus which came into collision with a pedal cycle. The bus had been on a slip road, approaching a main dual-carriageway road. The pedal cyclist was travelling on the main road, and appears to have cut suddenly across the path of the bus. The bus driver braked hard and swerved to his right. Figure 18 shows the route the bus had taken to the scene of the accident.
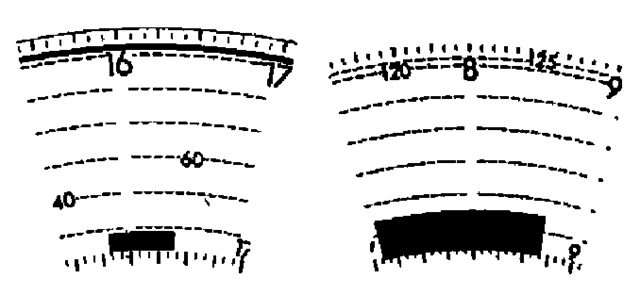
Figure 16 Broad trace generated when speed transducer is disconnected.
Figure 17 Diagnostic features produced by power interruption.
The results of the detailed analysis, given in Table 1 and plotted in Fig. 7, indicate that (point f)about 120 s before the accident the speed of the bus was at a minimum of 19kmh-1, and that it was about 1900 m from the scene of the accident. Its speed then increased to a maximum (points f and e)of 71 km h- 1 before falling to another minimum (point J)of38kmh-1. It was then about 67s and 1110m from the end.
Again the speed increased, reaching its final maximum (point b)of81 kmh-1 immediately before the collision. There was then heavy braking to a sudden disturbance of the trace (point a), which on the chart is at an indicated speed of 60 km h- 1. However, the time interval between a and b is too small to measure, and at the scene locked wheel skid marks were found from the rear wheels on one side of the vehicle. The rapid fall of the recording trace between the last two points has clearly occurred as a result of the locking of these driven wheels, which accounts for the immeasurably small time interval and also means that the figure of 60 km h- 1 (because of the characteristics of the particular instrument) is probably significantly less than the speed at which the disturbance occurred.
The disturbance itself consists of a thickening of the trace, caused by a small shock to the stylus, followed by a step to the left (i.e. ‘backwards’ in time). The shock would have been caused by the impact at the front of the bus with the pedal cycle, whereas the sudden swerve would have brought about some sideways movement of the components of the tachograph instrument, to create the step to the left.
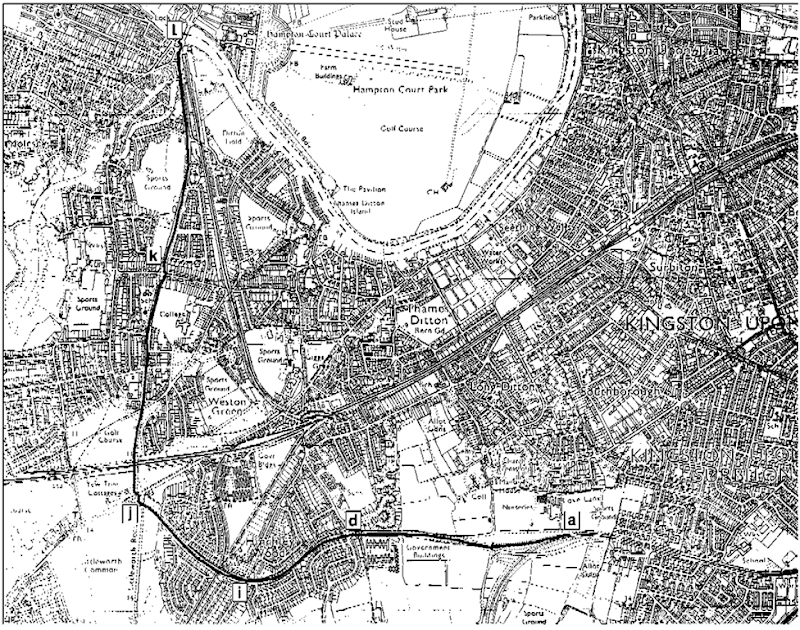
Figure 18 Section of Ordnance Survey map showing route of vehicle as determined from the tachograph recording in Figure 6.
Route tracing
The two minimums of speed in Table 1 lie at distances from the end which, on an accurate map, can be readily identified with a roundabout (point d) and an intersection (point i). When the analysis is extended back to the start of the driving, two further minima and the start of the journey itself can be matched to a complex road junction and two more roundabouts (points /, k and / in Fig. 5). Some very slow driving before point / indicates that the bus started its driving from a place just before the roundabout.
In the context of a road accident, the matching of the trace to a known route serves to confirm the accuracy of the analysis process and of the calibration of the tachograph installation. If it had not been possible to check the calibration independently, this matching, with any necessary adjustment of the speed figures, could have been used as a calibration procedure in itself.
However, if it is imagined that, in different circumstances, the route of the vehicle was unknown and there was a need for it to be found, it can be seen that working back from the known end point (a) it would be possible to do so by comparing distances between speed minimums with distances on a map between road junctions. A typical case where this method is applied would be where a vehicle carrying a valuable load is stolen from a known location X, driven to an unknown place Y and unloaded, then driven to a third place Z and abandoned. From its tachograph record it may be possible to locate Y by tracing back from Z or forward from X. The success of this method depends on traffic conditions; in heavy traffic the vehicle may have had to stop so many times at places other then road junctions that following its route becomes impossible.
