Identification Confidence
In this section, we present an automated technique for assessing the quality of the fitting in terms of a fitting score (FS). We show that the fitting score is correlated with identification performance and hence, may be used as an identification confidence measure. This method was first presented by Blanz et al. [9].
A fitting score can be derived from the image error and from the model coefficients of each fitted segment from the average.
Although the FS can be derived by a Bayesian method, we learned it using a support vector machine (SVM) (see Vapnik [44] for a general description of SVM and Blanz et al. [9] for details about FS learning).
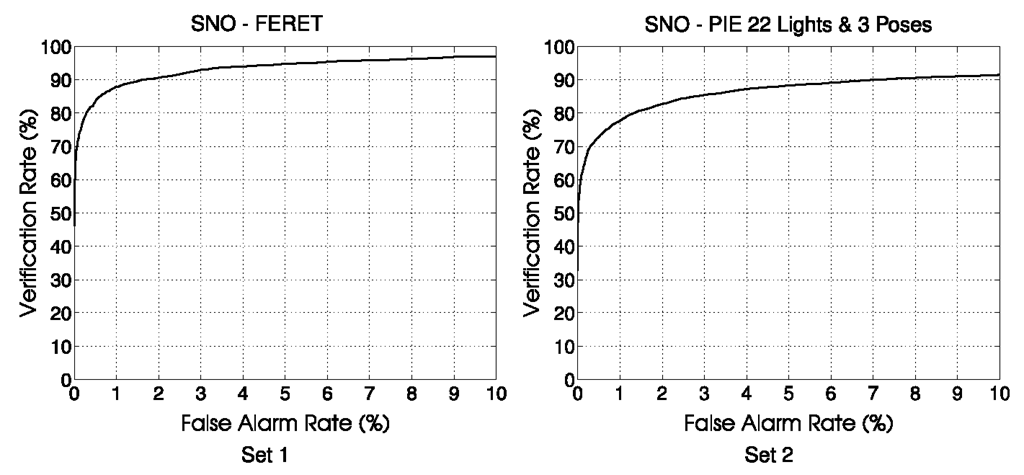
Fig. 6.7 Receiver operator characteristic for a verification task obtained with the SNO algorithms on different sets of images
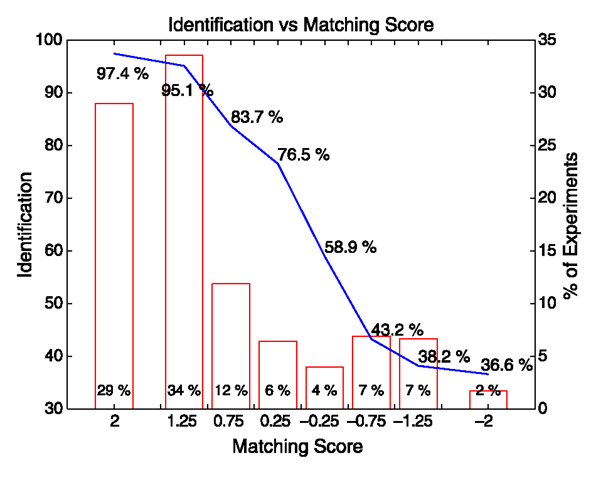
Fig. 6.8 Identification results as a function of the fitting score
Figure 6.8 shows the identification results for the PIE images varying in illumination across three poses, with respect to the FS for a gallery of side views. FS > 0 denotes good fittings and FS < 0 poor ones. We divided the probe images into eight bins of different FS and computed the percentage of correct rank 1 identification for each of these bins. There is a strong correlation between the FS and identification performance, indicating that the FS is a good measure of identification confidence.
Virtual Views as an Aid to Standard Face Recognition Algorithms
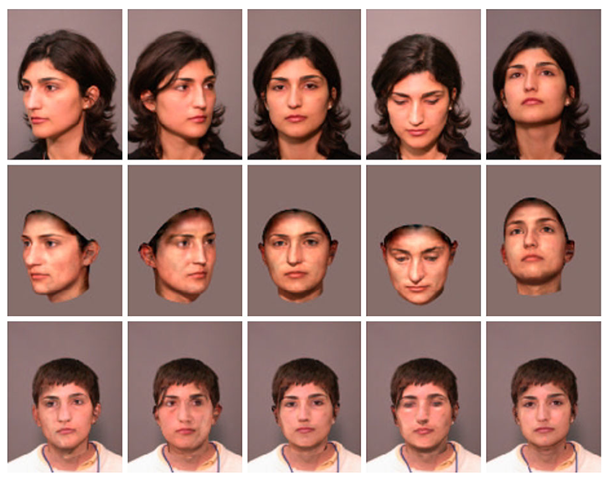
The face recognition vendor test (FRVT) 2002 [35] was an independently administered assessment, conducted by the U.S. government of the performance of commercially available automatic face recognition systems. The test is described in Sect. 14.2 of Chap. 14. It was realized that identification of face images significantly drops if the probe image is nonfrontal. This is a common scenario, because the gallery images are typically taken in a controlled situation, while the probe image might only be a snapshot by a surveillance camera. As there are far fewer probe images than gallery images, it is feasible to invest preprocessing time into the probe image, while a preprocessing of the huge gallery set would be too expensive. Hence, one of the questions addressed by FRVT02 is this: Do identification performances of nonfrontal face images improve if the pose of the probe is normalized by our 3D Morphable Model? To answer this question, we normalized the pose of a series of images [8] which were then used with the top performing face recognition systems. Normalizing the pose means to fit an input image where the face is nonfrontal, thereby estimating its 3D structure, and to synthesize an image with a frontal view of the estimated face. Examples of pose-normalized images are shown in Fig. 6.9. As neither the hair nor the shoulders are modeled, the synthetic images are rendered into a standard frontal face image of one person. This normalization is performed by the following steps.
1. Manually define up to 11 landmark points on the input image to ensure optimal quality of the fitting.
2. Run the SNO fitting algorithm described in Sect. 6.4.2 yielding a 3D estimation of the face in the input image.
3. Render the 3D face in front of the standard image using the rigid parameters (position, orientation, and size) and illumination parameters of the standard image. These parameters were estimated by fitting the standard face image.
4. Draw the hair of the standard face in front of the forehead of the synthetic image. This makes the transition between the standard image and the synthetic image smoother.
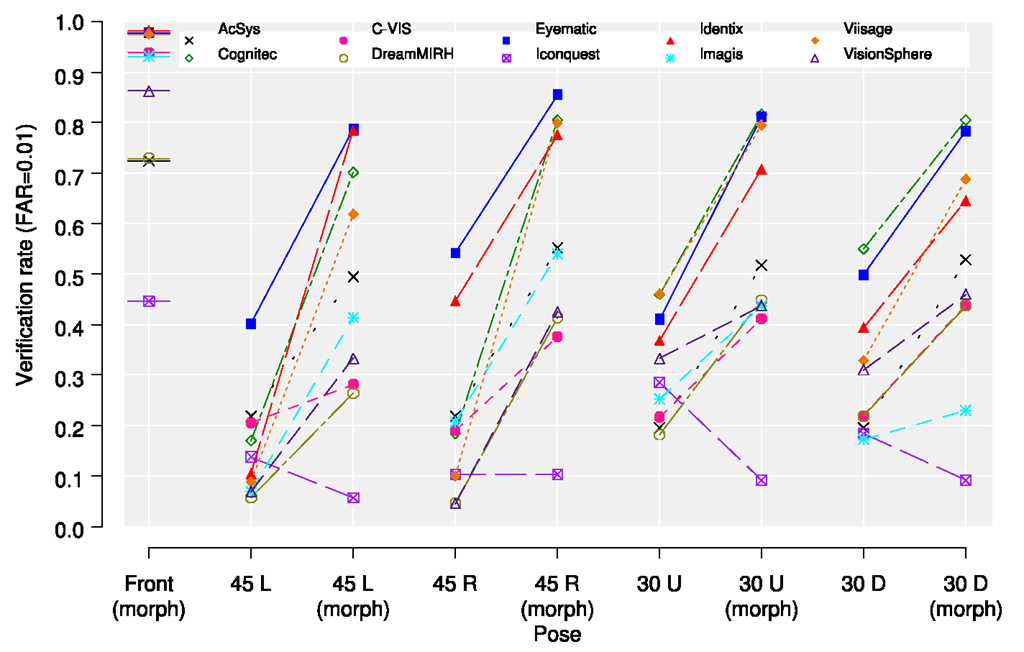
The normalization was applied to images of 87 individuals at five poses (frontal, two side views, one up view, and a down view). Identifications were performed by the 10 participants to FRVT02 using the frontal view images as gallery and nine probe sets: four probe sets with images of nonfrontal views, four probe sets with the normalized images of the nonfrontal views and one probe set with our preprocessing normalization applied to the front images. The comparison of performances between the normalized images (called morph images) and the raw images is presented on Fig. 6.10 for a verification experiment (the hit rate is plotted for a false alarm rate of 1%).
The frontal morph probe set provides a baseline for how the normalization affects an identification system. In the frontal morph probe set, the normalization is applied to the gallery images. The results on this probe set are shown on the first column of Fig. 6.10. The verification rates would be 1.0, if a system were insensitive to the artifacts introduced by the Morphable Model and did not rely on the person’s hairstyle, collar, or other details that are exchanged by the normalization (which are, of course, no reliable features by which to identify one person). The sensitivity to the Morphable Model of the 10 participants ranges from 0.98 down to 0.45. The overall results showed that, with the exception of Iconquest, Morphable Models significantly improved (and usually doubled) performance.
Fig. 6.9 From the original images (top row), we recover the 3D shape (middle row), by SNO fitting. Mapping the texture of visible face regions on the surface and rendering it into a standard background, which is a face image we selected, produces virtual front views (bottom row). Note that the frontal-to-frontal mapping, which served as a baseline test, involves hairstyle replacement (bottom row, center)
If there is also pose or illumination variation in the gallery, and enough resources are available then an identification directly in the normalized 3D Morphable Model space as proposed in [7].
Face Identification on 3D Scans
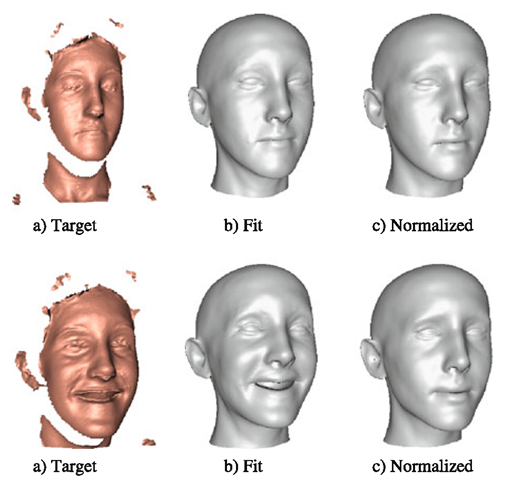
In this section, we describe an expression-invariant method for face recognition by fitting an identity/expression separated 3D Morphable Model (see Sect. 6.2.6) to shape data and normalize the resulting face by removing the pose and expression components. The results were first published in [2]. The expression model greatly improves recognition and retrieval rates in the uncooperative setting, while achieving recognition rates on par with the best recognition algorithms in the face recognition great vendor test. The fitting is performed with a robust nonrigid ICP algorithm (a variant of [1]). See Fig. 6.11 for an example of expression normalization. The expression and pose normalized data allow efficient and effective recognition.
Fig. 6.10 The effect of the original images versus normalized images using the 3D Morphable Models. The verification rate at a false alarm rate of 1% is plotted.
A 3D MM has been fitted to range data before and the results were even evaluated on part of the UND database [11]. The approach used here differs from [11] in the fitting method employed, and in the use of an expression model to improve face recognition. Additionally, our method is fully automatic, needing only a single easy to detect directed landmark, while [11] needed manually selected landmarks.
We evaluated the system on two databases with and without the expression model. We used the GavabDB [32] database and the UND [14] database. For both databases, only the shape information was used. The GavabDB database contains 427 scans, with seven scans per ID, three neutral and four expressions. The expressions in this dataset vary considerably, including sticking out the tongue and strong facial distortions. Additionally it has strong artifacts due to facial hair, motion and the bad scanner quality. This dataset is typical for a noncooperative environment. The UND database was used in the face recognition grand challenge [36] and consists of 953 scans, with one to eight scans per ID. It is of better quality and contains only slight expression variations. It represents a cooperative scenario.
The fitting was initialized by detecting the nose, and assuming that the face is upright and looking along the z-axis. The nose was detected with the method of [41].
Fig. 6.11 Expression normalization for two scans of the same individual. The robust fitting gives a good estimate (b) of the true face surface given the noisy measurement (a). It fills in holes and removes artifacts using prior knowledge from the face model. The pose and expression normalized faces (c) are used for face recognition
The GavabDB database has the scans already aligned and the tip of the nose is at the origin. We used this information for the GavabDB experiments. The same regularization parameters were used for all experiments, even though the GavabDB data is more noisy than the UND data. The parameters were set manually based on a few scans from the GavabDB database. We used 250 principal identity components and 60 expression components for all experiments.
In the experiments, the distances between all scans were calculated, and we measured recognition and retrieval rates by treating every scan once as the probe and all other scans as the gallery. Both databases were used independently.
Results
As expected, the two datasets behave differently because of the presence of expressions in the examples. We first describe the results for the cooperative and then for the uncooperative setting.
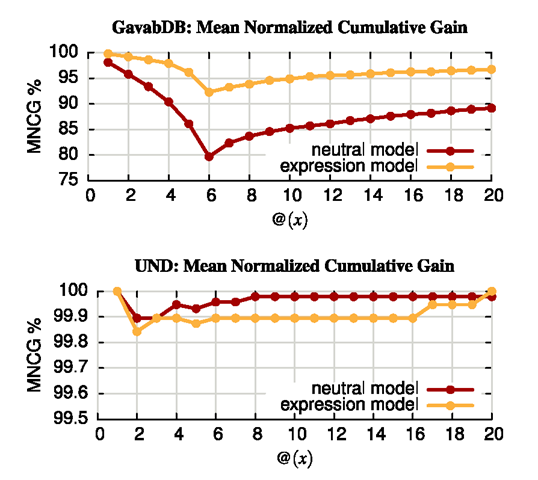
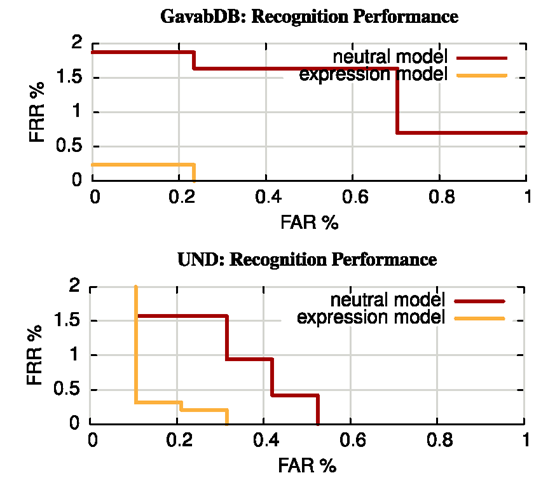
UND For the UND database, we have good recognition rates with the neutral model. The mean cumulative normalized gain curve in Fig. 6.12 shows for varying retrieval depth the number of correctly retrieved scans divided by the maximal number of scans that could be retrieved at this level. From this it can be seen that the first match is always the correct match, if there is any match in the database. But for some probes no example is in the gallery. Therefore for face recognition we have to threshold the maximum allowed distance to be able to reject impostors. Varying the distance threshold leads to varying false acceptance rates (FAR) and false rejection rates (FRR), which are shown in Fig. 6.13. Even though we have been tuning the model to the GavabDB dataset and not the UND dataset our recognition rates at any FAR rate are as good or better than the best results from the face recognition vendor test. This shows, that our basic face recognition method without expression modeling gives convincing results. Now we analyze how the expression modeling impacts recognition results on this expression-less database. If face and expression space are not independent, then adding invariance towards expressions should make the recognition rates decrease. In fact, while we find no significant increase in recognition and retrieval rates, the results are also not worse when including expression variance. Let us now turn towards the expression database, where we expect to see an increase in recognition rate due to the expression model.
Fig. 6.12 For the expression dataset the retrieval rate is improved by including the expression model, while for the neutral expression dataset the performance does not decrease. Plotted is the mean normalized cumulative gain, which is the number of retrieved correct answers divided by the number of possible correct answers. Note also the different scales of the MNCG curves for the two datasets. Our approach has a high accuracy on the neutral (UND) dataset
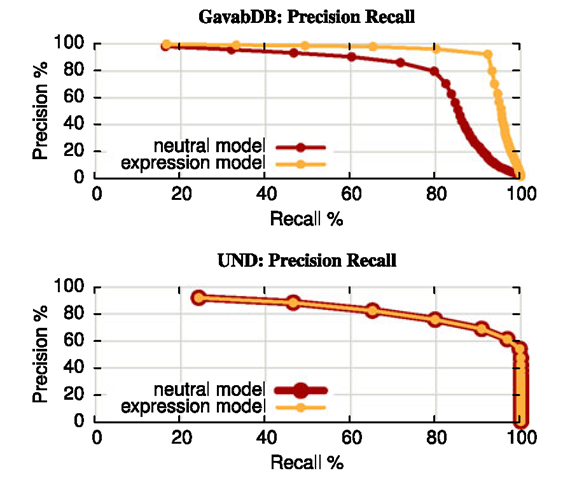
GavabDB The recognition rates on the GavabDB without expression model are not quite as good as for the expression-less UND dataset, so here we hope to find some improvement by using expression normalization. And indeed, the closest point recognition rate with only the neutral model is 98.1% which can be improved to 99.7% by adding the expression model. Also the FAR/FRR values decrease considerably. The largest improvement can be seen in retrieval performance, displayed in the precision recall curves in Fig. 6.14 and mean cumulative normalized gain curves in Fig. 6.12. This is because there are multiple examples in the gallery, so finding a single match is relatively easy. But retrieving all examples from the database, even those with strong expressions, is only made possible by the expression model.
Conclusions
We have shown that 3D Morphable Models can be one way to approach challenging real world identification problems. They address in a natural way such difficult problems as combined variations of pose and illumination. Morphable Models can be extended, in a straightforward way, to cope with other sources of variation such as facial expression or age.
Fig. 6.13 Impostor detection is reliable, as the minimum distance to a match is smaller than the minimum distance to a nonmatch. Note the vast increase in recognition performance with the expression model on the expression database, and the fact that the recognition rate is not decreasing on the neutral database, even though we added expression invariance. Already for 0.5% false acceptance rate, we can operate at 0% false rejection rate. false acceptance rate with less than 4% false rejection rate, or less than 0.5% FAR with less than 0.5% FRR
Fig. 6.14 Use of the expression model improves retrieval performance. Plotted are precision and recall for different retrieval depths. The lower precision of the UND database is due to the fact that some queries have no correct answers. For the UND database, we achieve total recall when querying nine answers, while the maximal number of scans per individual is eight, while for the GavabDB database the expression model gives a strong improvement in recall rate but full recall can not be achieved
Our focus was mainly centered on improving the fitting algorithms with respect to accuracy and efficiency. We also investigated several methods for estimating identity from model coefficients. However, a more thorough understanding of the relation between these coefficients and identity might still improve recognition performance. The separation of identity from other attributes could be improved, for instance, by using other features made available by the fitting, such as the texture extracted from the image (after correspondences are recovered by model fitting). Improving this separation might even be more crucial when facial expression or age variation are added to the model.
To model fine and identity-related details such as freckles, birthmarks, and wrinkles, it might be helpful to extend our current framework for representing texture. Indeed, linear combination of textures is a rather simplifying choice. Hence improving the texture model is subject to future research.
Currently our approach is clearly limited by its computational load. However, this disadvantage will evaporate with time as computers increase their clock speed. Adding an automatic landmark detection will enable 3D Morphable Models to compete with state of the art commercial systems such as those that took part in the Face Recognition Vendor Test 2002 [35]. For frontal images, 3D Morphable Model fitting has been completely automated in [13].
![tmpdece522_thumb[2][2] tmpdece522_thumb[2][2]](http://what-when-how.com/wp-content/uploads/2012/06/tmpdece522_thumb22_thumb.png)
