The previous section described a contrast enhancement technique whereby a linear scaling function was applied to all pixels, resulting in an image whose histogram was stretched so as to maximize the contrast. This section describes another point-processing enhancement method that entails applying a gray-scale lookup-table to each pixel in an image. This technique goes by many names, including "window/level", "density/level", "gray-level slicing", or in general "LUT" (a mnemonic for lookup table) processing. Here we will use the term window/level. The general window/level algorithm can be extended to perform a variety of other image transformations that are not covered in this topic, such as gamma correction. At the end of this section, two window/level implementations are discussed: one than runs on the Windows platform and another CCStudio program that uses "GEL" files to provide some measure of interactivity, allowing the user to dynamically change certain parameters driving the algorithm.
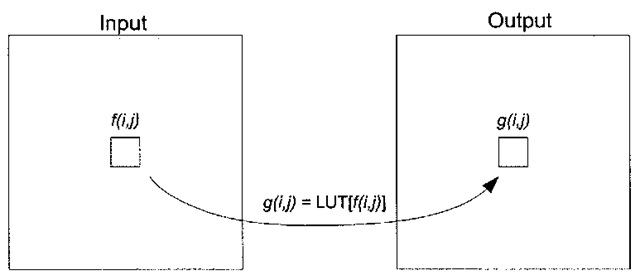
The basic concept behind window/level is to apply a linear gray-scale transform function, in the form of a lookup table (LUT) specified by two parameters, window and level. The end result is that pixel intensities corresponding to a subset of the entire dynamic range are highlighted, at the expense of those pixels falling outside the specified range. The LUT processing technique is depicted graphically in Figure 3-11, where each pixel in the input image /is mapped to the corresponding pixel in the output image g, with the new pixel intensity taking on a value specified by the LUT.
In Figure 3-12, a few examples of gray-scale transformation lookup tables are plotted. Figure 3-12a and 3-12b are linear LUTs, the class of transform functions we concern ourselves with in this section. Figure 3-12b shows a LUT where input pixels of intensity < 73 are mapped to 0, pixels of intensity > 198 are mapped to 255, and pixels within the range [74-197] are scaled appropriately depending on the slope of the transform function in the region bracketed by the dotted vertical lines.
Figure 3-11. Image transformation via gray-scale lookup table.
Figure 3-12. Three examples of 8-bit gray-scale LUT transform functions, (a) Nominal identity function, a one-to-one "transform" mapping the intensity range [0-255] to [0-255]. (b) Linear function highlighting pixels lying within the range [74-197], (c) Non-linear gamma transformation function.
Thus, those input pixels whose intensities lie within the range of interest are selectively contrast stretched.
The actual LUT values corresponding to Figure 3-12b are enumerated in Table 3-1.
Table 3-1. Actual contents of the LUT from Figure 3-12b
|
Input |
Output |
|
0 |
0 |
|
1 |
0 |
|
2 |
0 |
|
74 |
2.04 (2)* |
|
75 |
4.08 (4)* |
|
76 |
6.12 (6)* |
|
197 |
252.96 (253)* |
|
198 |
255 |
|
199 |
255 |
|
255 |
255 |
* transformed pixel intensities are rounded to fit into 8-bit integers.
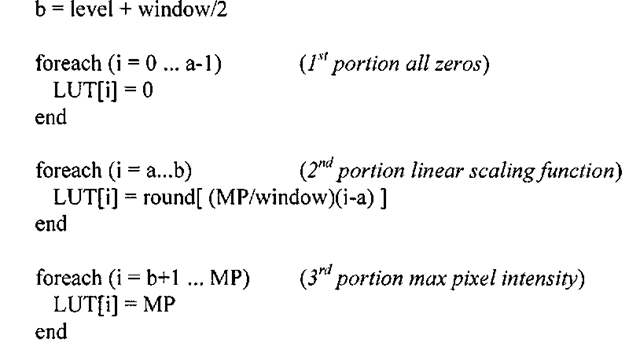
One way of specifying a linear gray-scale transform function of the form in Figure 3-12b is to define the width of the LUT where the slope is nonzero (window) and the center of that same segment of the LUT (level) – so holding the window constant while adjusting the level has the effect of moving the non-zero slope portion of the transform to the left or to the right. Likewise, altering the window parameter either broadens or narrows the pixel intensity range to be highlighted. Pseudo code for the construction and application of the window/level LUT algorithm is given in Algorithm 3-3.
Algorithm 3-3: Window/Level LUT
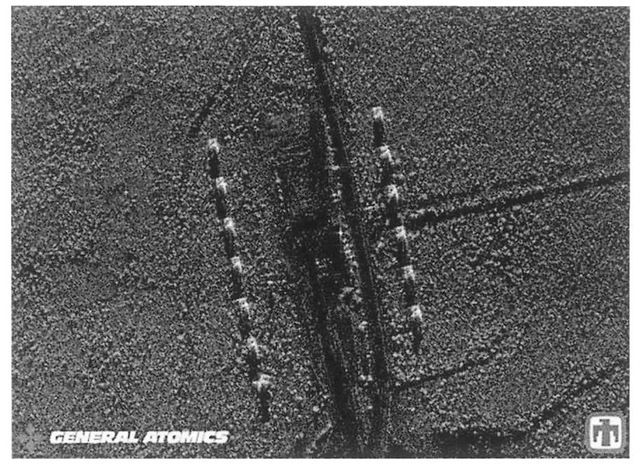
One area (among many) where window/level LUT processing is useful is during enhancement of synthetic aperture radar, or SAR, images. SAR is a high-resolution satellite imaging technique capable of acquiring useful images at night that is impervious to clouds and inclement weather. These advantages make SAR a more viable technology than traditional photographic imaging modalities in modern satellite applications. By virtue of their capabilities, SAR systems have proven highly useful in geological terrain mapping, environmental applications (such as demarcating oil spill boundaries), and military surveillance and targeting. Figure 3-13 is an unprocessed SAR image of M-47 tanks.
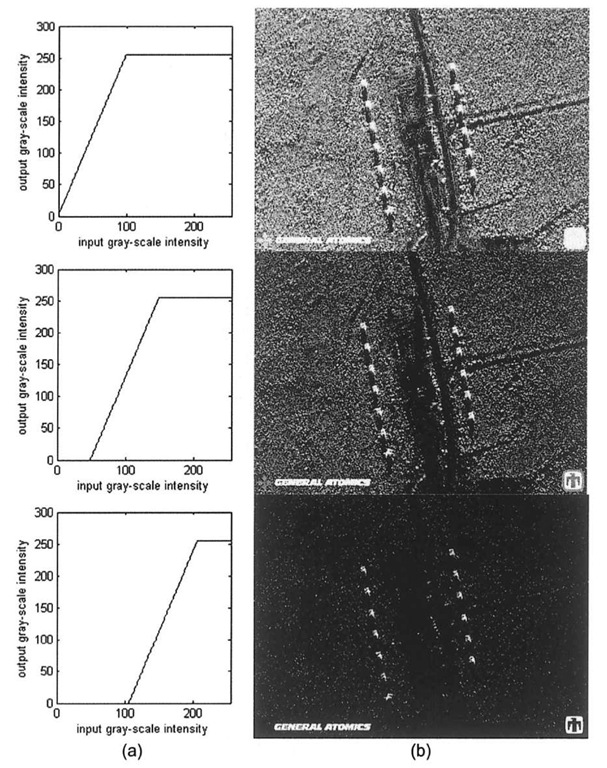
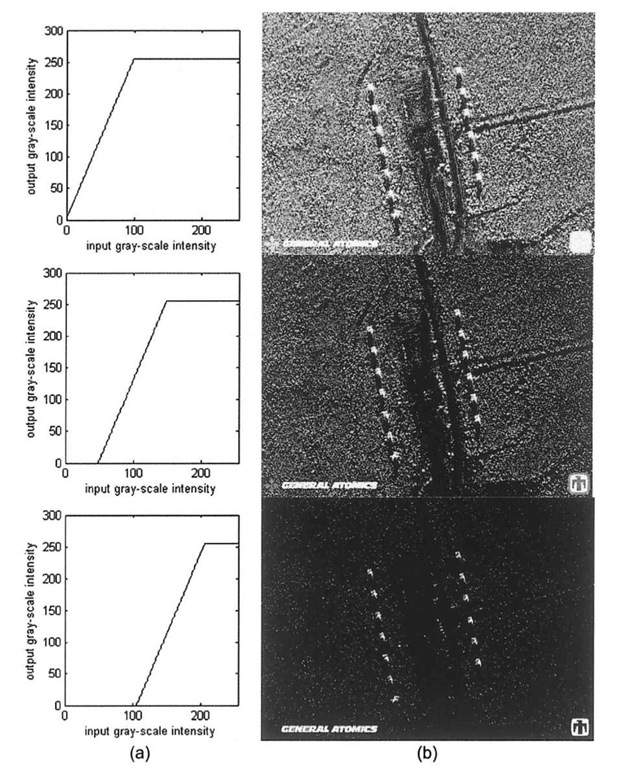
Given an interactive means of creating window/level lookup tables, a user could selectively enhance certain portions of an image using window/level processing, and then send the adjusted gray-scale image downstream to other processing subsystems for further analysis. Such a system would be semi-automated, as an operator would have to be in the loop. A fully automated system, such as one that might be found in a realtime military application, would of course require some means of determining the appropriate window and level parameters. The downstream analysis may come in the form of image segmentation or pattern recognition algorithms, which could potentially be used here to discern the locations of imaged tanks or other battlefield components. For example, Figures 3-14 and 3-15 show the effect of various windows and levels on the SAR image of Figure 3-13. The bottom-most image of Figure 3-14b is particularly interesting, because in comparison to the other processed images, much of the background has been removed, mostly leaving the pixels pertaining to the 13 tanks.
Figure 3-13. Synthetic Aperture Radar image of M-47 tanks at Kirtland Air Force Base, Albuquerque, NM.
A potential automated targeting application could accept the windowed and leveled gray-scale image as input, and then proceed to bin the connected pixels into disparate objects using morphological operators. The centroids of these objects would serve as an estimate of tank locations.
Window/level processing is also extensively utilized in medical imaging applications, especially with regards to radiographs9 and three-dimensional imaging modalities such as Computed Tomography (CT) and Magnetic Resonance Imaging (MRI)10. A common methodology is to window/level an image, where in the case of a 3D volumetric dataset a 2D image is extracted by pulling out a "slice", or plane, from the volume. For example, it is quite common to use window/level to highlight bony structure at the expense of soft issue, or to highlight lesions, tumors, or other abnormalities at the expense of other structures present within the field-of-view.
MATLAB Implementation
Specifying the pixel ranges used for displaying an image is rather simple using MATLAB. By default the full range is used, so when issuing the command imshow (I) or imagesc {I) MATLAB determines the minimum and maximum range based on I’s type.
Figure 3-14. Effect of varying the level while holding the window constant (100) on the SAR tank image, (a) LUT transform functions for level=50, 100, and 157 from the top down, (b) Corresponding processed image.
Figure 3-15. Effect of varying the window while holding the level constant (100) on the SAR tank image. The overall effect on this image is not as large as the example shown in Figure 314. (a) LUT transform functions for level=79, 100, and 150 from the top down, (b) Corresponding processed image.
The imshow and imagesc commands are similar, except that the former is available only if you have the Image Processing Toolbox installed. If you wish to display a gray-scale intensity image using a different range, then this range may be passed in as the second parameter to either of these two image display functions. For example, displaying an image with a window of 125 and level 137 is equivalent to setting the range to [73-198], which can be done using either imshow (I, 73 198] ) or imagesc (I, [73 198]).
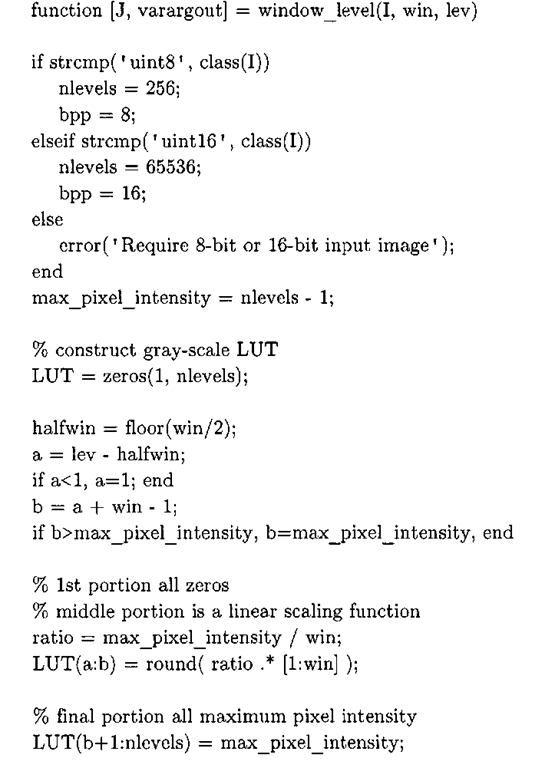
The aforementioned MATLAB commands will only display images using the specified range. To actually adjust the underlying pixel values, the function window_level (Listing 3-6) may be used.
Listing 3-6: window level .m
The window_level function supports 8-bit or 16-bit images, and returns the processed image as well as the actual LUT, if desired. The innards of this function are a direct port of Algorithm 3-3, but it utilizes some advanced MATLAB features that merit additional discussion. First, the signature of the function, while on the outset appearing normal, actually defines a function that returns an output variable J as well as a list of other variables. The varargout output variable is a MATLAB reserved word, and refers to a MATLAB cell array. A MATLAB cell array is a heterogeneous object collection, which may in fact be empty. For example, the following MATLAB command initializes a cell array consisting of a few numbers, a string, and a matrix:
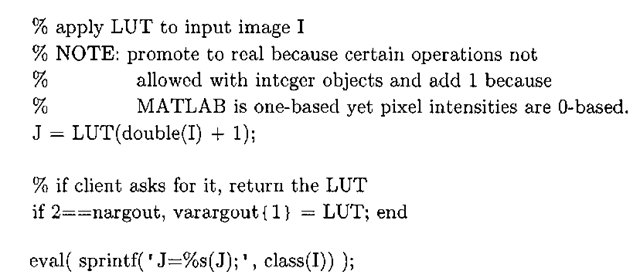
With normal MATLAB arrays, parentheses are used to index into the array, whereas for cell arrays the { and } characters are used, and so my_cell_array {4} returns the string ‘hello world’. The nargout reserved word is a variable containing the number of output parameters used in the current invocation of a function. So by using nargout in conjunction with varargout, as in the MATLAB code below (taken verbatim from window_level. m), a MATLAB function can return a variable number of output arguments, similar to how C functions may be defined such that they accept a variable number of input arguments via the ellipsis (…) operator:
Thus window_level. m has been coded such that it may be invoked in one of two ways:
So if the caller wishes to obtain the LUT used to transform the pixel intensities, an optional second output parameter may be given to window_level. The second unique aspect of the function pertains to the mechanics of how the lookup table is applied to transform the pixel intensities of the input image I. MATLAB is very much a "vectorized" language; in fact, the key to writing efficient MATLAB code is avoiding explicit for loops, although this has been mitigated somewhat with recent advances in the MATLAB just-in-time (JIT) interpreter. So in lieu of a for loop that walks through each pixel in I and replaces that pixel with the value given by the LUT, a single indexing statement suffices. If the variable LUT contains the transformation function, and the variable I is an image matrix of type double, then the statement J = LUT (I) is a vectorized and more efficient equivalent to the following MATLAB for loop:
In other words, in the statement J=LUT (I), each element (pixel) of I is treated as an index into LUT, thereby transforming I’s pixel intensities and assigning them to the processed image matrix J.
![Three examples of 8-bit gray-scale LUT transform functions, (a) Nominal identity function, a one-to-one "transform" mapping the intensity range [0-255] to [0-255]. (b) Linear function highlighting pixels lying within the range [74-197], (c) Non-linear gamma transformation function. Three examples of 8-bit gray-scale LUT transform functions, (a) Nominal identity function, a one-to-one "transform" mapping the intensity range [0-255] to [0-255]. (b) Linear function highlighting pixels lying within the range [74-197], (c) Non-linear gamma transformation function.](http://what-when-how.com/wp-content/uploads/2011/09/tmp672_thumb.png)

![tmp6-80_thumb[2] tmp6-80_thumb[2]](http://what-when-how.com/wp-content/uploads/2011/09/tmp680_thumb2_thumb.png)
![tmp6-81_thumb[2] tmp6-81_thumb[2]](http://what-when-how.com/wp-content/uploads/2011/09/tmp681_thumb2_thumb.png)
![tmp6-82_thumb[2] tmp6-82_thumb[2]](http://what-when-how.com/wp-content/uploads/2011/09/tmp682_thumb2_thumb.png)
![tmp6-83_thumb[2] tmp6-83_thumb[2]](http://what-when-how.com/wp-content/uploads/2011/09/tmp683_thumb2_thumb.png)
