Histogram Specification on the TI C6x EVM
A histogram equalization implementation targeting the C6701 EVM, located in Chap3\histogram_equalization, is instructive in a number of ways. The obvious is that it is a C port of Algorithm 3-4, again making use of the IMGLIB function IMG_histogram. In addition, this program is illustrative of the fact that substantial performance increases may be obtained via high-level optimizations, which in this particular algorithm entail eschewing floating-point operations in favor of far more efficient fixed-point operations.
While it is often tempting to focus on low-level optimizations (e.g., rewriting tight loops in assembly language) when attempting to increase the performance of a computationally expensive algorithm, the adage that "90% of the work is done in 10% of the code" definitely holds true most of time, and even more so in the case of DSP and image processing applications. Developers will obtain far greater "bang for their buck" by initially focusing their efforts and time on higher-level optimization opportunities first. Then, if the performance of the algorithm is still unsatisfactory, lower-level optimizations begin to take on added importance. This discussion serves two purposes: one, to present the C implementation of a histogram equalization routine running on the DSP and two, to describe how the CCStudio profiling tools can be used to measure the performance of C code running on a TI DSP11.
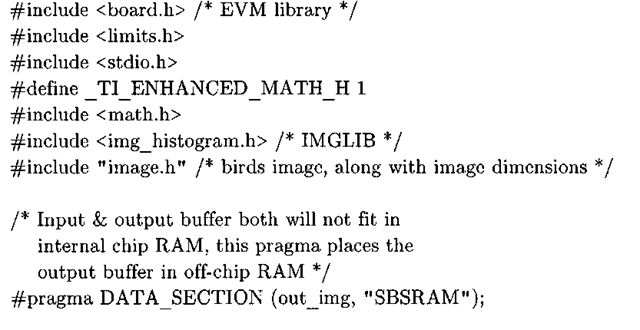
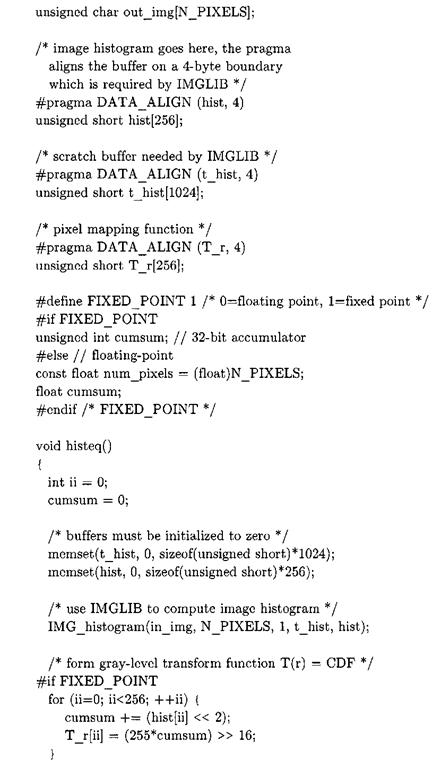
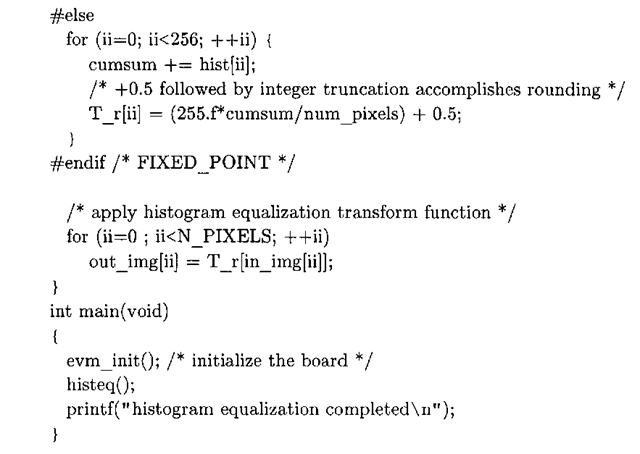
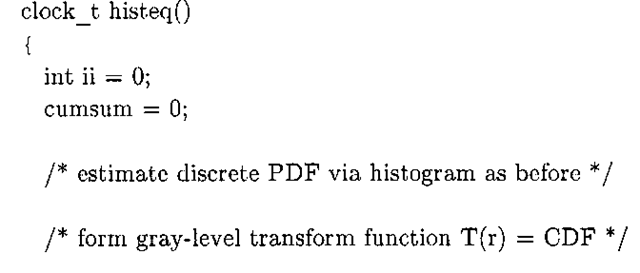
The histogram equalization EVM project is modeled closely after the contrast stretching and window/level projects. The same linker command file is used, and the only substantial infrastructure change is that the in_img buffer is now pre-initialized with the pixel data from Figure 3-19 in the image.h header file. As described in previous sections, the processed image can be sent back to the host PC using the CCStudio file I/O facilities and pointing them to the out_img array. Listing 3-15 is the contents of histeq. c, which contains both a floating-point as well as a fixed-point implementation of Algorithm 3-4.
Listing 3-15: histeq. c
Toggling between the two variants of the algorithm is accomplishing through the C preprocessor directive FIXED_POINT (if defined as 0 then the histeq function is floating-point, else the function utilizes a fixed-point implementation). In both scenarios, the code proceeds in three phases, where the first and third phases are identical in both fixed and floating-point:
1. Estimate the discrete PDF of the input image using the IMGLIB IMG_histogram function.
2. Construct the T_r array, which holds the lookup table that is the basis for the pixel remapping function.
3. Remap pixels from in_img to out_img, using T_r.
The floating-point version of phase 2 is straightforward. The cumsum variable serves as an accumulator storing the current value of the CDF, and in the subsequent statement T_r [ i i ] is set to a scaled version of this value, thereby mapping the normalized range [0-1] to the 8-bit range [0-255]. At first glance, the fixed-point version of this loop is not as straightforward. Fixed-point numbers were introduced in 2.1.2, and this program utilizes what could be called a Q2 format. For comparison purposes, Listing 3-16 is a side-by-side comparison of the floating-point and fixed-point histogram equalization loop.
Listing 3-15: floating-point loop (left) versus fixed-point loop (right).
Note that in the actual code of Listing 3-15, the second line in the fixed-point loop replaces the division by N_PIXELS (which is known to be 214 = 16384) with a corresponding right shift of 14 bits. Thus the right-hand side of that statement, (255*cumsum/N_PIXELS)>>2, reduces to (2 55*cumsum) >>16. We can use the profiling tools included with Code Composer Studio to quantify exactly how much is gained by using fixed-point representations of numbers on a floating-point processor like those of the C67x series (the difference will be even more pronounced on a fixed-point processor).
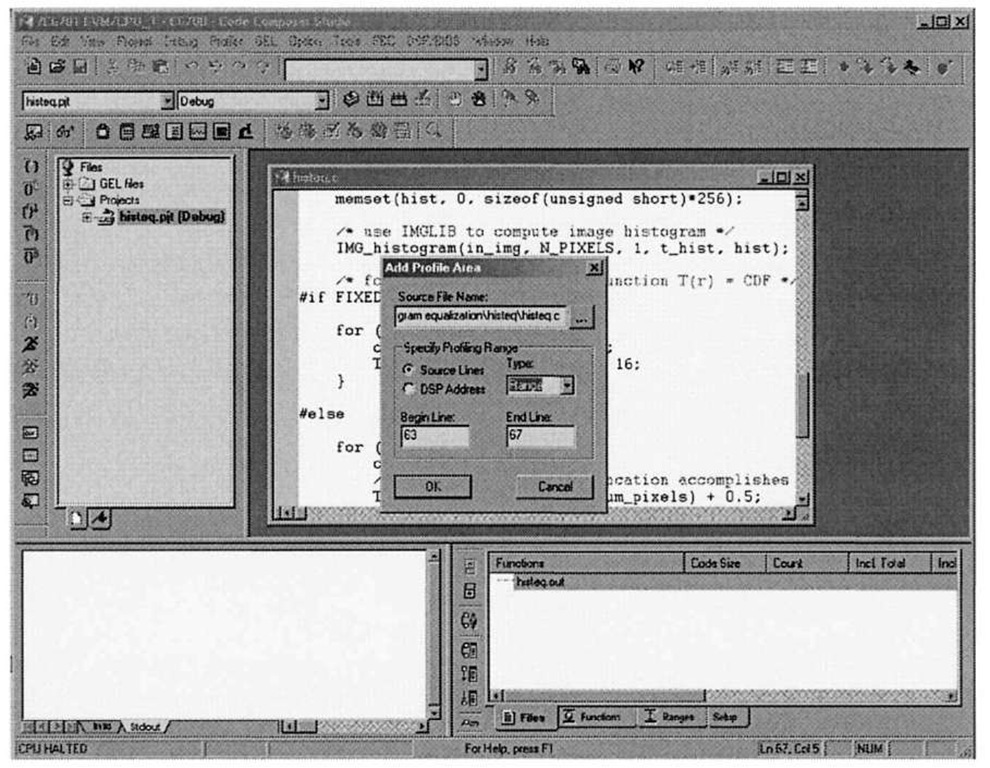
Figure 3-24. Setting a CCStudio profile area to benchmark histeq performance. Lines 6268 contain the code to construct the floating-point T_r array. To benchmark the fixed-point implementation, set the FIXED_P0INT preprocessor symbol to 1, recompile, reload the program, and use the range 55-60.
Of course, in order to make a fair comparison aggressive compiler optimizations should be enabled, which is done by selecting the ‘-o3′ optimization level within the Build tab of the dialog from the Project|Build Options menu selection. Note that the ‘-g’ option (debug symbols) must be enabled to use the Code Composer Studio profiler.
After loading the program onto the DSP, and selecting Debug|Go Main (which loads the symbols), start a profiler session via Profiler|Start New Session. After starting the session, a profile window appears where a section of code may be marked for profiling by clicking on the Create Profile Area button in this new window (the fourth button from the top). This button brings up an Add Profile Area dialog where the section of code to profile is set. Enter the lines of code to profile, and take care to select the "Range" type as opposed to "Function" type if you wish to profile just a portion of the function in question, as we do here (see Figure 3-24). Also note that to measure accurate cycle times, the processor should be reset prior to each benchmark, so as to clear out the cache and make a truly fair comparison (we wish to avoid the situation where a warm cache skews the measurements). Resetting the DSP is done by selecting Debug|Reset.
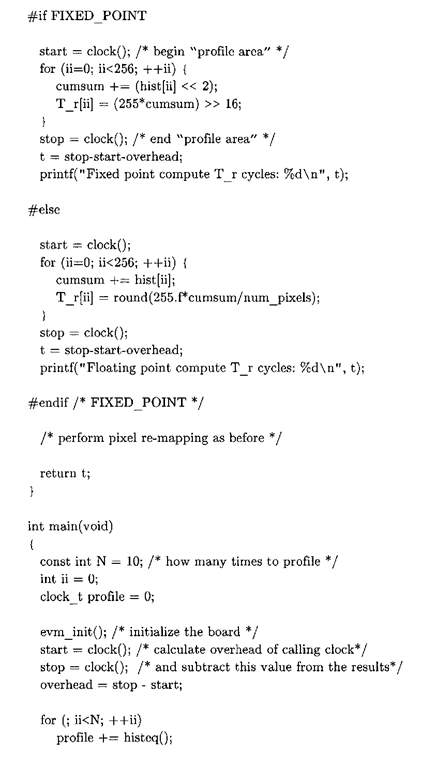
The floating-point version clocks in at 35,702 cycles on a C6701 EVM, while the fixed-point version takes 528 cycles, as measured by the CCStudio profiler. However, the CCStudio profiler, while quite convenient, is unable to tell the full story, the reason being that it only works if the program is compiled with the -g option. The inclusion of debug symbols increases code size and disables certain optimizations, so in order to get a true idea of how long each implementation takes the -g option should be disabled, thereby precluding the use of the CCS profiler. Another C6x EVM program can be found in the Chap3\histogram_equalization_profile directory. This program is fundamentally the same as its predecessor, except that profiling statements using the clock function have been interspersed throughout the code, as described in [12]. Listing 3-17 shows the relevant portions of the source code.
Listing 3-17: histeq. c
To use this program properly, enable aggressive optimizations as before, however do not set the ‘-g’ compile option. Alternatively, changing the build configuration to Release should by default enable fairly aggressive optimizations, although it is always recommended to ensure that the most appropriate build options for your particular application are set. Prior to running the program, the CCStudio clock facility must be enabled via the Profiler|Enable Clock menu option. This program calls the histeq function n times, prints the number of cycles taken to execute each separate invocation of histeq, and at the conclusion of the program prints the average cycle count. The program now reports approximately 34,833 cycles (versus 35,702) for the floating-point loop, and approximately 331 cycles (versus 528) for the fixed-point loop. Another area one might tackle to optimize this program’s performance is in its memory usage. The out_img array is stored in off-chip memory, and accessing off-chip memory is enormously prohibitive. In the next topic, we investigate techniques to ameliorate this bottleneck.
