Histogram Specification
Histogram equalization is used as an intermediate step in a closely related and more useful spatial processing technique, histogram specification. As we have just seen, in histogram equalization a single output is generated – a transformed image with a flat, or uniform, probability distribution. In histogram specification, we generalize this algorithm so that we can produce an output image whose histogram matches some desired probability distribution. For example, suppose you have an image and wish to apply a gray-level pixel mapping so that the altered image’s histogram takes on a Gaussian distribution – or in general, if you want to remap an image’s pixels such that the transformed image has the same histogram as some target image.
Let pj (w) denote the input image probability distribution, pj (w) the specified (desired) pixel distribution, and g the processed image. Then we can obtain T(r) which equalizes pf (w) using the histogram equalization equation:
Likewise, because we specified Pd(w), we can equalize the desired output histogram:
Histogram equalization produces a single output – a uniform PDF – and hence it follows that:
Assuming the inverse transform TJl exists and is single-valued and monotonically increasing, inverting Td and feeding in s (the equalized levels of the input image) yields:
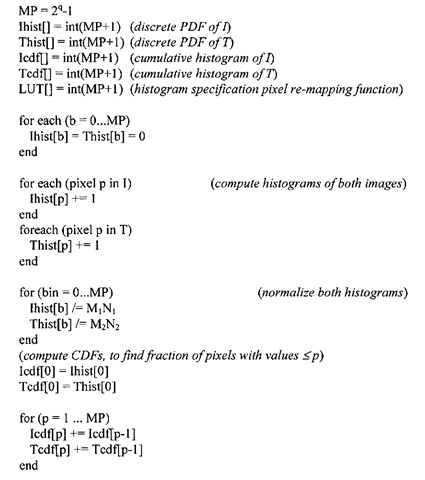
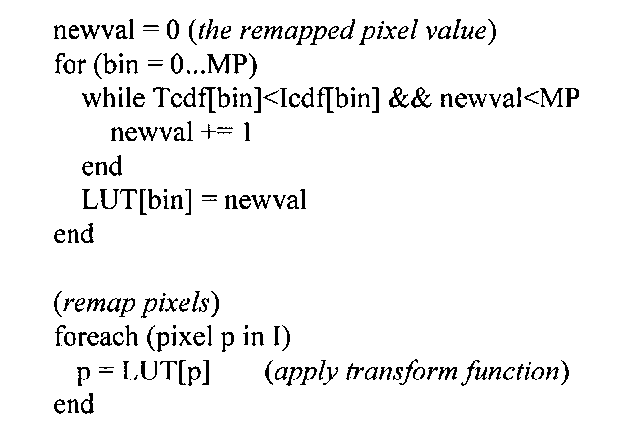
To summarize, we first transform the input histogram to a uniform distribution via the application of 7), and then transform this uniform distribution to a set of pixels characterized by the desired distribution by feeding the intermediate result into Tj’. Thus, to perform histogram specification, it is not necessary to explicitly histogram equalize the input. Rather, we merely need to compute the equalization gray-level transform and combine it with the inverse transform Tj’. In the continuous domain, obtaining analytical expressions for 7} (r) and TJ1 is difficult, if not impossible. In the digital domain, we are able to circumvent this problem by approximating these functions using discrete values. An optimized histogram specification algorithm that does not explicitly equalize the input is given in Algorithm 3-5.
Algorithm 3-5: Histogram Specification
INPUT: MixNi q-bit image I, M2xN2 q-bit target image T
(histogram specification gray-level transform function: scan along input CDF, stopping when cumulative histogram exceeds target CDF)
MATLAB Implementation
The Image Processing Toolbox has a function that performs both histogram equalization as well as histogram specification, histeq. The first argument to this function is the input image, and if a second argument, a histogram vector, is provided histeq performs histogram specification. On the CD, in the Chap3 directory, there are three M-files which may be used in lieu of histeq for those who do not have access to the Image Processing Toolbox. Listing 3-12 is the implementation for hist equalize, which is based on Algorithm 3-4 and equalizes an image.
Listing 3-12: MATLAB function for histogram equalization.
function J = hist_equalize(I)
% apply LUT to input image I
% NOTE: must promote to real because certain operations
% now allowed with integer objects and add 1 because
% MATLAB is one-based yet pixel intensities are 0-based.
J = LUT(double(I) + 1);
It is sometimes difficult to gauge the effectiveness of histogram equalization on gray-scale images, but the procedure often shines when employed on color images. Color images are typically represented as multichannel two-dimensional signals, whereas the gray-scale images we have encountered have just a single (monochrome) channel. Color images in MATLAB can be stored as three-dimensional RGB matrices, with each "slice" or sub-matrix containing the red (R), green (G), and blue (B) channels. In the images directory on the CD, a 24-bit (8 bits per color channel) Windows BMP image file hills .bmp may be found. This image file may be read into MATLAB using the built-in imread function:
The variable I has dimensions 492x489x3, and the command I(:,:,c) for c=l,2,3 returns the red, green, and blue channels respectively. How does one go about equalizing a color image? While it may be tempting to simply treat each channel as its own gray-scale image and proceed to separately equalize them and subsequently combine them back together to form a processed RGB image, this is not advised. What will happen is that separate equalization of the three color channels will result in artificial color shifts, producing a psychedelic effect of sorts. Rather, the recommended course of action is to apply a color transformation to the RGB channels that maps R, G, and B to the hue, saturation, and value (HSV) color space – this process is detailed in Figure 3-22. The value channel in this space is roughly equivalent to intensity, so histogram equalization may be safely performed on this channel. The inverse color transform is then used to map the H, S, and equalized V channels back to RGB space, which can then be displayed. The MATLAB Image Processing Toolbox functions rgb2hsv and hsv2rgb can be used to perform these sorts of color transformations.
Figure 3-22. Histogram equalizing an RGB image.
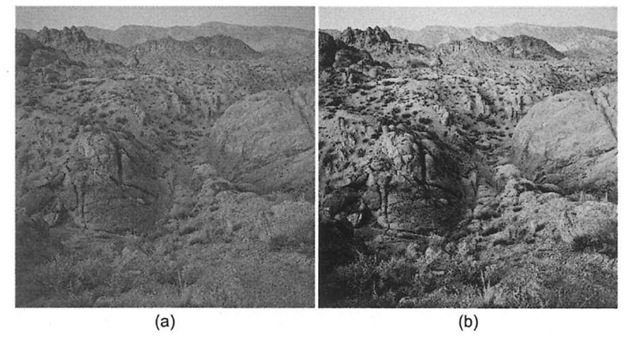
Unfortunately, the Image Processing Toolbox histeq function does not handle RGB images – Listing 3-13 is a function histeqRGB which can be used to perform the aforementioned color equalization. Figure 3-23 illustrates the effect histogram equalization can have on a digital photograph. This figure is shown in monochrome, however the histogram equalized color image, processed via histeqRGB, may be found on the CD under the images directory.
Listing 3-13: MATLAB function to histogram equalize an RGB image.
function J = histeqRGB(I)
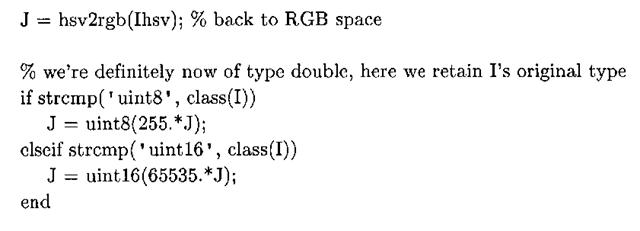
Ihsv = rgb2hsv(I); % convert from RGB space to HSV space
% V is roughly equivalent to intensity, bear in mind that
% V is now of type double, with values in the range [0-1] V = Ihsv(:,:,3);
% perform histogram equalization on the V channel,
% overwriting the original data Ihsv(:,:,3) = histeq(V);
% perform histogram equalization on the V channel,
% overwriting the original data Ihsv(:,:,3) = histeq(V);
Figure 3-23. Histogram equalizing hills .bmp via histeqRGB.(a) Original 24-bit RGB image, (b) Result of equalizing the "value" channel of the HSV transformed image, and then applying the HSV-to-RGB mapping.
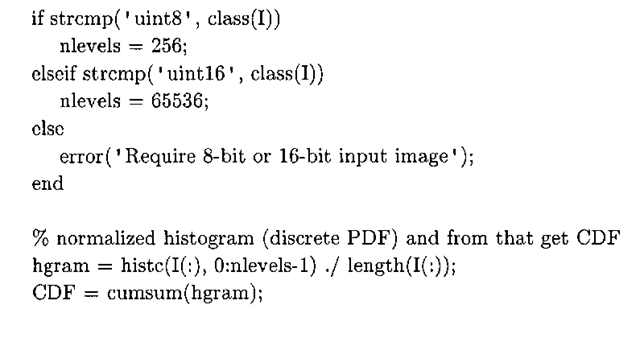
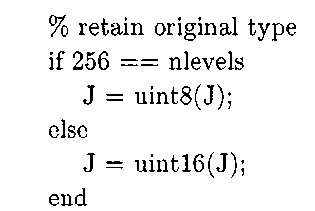
Algorithm 3-5 delineated an efficient means of performing histogram specification that does not explicitly equalize the input image. A MATLAB function, hist_specif ication, that implements this algorithm is given in Listing 3-14. If asked for, this function also returns the gray-level transformation function used to perform the histogram matching, a la window_level from 3.3.1. When using hist_specification, it is imperative to pass in a normalized histogram (that is, divide each frequency bin by the total number of pixels, such that the summation of the entire vector is 1.0). A common mistake is forgetting to normalize the target histogram (hgram in hist_specification). In this case, the gray-level transform function is erroneously constructed because the scale of the two discrete PDFs are no longer the same. The hist_specif ication function does perform a sanity check on the desired histogram, by verifying that the maximum element is not greater than 1.0.
Listing 3-14: MATLAB function for histogram specification.
function [J, varargout] = hist_specification(I, hgram)
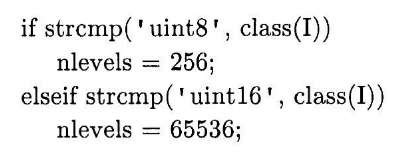
% calculate normalized histogram of input image H = histc(I(:), 0:nlevels-l); H = H ./ length(I(:));
% cumulative histograms of both input and desired distributions cdf_orig = cumsum(H); cdf_desired = cumsum(hgram);
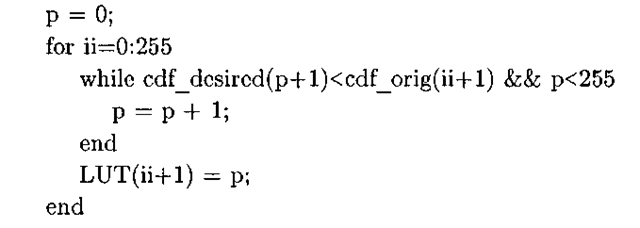
% construct gray-level transformation lookup table here:
% scan along input CDF, stopping when cumulative histogram
% exceeds target CDF.
% apply LUT to input image I
% NOTE: must promote to real because certain operations
% not allowed with integer objects, and add 1 because
% MATLAB is one-based yet pixel intensities are 0-based. J = LUT (double (I) + 1);
![tmp6-112_thumb[2] tmp6-112_thumb[2]](http://what-when-how.com/wp-content/uploads/2011/09/tmp6112_thumb2_thumb.png)
![tmp6-113_thumb[2] tmp6-113_thumb[2]](http://what-when-how.com/wp-content/uploads/2011/09/tmp6113_thumb2_thumb.png)
![tmp6-114_thumb[2] tmp6-114_thumb[2]](http://what-when-how.com/wp-content/uploads/2011/09/tmp6114_thumb2_thumb.png)
![tmp6-115_thumb[2] tmp6-115_thumb[2]](http://what-when-how.com/wp-content/uploads/2011/09/tmp6115_thumb2_thumb.png)

![tmp6-121_thumb[2] tmp6-121_thumb[2]](http://what-when-how.com/wp-content/uploads/2011/09/tmp6121_thumb2_thumb.png)

