Fermi Energy and Fermi Surface
The Fermi energy, EF, is an important part of an electron band diagram. Many of the electronic properties of materials, such as optical, electrical, or magnetic properties, are related to the location of EF within a band.
The Fermi energy is often defined as the "highest energy that the electrons assume at T = 0 K". This can be compared to a vessel, like a cup, (the electron band) into which a certain amount of water (electrons) is poured. The top surface of the water contained in this vessel can be compared to the Fermi energy. The more electrons are "poured" into the vessel, the higher the Fermi energy. The Fermi energies for aluminum and copper are shown in Figs. 5.21 and 5.22. Numerical values for the Fermi energies for some materials are given in topic 4. They range typically from 2 to 12 eV.
The above-stated definition, even though convenient, can occasionally be misleading, particularly when dealing with semiconductors. Therefore, a more accurate definition of the Fermi energy will be given in Section 6.2.
We will see there that at the Fermi energy the Fermi function, F(E), equals 1. An equation for the Fermi energy is given in (6.11).
In three-dimensional k-space the one-dimensional Fermi energy is replaced by a Fermi surface. The energy surface shown in Fig. 5.27 is the Fermi surface for copper.
Fermi Distribution Function
The distribution of the energies of a large number of particles and its change with temperature can be calculated by means of statistical considerations. The kinetic energy of an electron gas is governed by Fermi-Dirac statistics, which states that the probability that a certain energy level is occupied by electrons is given by the Fermi function, F(E),
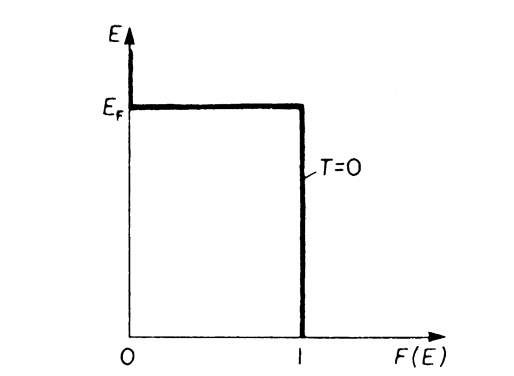
If an energy level E is completely occupied by electrons, the Fermi distribution function F(E) equals 1 (certainty); for an empty energy level one obtains F(E) = 0. EF is the Fermi energy which we introduced in Section 6.1, kB is the Boltzmann constant, and T is the absolute temperature. In Fig. 6.1, the Fermi function is plotted versus the energy for T ! 0 by using (6.1). One sees from this figure that at T = 0 all levels that have an energy smaller than EF are completely filled with electrons, whereas higher energy states are empty.
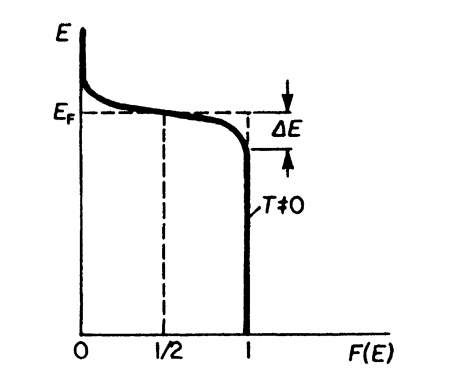
The Fermi distribution function for higher temperatures (T = 0) is shown in Fig. 6.2. It is noticed there that F(E) varies around EF in a gradual manner and not by a step as for T = 0. To characterize this behavior, one says that F(E) is "smeared out," i.e., it is extended to an energy interval 2DE. This decrease in F(E) with increasing energy is heavily exaggerated in Fig. 6.2. DE at room temperature is in reality only about 1% of EF.
Figure 6.1. Fermi distribution function, F(E), versus energy, E, for T = 0. (For E > EF and T ! 0 (6.1) yields F(E) ! 0).
Figure 6.2. Fermi distribution function for T = 0.
At high energies (E » EF) the upper end of the Fermi distribution function can be approximated by the classical (Boltzmann) distribution function. This is best seen from (6.1) in which for large energies the exponential factor becomes significantly larger than 1. Then, F(E) is approximately
Equation (6.1a) is known to be the Boltzmann factor, which gives, in classical thermodynamics, the probability that a given energy state is occupied. The F(E) curve for high energies is thus referred to as the "Boltzmann tail" of the Fermi distribution function.
Of particular interest is the value of the Fermi function F(E) at E = EF and T = 0. As can be seen from (6.1) and Fig. 6.2, F(E) is in this particular case 1. This serves as a definition for the Fermi energy, as outlined in Section 6.1.
Density of States
We are now interested in the question of how energy levels are distributed over a band. We restrict our discussion for the moment to the lower part of the valence band (the 3s-band in aluminum, for example) because there the electrons can be considered to be essentially free due to their weak binding force to the nucleus. We assume that the free electrons (or the "electron gas") are confined in a square potential well (box) from which they cannot escape. The dimensions of this potential well are thought to be identical to the dimensions of the crystal under consideration. Then our problem is similar to the case of one electron in a potential well of size a, which we treated in Section 4.2. By using the appropriate boundary conditions, the solution of the Schrodinger equation yields an equation that has the same form as (4.18) or (4.26),
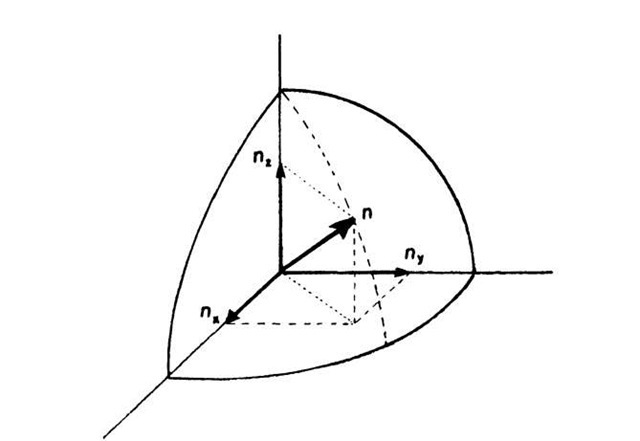
where nx, ny, and nz are the principal quantum numbers and a is now the length, etc., of the crystal. Now we pick an arbitrary set of quantum numbers nx, ny, nz. To each such set we can find a specific energy level En, frequently called "energy state". An energy state can therefore be represented by a point in quantum number space (Fig. 6.3). In this space, n is the radius from the origin of the coordinate system to a point (nx, ny, nz) where
Equal values of the energy En lie on the surface of a sphere with radius n. All points within the sphere therefore represent quantum states with energies smaller than En. The number of quantum states, r, with an energy equal to or smaller than En is proportional to the volume of the sphere. Since the quantum numbers are positive integers, the n-values can only be defined in the positive octant of the n-space. One-eighth of the volume of the sphere with radius n therefore gives the number of energy states, r, the energy of which is equal to or smaller than En. Thus, with (6.2) and (6.3), we obtain
Differentiation of r with respect to the energy E provides the number of energy states per unit energy in the energy interval dE, i.e., the density of the energy states, briefly called density of states, Z(E):
Figure 6.3. Representation of an energy state in quantum number space.
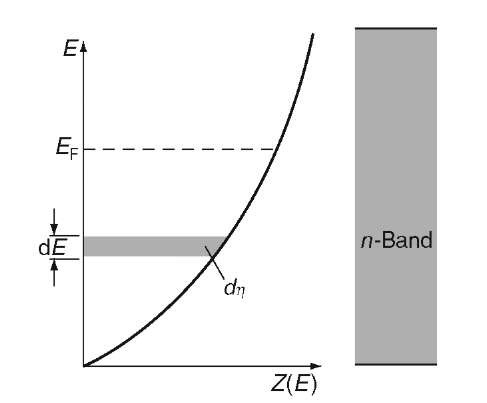
Figure 6.4. Density of states Z(E) within a band. The electrons in this band are considered to be free. Note, that the density of states, as shown in this figure, is only parabolic for the three-dimensional case (solids). Z(E) looks different for the two-dimensional case (quantum well), one-dimensional case (quantum wire), or zero-dimensional case (quantum dot). See for example Fig. 8.33(c). However, since we are discussing here only solids, the representation as shown above is correct and sufficient.
(a3 is the volume, V, that the electrons can occupy).
The density of states plotted versus the energy gives, according to (6.5), a parabola. Figure 6.4 shows that at the lower end of the band considerably fewer energy levels (per unit energy) are available than at higher energies. One can compare the density of states concept with a high-rise apartment building in which the number of apartments per unit height (e.g., 8 ft) is counted. To stay within this analogy, only a very few apartments are thought to be available on the ground level. However, with increasing height of the building, the number of apartments per unit height becomes larger.
The area within the curve in Fig. 6.4 is, by definition, the number of states that have an energy equal to or smaller than En. Therefore, one obtains, for an area element d],
as can be seen from (6.5) and Fig. 6.4.
Complete Density of States Function Within a Band
We have seen in Section 6.3 that for the free electron case the density of states has a parabolic E versus Z(E) relationship. In actual crystals, however,the density of states is modified by the energy conditions within the first Brillouin zone.
Figure 6.5. Schematic representation of the complete density of states function within a band.
Let us consider, for example, the curves of equal energy depicted in Fig. 5.26. For low energies, the equal energy curves are circles. Thus, the electrons behave free-electron like for these low energies. The density of states curve is then, as before, a parabola. For larger energies, however, fewer energy states are available, as is seen in Fig. 5.26. Thus, Z (E) decreases with increasing E, until eventually the corners of the Brillouin zones are filled. At this point Z(E) has dropped to zero. The largest number of energy states is thus found near the center of a band, as shown schematically in Fig. 6.5.
Population Density
The number of electrons per unit energy, N(E), within an energy interval dE can be calculated by multiplying the number of possible energy levels, Z(E), by the probability for the occupation of these energy levels. We have to note, however, that because of the Pauli principle, each energy state can be occupied by one electron of positive spin and one of negative spin,16 i.e., each energy state can be occupied by two electrons. Therefore,
or, with (6.1) and (6.5),
The area within the curve in Fig. 6.6 represents the number of electrons, N*, that have an energy equal to or smaller than the energy En. For an energy interval between E and E + dE, one obtains
We are now in a position to calculate the Fermi energy by making use of (6.8) and (6.9). We consider the simple case T ! 0 and E < EF, which yields F(E) = 1. Integration from the lower end of the band to the Fermi energy, EF, provides
Rearranging (6.10) yields
We define N0 = N*/V as the number of electrons per unit volume. Then we obtain
Figure 6.6. Population density N(E) within a band for free electrons. dN* is the number of electrons in the energy interval dE.
It should be noted that N* was calculated for simplicity for T ! 0 and E < Ef. This does not limit the applicability of (6.11), however, since the number of electrons does not change when the temperature is increased. In other words, integrating from zero to infinity and using T = 0 would yield essentially the same result as above.


