Spatial formats vs. resolution; fields
Regardless of whether or not the array of sampling points (pixels) is rectangular (i.e., the pixels are arrayed orthogonally, in linear rows and columns), a concept often encountered in imaging discussions is the notion of “square” pixels. This does not mean that the pixels are literally square in shape – again, a pixel in the strictest sense of the word is a dimensionless, and therefore shapeless, point sample of the original image. Instead, a sampling grid or spatial format is said to be “square” if the distance between samples is the same along both axes.
Images do not have to be sampled in a “square” manner, and in fact many sampling standards (especially those used in digital television) do not use square sampling, as we will see later. However, it is often easier to manipulate the image data if a given number of pixels can be assumed to represent the same physical distance in both directions, and so square sampling or square-pixel image format is almost always used in computer-generated graphics.
The term format, or spatial format, is used to refer to the overall “size” of the image, in terms of the number of pixels horizontally and vertically covered by the defined image space. For example, a common format used in the computer graphics industry is 1024 x 768, which means that the image data contains 1024 samples per horizontal row, or line, and 768 of these lines (or, in other words, there are 768 pixels in each vertical column of the array of pixels). Unfortunately, the convention used in the computer industry is exactly opposite to that used in the television industry; TV engineers more often refer to image formats by quoting the number of lines (the number of samples along the vertical axis) first, and then the number of pixels in each line. What the computer graphics industry calls a “1024 x 768” image, television would often call a “768 x 1024” image.
Readers who are familiar with the computer industry will also notice that what we are here referring to as a “spatial format” is often called a “resolution” by computer users. This is actually a misuse of the term resolution, which already has a very well-established meaning in the context of imaging. There is a very important distinction to be made between the format of a sampled image, and the resolution of that image or system, and so we will try to avoid giving in to the common, incorrect usage of the latter term.
Resolution properly refers simply to the amount of details which can be resolved in an image or by an imaging system; it is usually expressed in terms of the number of basic image elements (lines, pairs of lines, or pixels – also “dots” or “samples”) per a definite physical distance. “Dots per inch”, often seen in specifications for computer printers, is a legitimate measure of resolution – dots or pixels per line is not, since a “line” in a image does not have a definite, fixed physical length. Changing from a spatial format of, for instance, 800 x 600 pixels to one of 1600 x 1200 pixels does not necessarily double the resolution. It would do so only if the physical dimensions of the image and/or the objects within it remain constant, and so finer details within the image are now resolved.
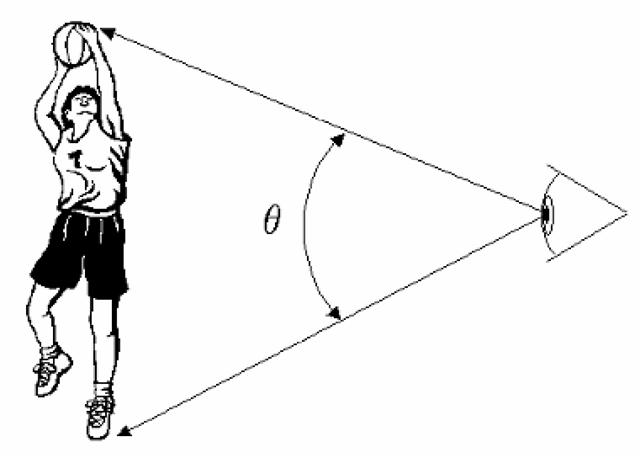
Figure 1-5 The portion of the visual field occupied by a given image may be expressed in terms of visual angle, or in visual degrees, which is simply a measure of the angle subtended by the image from the viewer’s perspective.
Resolution may also be expressed in terms of the same sorts of image elements (dots, lines, etc.) per a given portion of the visual field, since this is directly analogous to distance within the image. The amount of the visual field covered by the image is often expressed in terms of visual degrees, defined as shown in Figure 1-5. A common means of indicating visual acuity – basically, the resolution capability of the viewer, himself or herself – is in terms of cycles per visual degree. Expressing resolution in cycles (or a related method, in terms of line pairs) recognizes that detail is perceived only in contrast to the background or to contrasting detail; one means of determining the limits on resolution, for example, is to determine whether or not a pattern of alternating white and black lines, or similarly a sinusoidal variation between white and black, is perceived as a distinct pattern or if it simply blurs into the appearance of a continuous gray shade. (It should be noted at this point that resolution limits are often different between cases of white/black, or luminance, variations, and differences between contrasting colors.)
Moving images; frame rates
To this point, we have considered only the case of a static image; a “still picture”, which is often only a two-dimensional representation of a “real” scene. But we know that reality is not static – so we must also face the problem of representing motion in our images. This could be done by simply re-drawing the moving objects within the image (and also managing to restore the supposedly static background appropriately), but most often it is simply assumed that motion will be portrayed by replacing the entire image, at regular intervals, with a new image. This is how motion pictures operate, by showing a sequence of what are basically still photographs, and relying on the eye/brain system to interpret this as a convincing representation of smooth motion. Each individual image in the series is referred to as a frame (borrowing terminology originally used in the motion picture industry), and the rate at which they are displayed is the frame rate. Later, we will see that there may be two separate “frame rates” to consider in a display system – first, the update rate, which is how rapidly new images can be provided to or created in the frame buffer, which is the final image store before the display itself, and the refresh rate, which is how rapidly new images are actually produced on the “screen” of the display device. These are not necessarily identical, and certain artifacts may arise from the exact rates used and their relationship to one another.
Quite often in display systems, the entire frame will not be handled as a single object; it is often necessary to transmit or process component portions of the frame separately. For instance, the color information of the frame may be separated out into its primary components, or (for purposes of reducing the rate at which data must be transmitted), the frame may be broken apart spatially into smaller components. The term most often used to refer to these partial frames is fields, which may generically be defined as any well-defined subcomponent of the frame, but into which each of the frames can similarly be separated. (In other words, components which are unique only to a given frame or series of frames are not generally referred to as fields.)
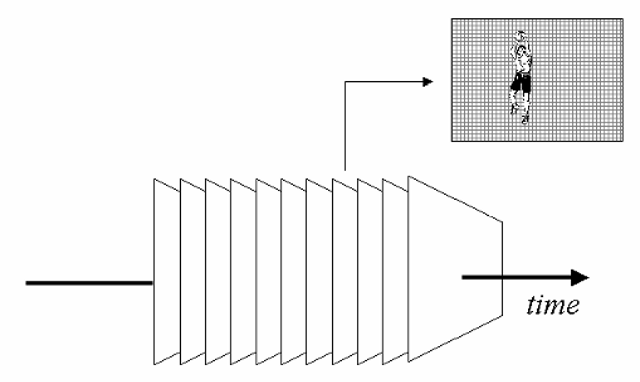
We should note at this point that our discussion of images has now extended into a third dimension – that of time – and that the complete visual experience we typically receive from a display system actually comprises a regular three-dimensional array of samples in both time and space (Figure 1-6). Each frame represents a sample at a specific point in time; each pixel within that frame is a sample within a two-dimensional image space, representing certain visual qualities of the image at that point in space at that time. As in any sampling-based system, various difficulties and artifacts may be produced through the nature of the sampling methodology itself – the sampling rate, the characteristics of the actual implementation of the sampling devices, etc..
Figure 1-6 Many imaging applications involve the transmission of successive frames of information (as in the case of moving imagery), which introduces a third dimension (time) into the situation. In such cases, not only is each frame to be considered as a 2-D array of samples of the original image, but the frame itself may considered as one sample in time out of the sequence which represents a changing view.
Three-dimensional imaging
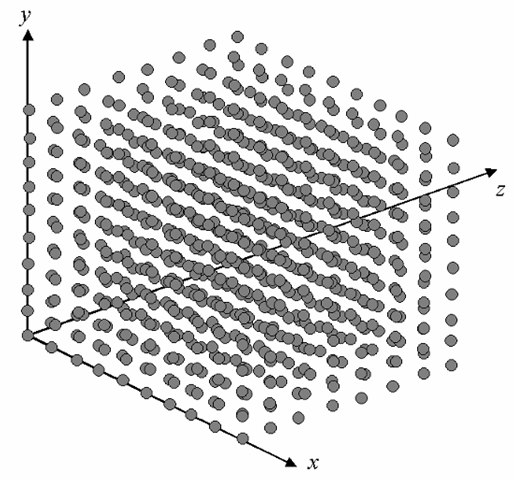
Extending the functioning of display systems in a third spatial dimension, and thus providing images with the appearance of solid objects, has long been a goal of many display researchers, and indeed considerable progress has been made in this field. While true “3-D” displays are not yet commonplace, there has been more than enough work here for some additional terminology to have arisen. At the very least, rendering images in three dimensions (i.e., keeping track of 3-D spatial relationships when creating images via computer) has been used for many years. It is fairly common at this point, for instance, to treat the image space as extending not just in two dimensions but in three (Figure 1-7). In this case, the sample points might no longer be called “pixels”, but rather voxels – a term derived from “volume pixel”. (It should also be obvious at this point that in extending the image space into three dimensions, we have literally increased the amount of information to be handled geometrically.)
Figure 1-7 In a truly “three-dimensional” imaging system – in the sense of one having three spatial dimensions – the samples are viewed as occupying a regular array in space, and are generally referred to as “voxels” (for volume pixel). It is again important to keep in mind that these samples, as in the case of the pixels of a 2-D image, are dimensionless, and each represents the image information as taken from a single point within the space.
Transmitting the Image Information
Having reviewed some of the basic concepts regarding imaging, and especially how images are sampled for use within electronic display systems, it is time to consider some of the basics in communicating the information between parts of the complete system – and in particular, how this information is best transmitted to the display device itself.
As was noted earlier, almost all modern image sensors and display systems employ the “mosaic” model for sampling and constructing images. In other words, “real-world” images are sampled using a regular, two-dimensional array of sampling points, and the resulting information about each “pixel” within that array may be used to re-create the image on a display device employing a similar array of basic display elements. In practically all modern display systems, the image information is sent in a continuous stream, with all pixels in the array transmitted repeatedly in a fixed standard order. Again, this is generally referred to as a raster scan system.
For any form of interface to the display device, then, the data capacity required of the interface in a raster-scan system may be calculated by considering:
1. The amount of information contained in each sample, or pixel. This is normally stated in bits (binary digits), as is common in information theory, but no assumption should be made as to whether the interface in question uses analog or digital signalling based on this alone. Typically, each pixel will contain at least 8, and more often as much as 24-32 bits of information.
2. The number of samples in each image transmitted, i.e., the number of pixels per frame or field. For the typical two-dimensional rectangular pixel array, this is easily obtained by multiplying the number of pixels per line or row by the number of lines or rows per frame. For example, a single “1280 x 1024” frame contains 1,310,720 pixels.
3. The field or frame rate required. As has been noted, most display systems required repeated and regular updating of the complete image; the required rate is determined by a number of factors, including the characteristics of the display itself (e.g., the likelihood of “flicker” in that display type or application) and/or the need to portray motion realistically. These factors result in typical rates being in the upper tens of frames per second.
4. Any overhead or “dead time” required by the display; as used here, this term refers to any limitations on the amount of time which can be devoted to the transmission of valid image data. A good example is in the “blanking time” required in the case of CRT displays, which can reduce the time available for actual image data transmission by almost a third.
For example, a system using an image format of 1024 x 768 pixels, and operating at a frame rate (or refresh rate) of 75 frames/s, with 24 bits/pixel, and with 25% of the available time expected to be “lost” to overhead requirements, would require an interface capable of supporting a peak data rate of
(This actually represents a rather medium-performance display system, so one lesson that should be learned at this point is that display systems tend to require fairly capable interfaces!)
It should be noted at this point that these sorts of requirements are very often erroneously referred to as “bandwidth”; this is an incorrect usage of the term, and is avoided here. Properly speaking, “bandwidth” refers only to the “width” of an available transmission channel in the frequency domain, i.e., the range of the available frequency space over which information may be transmitted. The rate at which information is provided over that channel is the data rate, which may not exceed the channel capacity.
The information capacity of any channel may be calculated from the available bandwidth of that channel and the noise level, and is given by a formula developed by Claude Shannon in the 1930s:
where BW is the bandwidth of the channel in Hz, and SNR is the ratio of the signal power to the noise power in that channel. This distinction between the concepts of “bandwidth” and “channel capacity” will become very important when considering certain display applications, such as the broadcast transmission of television signals.
It is important to note that this formula gives the theoretical maximum capacity of a given channel; this maximum is never actually achieved in practice, and how closely it may be approached depends very strongly on the encoding system used. Note also that this formula says nothing about whether the data are transmitted in “analog” or “digital” form; while these two options for display interfaces are compared in greater detail in later topics, it is important to realize that these terms fundamentally refer only to two possible means of encoding information. To assign certain attributes, advantages, or disadvantages to a system based solely on whether it is labelled “analog” or “digital” is often a serious mistake, as will also be discussed later.
In discussions of display interfaces and timings, the actual data rate is rarely encountered; it is assumed that the information on a per-pixel basis remains constant (or at least is limited to a fixed maximum number of bits), and so it becomes more convenient to discuss the pixel rate or pixel clock instead. (The term “pixel clock” usually refers specifically to an actual discrete clock signal which is used in the generation of the output image information or signal, but “pixel clock rate” is often heard even in applications in which no actual, separate clock signal is present on the interface.) In the example above, the pixel rate required is simply the data rate divided by the number of bits per pixel, or about 78.6 Mpixels/s. (If referred to as a pixel clock rate, this would commonly be given in Hz.)
Having covered the basics of imaging – at least as it relates to the display systems we are discussing here – and display interface issues, it is now time to consider two other areas which are of great importance in establishing an understanding of the fundamentals of display systems and their applications. These are the characteristics of human vision itself, and the role these play in establishing the requirements and constraints on our displays, and the surprisingly complex issue of color and how it is represented and reproduced in these systems. These are the topics of the next two topics.


![tmp7ee1-8_thumb[2] tmp7ee1-8_thumb[2]](http://what-when-how.com/wp-content/uploads/2012/06/tmp7ee18_thumb2_thumb.png)
![tmp7ee1-9_thumb[2] tmp7ee1-9_thumb[2]](http://what-when-how.com/wp-content/uploads/2012/06/tmp7ee19_thumb2_thumb.png)
