Introduction
This topic describes the so-called 3D scanning pipeline (i.e., how raw sampled 3D data have to be processed to obtain a complete 3D model of a real-world object). This kind of raw data may be the result of the sampling of a real-world object by a 3D scanning device [1] or by one of the recent image-based approaches (which returns raw 3D data by processing a set of images) [2]. Thanks to the improvement of the 3D scanning devices (and the development of software tools), it is now quite easy to obtain high-quality, high-resolution three-dimensional sampling in relatively short times.
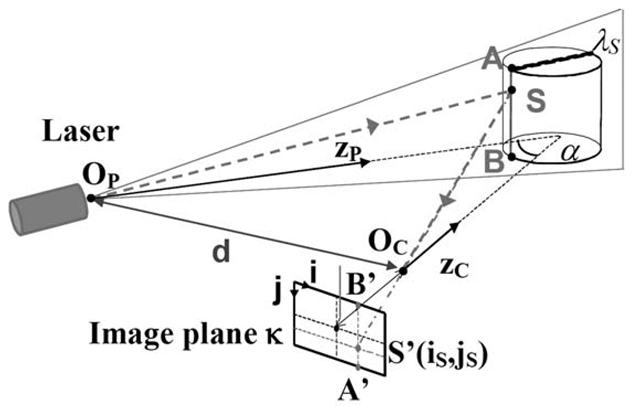
FIGURE 3.1
Schema of the geometric triangulation principle adopted by active optical scanners.
Conversely, processing this fragmented/raw data to generate a complete and usable 3D model is still a complex task, requiring the use of several algorithms and tools; the knowledge of the processing tasks and solutions required is still the realm of well-informed practitioners and it often appears as a set of obscure black boxes to most of the users. Therefore, we focus the topic on: (a) the geometric processing tasks that have to be applied to raw 3D scanned data to transform them into a clean and complete 3D model, and (b) how 3D scanning technology should be used for the acquisition of real artifacts. The sources of sample 3D data (i.e., the different hardware systems used in 3D scanning) are briefly presented in the following subsection. Please note that the domains of 3D scanning, geometric processing, visualization, and applications to CH are too wide to provide a complete and exhaustive bibliography in a single topic; we decided to describe and cite here just a few representative references to the literature. Our goal is to describe the software processing, the pitfalls of current solutions (trying to cope both with existing commercial systems and academic tools/results), and to highlight some topics of interest for future research, according to our experience and sensibility. The presentation follows in part the structure of a recently published paper on the same subject [3].
Sources of Sampled 3D Data
Automatic 3D reconstruction technologies have evolved significantly in the last decade; an overview of 3D scanning technologies is presented in [1,4,5]. The technological progress in its early stages has been driven mostly by industrial applications (quality control, industrial metrology). Cultural heritage (CH) is a more recent applications field, but its specific requirements (accuracy, portability, and also the pressing need to sample and integrate the color information) were often an important testbed for the assessment of new, general-purpose technologies.
Among various 3D scanning systems, the more frequently used for 3D digitization are the so-called active optical devices. These systems shoot some sort of controlled, structured illumination over the surface of the artifact and reconstruct its geometry by checking how the light is reflected by the surface. Examples of this approach are the many systems based on the geometric triangulation principle (see Figure 3.1). These systems project light patterns on the surface, and measure the position of the reflected light by a CCD device located in a known calibrated position with respect to the light emitter.
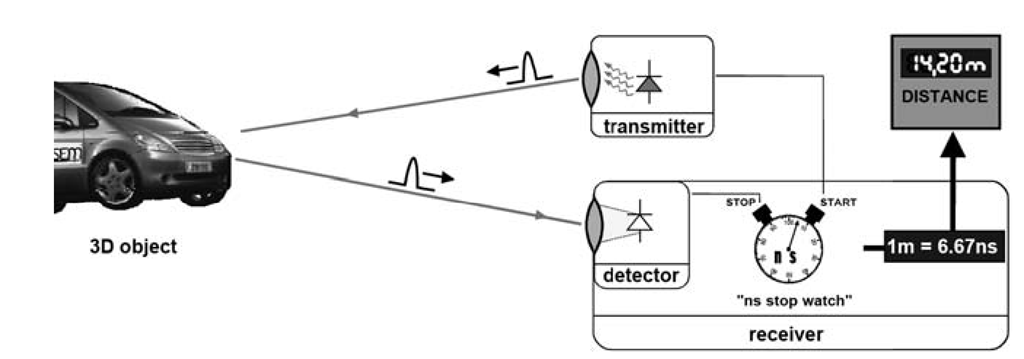
FIGURE 3.2
Basic principle of a time-of-flight scanning system.
Light is either coherent, usually a laser stripe swept over the object surface, or incoherent, such as the more complex fringe patterns produced with video- or slide-projectors. Due to the required fixed distance between the light emitter and the CCD sensor (to be accurate, the apex angle of the triangle that interconnects the light emitter, the CCD sensor and the sampled surface point should be not too small, i.e., 10-30 degrees), those systems usually support working volumes that range from a few centimeters to around one meter.
The acquisition in a single shot of a much larger extent is supported by devices that employ the so-called time-of-flight (TOF) approach (see Figure 3.2). TOF systems send a pulsed light signal towards the surface and measure the time elapsed until the reflection of the same signal is sensed by an imaging device (e.g., a photo-diode). We can compute, given the light speed, the distance to the sampled surface; since we know the direction of the emitted light and the distance over this line, the XYZ locations of the sampled point can be easily derived. An advantage of this technology is the very wide working volume (we can scan an entire building facade or a city square with a single shot); when compared with the capabilities of triangulation-based systems, disadvantages of TOF devices are the lower accuracy and lower sampling density (i.e., the inter-sampling distance over the measured surface is usually in the range of the centimeter). The capabilities of TOF devices have been improved recently with the introduction of variations of the basic technology, based on modulation of the sensing probe, that allowed to increase significantly the sampling speed and maintain very good accuracies (in the order of a few millimeters).
Very promising but still not very common are the passive optical devices, where usually a large number of images of the artifact are taken and a complete model is reconstructed from these images [2,7,8]. These approaches, mostly based on consumer digital photography and sophisticated software processing.
The quality of the contemporary commercial scanning systems is quite good if we take into account accuracy and speed of the devices; unfortunately, cost is still high, especially for CH applications, which are usually characterized by very low budgets. The introduction of inexpensive low-end laser-based systems (e.g., the Next Engine device [9]), together with the impressive improvement of image-based 3D reconstruction technologies (e.g., the Arc3D web-based reconstruction tool [10,11]) are very beneficial for the field. The availability of low-cost options is strategical to increase the diffusion of 3D scanning technology and to rise awareness and competence in the application domain. Moreover, a wider user community could ultimately drive to significant price reduction of the high-end scanning systems as well.
Finally, most of the existing systems consider just the acquisition of the external shape (geometric information), while a very important aspect in many applications is color sampling. This limitation is caused mainly by the fact that most 3D sensors come from the industrial world and therefore are designed to focus more on geometry acquisition than color.
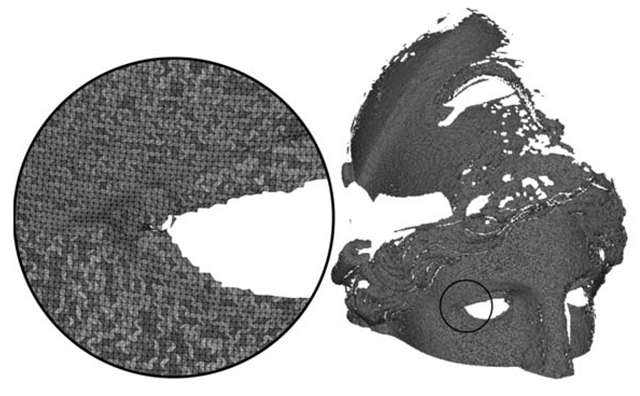
FIGURE 3.3
An example of a range map (from the 3D scanning of the Minerva of Arezzo, National Archeological Museum in Florence, Italy.)
Color is the weakest feature of contemporary technology, since the color-enabled scanners produce usually just a low-quality sampling of the surface color (with a notable exception of the technology based on multiple laser wavelengths [12], unfortunately characterized by a very high price that made their market share nearly negligible). Moreover, existing devices sample only the apparent color of the surface and not its reflectance properties, that constitute the characterizing aspect of the surface appearance. There is wide potential for improving current technology to cope with more sophisticated surface reflection sampling.
Basic Geometric Processing of Scanned Data
Unfortunately, almost every 3D scanning system does not produce a final, complete 3D model but a large collection of raw data which have to be post-processed. This is especially the case of all active optical devices, since only the portion of the surface directly visible from the device is captured in a single shot. The main problem of a 3D acquisition is indeed this fragmentation of the starting data: scanners do not produce a complete model by simply pushing a button (unless the application field is very restricted, such as some devices designed specifically for scanning small objects, e.g., teeth). On the other hand, the good news is that most of the scanning technologies produce raw data which are very similar: the so-called range maps (see Figure 3.3). This homogeneity in the input data makes the 3D scan processing quite independent from the specific sampling device adopted. Of course, depending on: the technology and specifications of the employed sensor; the scale, material, and nature of the target object; and the kind of 3D model needed, the various processing phases might slightly vary, but the main phases and the workflow will generally still fall in the scheme we present here. The result of a single scan, a range map, is the counterpart of a digital image: while a digital image encodes in each pixel the specific local color of the sampled surface, the range map contains for each sample the geometrical data (a point in XYZ space) which characterize the location in the 3D space of the corresponding small parcel of sampled surface. The range map therefore encodes the geometry of just the surface portion which can be seen and sampled from a selected viewpoint (according to the specific features of the scanning device).
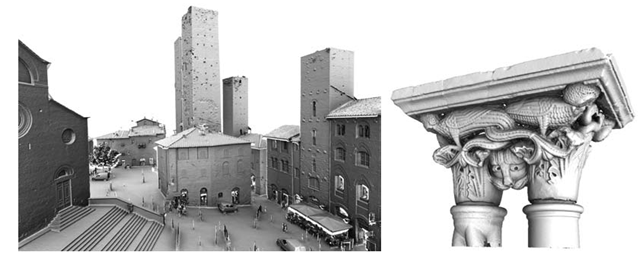
FIGURE 3.4
Two examples of results obtained with: a time-of-flight (TOF) scanner, depicting the Dome square at S. Gimignano (Italy); laser-line triangulation scanner, depicting a capitol from the cloister of the Dome at Cefalu (Italy).
The complete scan of an artifact requires usually the acquisition of many shots taken from different viewpoints, to gather complete information on its shape. Each shot produces a range map. The number of range maps required to sample the entire surface depends on: the working volume of the specific scanner; the surface extent of the object; and its shape complexity. Usually, we sample from a few tens up to a few hundred range maps for each artifact. Range maps have to be processed to convert the data encoded into a single, complete, non-redundant and optimal 3D representation (usually, a triangulated surface or, in some cases, an optimized point cloud). Examples of digital models produced with 3D scanning technology are presented in Figure 3.4 .
The 3D Scanning Pipeline
As previously stated, the homogeneous nature of the raw data makes the processing quite independent from the scanning device used and the processing software adopted. The processing of the raw data coming from the 3D scanning device is divided in subsequential steps, each one working on the data produced in the previous one; hence the name 3D scanning pipeline. These steps are normally well recognizable in the various software tools, even if they are implemented with very different algorithms. Before or after each step, there may be a cleaning stage, aimed at the elimination of small defects of the intermediate data that would make the processing more difficult or longer. The overall structure of the 3D scanning pipeline is presented in an excellent overview paper [13], which describes the various algorithms involved in each step. Some new algorithms have been proposed since the date of publication of that review paper, but the overall organization of the pipeline is not changed.
The processing phases that compose the 3D scanning pipeline are:
• Alignment of the range maps. By definition the range map geometry is relative to the current sensor location (position in space, direction of view); each range maps is then in a different reference frame. The aim of this phase is to place the range maps into a common coordinate space where all the range maps lie in the correct position with respect to each another. Most alignment methods do require user input and rely on the overlapping regions between adjacent range maps.
• Merge of the aligned range maps to produce a single digital 3D surface (this phase is also called reconstruction). After the alignment, all the range maps are in the correct position, but the object is still composed by multiple overlapping surfaces with lot of redundant data. A single, non-redundant representation (usually, a triangulated mesh) has to be reconstructed out of the many partially overlapping range maps. This processing phase, generally completely automatically, exploits the redundancy of the range maps data in order to produce (often) a more correct surface where the sampling noise is less evident than in the input range maps.
• Mesh editing. The goal of this step is to improve (if possible) the quality of the reconstructed mesh. For example, usual actions are to remove or reduce impact of noisy data or to fix the unsampled regions (hole filling).
• Mesh simplification and multiresolution encoding. 3D scanning devices produce huge amount of data; it is quite easy to produce 3D models so complex that it is impossible to fit them in RAM or to display them in real time. This complexity has usually to be reduced in a controlled manner, by producing discrete level of details (LOD) or multiresolution representations.
• Color mapping. The information content is enriched by adding color information (an important component of the visual appearance) to the geometry representation.
All these phases are supported either by commercial [14-16] or academic tools [17-19]. Unfortunately, given the somehow limited diffusion of 3D scanning devices (mainly due to their cost) and the still restricted user base of this kind of technology in non-industrial environments, it is not so easy to find free software tools to process raw 3D data. The availability of free tools would be extremely beneficial to the field, given the considerable cost of the major commercial tools, to increase awareness and dissemination to a wider user community. These instruments could be very valuable for the CH institutions that want to experiment with the use of this technology on a low budget. Most of the non-commercial development of processing tools has been carried out in the academic domain; some of those efforts are sponsored by European projects [20,21]. The very recent availability of low-cost scanning devices or of image-based 3D acquisition approaches, paired with availability of free processing tools, could boost the adoption of 3D scanning technologies in many different application domains. The different phases of the scanning pipeline are presented in a more detailed manner in the following subsections.
Alignment
The alignment task converts all the acquired range maps in a common reference system. This process is usually partially manual and partially automatic. The user has to find an initial, raw registration between any pair of overlapping range maps; the alignment tool then uses this approximate placement to compute a very accurate registration of the two meshes (local registration). The precise pair-wise alignment is usually performed by adopting the Iterated Closest Point (IPC) algorithm [22,23], or variations of the same. This pairwise registration process (repeated on all pairs of adjacent and overlapping range maps) is then used to automatically build a global registration of all the meshes, and this last alignment is enforced among all the maps in order to move everything in a unique reference system [24]. Range map alignment has been the focus of a stream of recent papers; we cite here only one single result [25], the interested reader can find references to other recent approaches in the previous work.
Quality of the alignment is crucial for the overall quality of the merged model, since errors introduced in alignment may be the cause of wrong interpolation while we merge the range maps. Since small errors could add one to the other, the resulting global error can be macroscopic. An example of 3D acquisition where this potential effect has been monitored and accurately measured is the acquisition of Donatello’s Maddalena [26]. A methodology for quality control is proposed in that paper, where potential incorrect alignment produced by ICP registration is monitored and corrected by means of data coming from close-range digital photogrammetry.
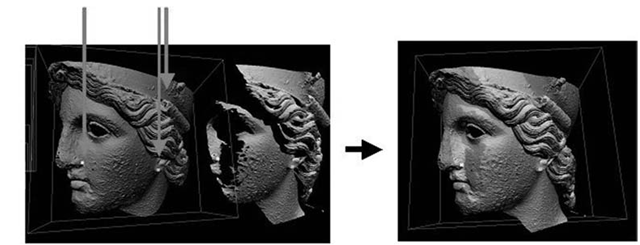
FIGURE 3.5
An example of a pair-wise alignment step: the selection of a few corresponding point pairs on the two range maps allows one to find an initial alignment, which is then refined by the ICP algorithm.
The alignment phase is usually the most time-consuming phase of the entire 3D scanning pipeline, due to the substantial user contribution required by current commercial systems and the large number of scans sampled in real scanning campaigns. The initial placement is heavily user-assisted in most of the commercial and academic systems (requiring the interactive selection and manipulation of the range maps). Moreover, this kernel action has to be repeated for all the possible overlapping range map pairs (i.e., in average 6-8 times the number of range maps). Consider that the scanning of a 2 meters tall statue generally requires from 100 up to 500 range maps, depending on shape complexity and sampling rate required. If the set of range maps is thus composed by hundreds of elements, then the user has a very complex task to perform: for each range map, find which are the partially-overlapping ones; given this set of overlapping range maps, determine which one to consider in pair-wise alignment (either all of them or a subset); finally, process all those pair-wise initial alignments. If not assisted, this becomes the major bottleneck of the entire process: a slow, boring activity that is also really crucial for the accuracy of the overall results (since an inaccurate alignment may lead to very poor results after the range maps merging). An improved management of large sets of range maps (from 100 up to 1,000) can be obtained by both providing a hierarchical organization of the data (range maps divided into groups, with atomic alignment operations applied to an entire group rather than to the single scan) and by using a multiresolution representation of the raw data to increase efficiency of the interactive rendering/manipulation process over the range maps. Moreover, since the standard approach (user-assisted selection of each overlapping pair and creation of the correspondent alignment arc) becomes very impractical on large sets of range maps, tools for the automatic setup of most of the required alignment actions have to be provided (see subsection 3.2.2).
