Sample Images
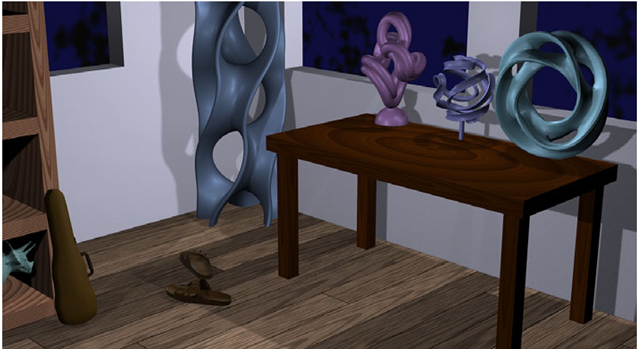
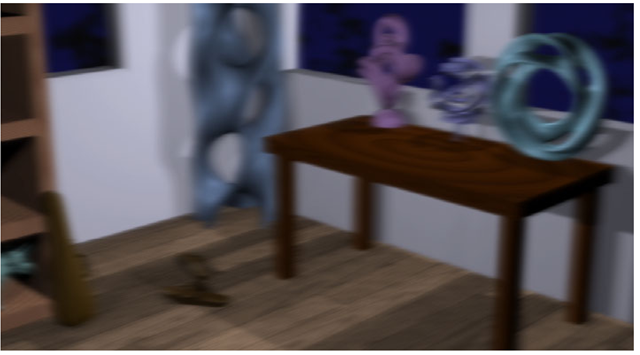
Figures 1, 19, 20, and 21 are vision-realistic renderings of a room scene. Figure 18 is a simulation that models ideal vision and Figures 1, 19, 20, and 21 are simulations of the vision of actual individuals based on their measured data. Notice that the nature of the blur is different in each image. The field of view of the image is approximately 46° and the pupil size is rather large at 5.7 mm.
For Figure 18, we constructed an OSPSF from a planar wavefront to yield a simulation of vision for an aberration-free model eye.
The simulation of vision shown in Figure 19 is based on the data from the left eye of male patient GG who has astigmatism. Note how the blur is most pronounced in one direction (in this case horizontal), which is symptomatic of astigmatism.
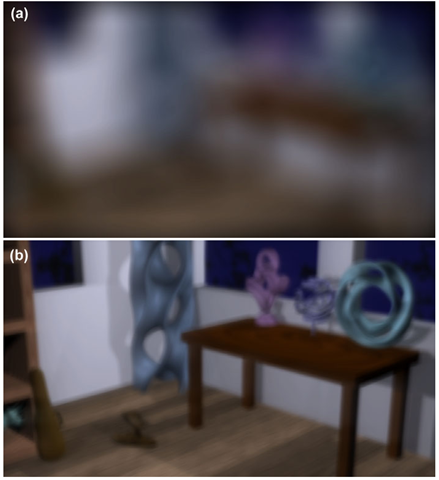
Next, we show vision-realistic rendered images based on pre- and post-operative data of patients who have undergone LASIK vision correction surgery. Specifically, the vision for the right eye of male patient DB is simulated in Figure 20, and then Figure 21 simulates the vision of the left eye of male patient DR.
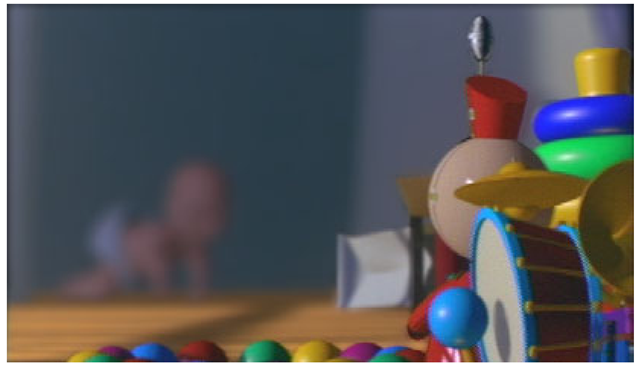
Fig. 16. Artifacts eliminated by the Adjacent Pixel Difference technique for image focused on the Tin Toy in the foreground
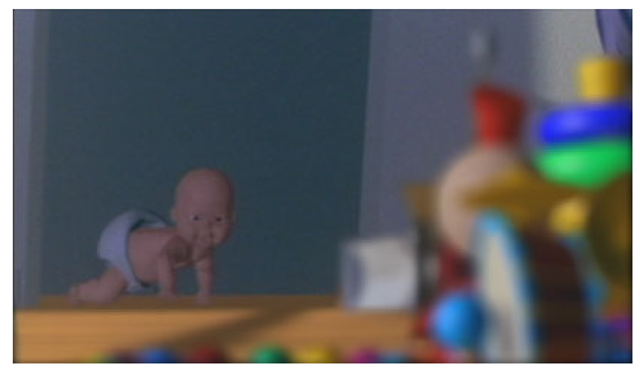
Fig. 17. Artifacts eliminated by the Adjacent Pixel Difference technique for image focused on baby in the background
Fig. 18. Simulation of vision of an aberration-free model eye
Fig. 19. Simulation of vision of astigmatic patient GG
For each patient, the preoperative vision is simulated in the top image while the lower image simulates the postoperative vision. The images demonstrating pre-operative vision show the characteristic extreme blur pattern of the highly myopic (near-sighted) patients who tend to be the prime candidates for this surgery. Although, in both cases, the vision has been improved by the surgery, it is still not as good as the aberration-free model eye. Furthermore, the simulated result of the surgery for patient DB is slightly inferior to that depicted for patient DR. However, note that the patient (DB) with the inferior surgical result had significantly inferior pre-operative vision compared to that of patient DR.
Figure 1 is computed based on data measured from the left eye of female patient KS who has the eye condition known as keratoconus. This image shows the distortion of objects that is caused by the complex, irregular shape of the keratoconic cornea. Note how the nature of these visual artifacts is distinct from what would generally be a smooth blur that occurs in more pedestrian vision problems such as myopia (see Figure 21(a)). This distinction is often not understood by clinicians when it is articulated by kerato-conic patients. We hope our techniques could be used in optometry and ophthalmology for the education of students and residents as well as for the continuing education of clinicians.
Our approach can also be applied to photographs (with associated depth maps) of real scenes, not only to synthetic images. For example, in Figure 22, the top image is a photograph showing the Campanille at U.C. Berkeley with San Francicsco’s Golden Gate Bridge in the background, with both the tower and bridge are in sharp focus. Constructing an OSPSF with the point of focus at the Campanille and then applying our algorithm yields an image with the background blurred, as shown in bottom image.
To consider the computational requirements of our technique, note that it comprises three parts: fitting the wavefront surface, construction of the OSPSF and the rendering step.
Fig. 20. Simulation of vision of LASIK patient DB based on (a) Pre-operative and (b) Postoperative data
The computation time for the surface fitting is negligible. The time to compute the OSPSF depends on the number of wavefront samples. For the images in this paper, the computation of the OSPSF, using one million samples, was less than half a minute. The rendering step is dominated by the FFTs performed for convolution (our kernels are generally too large to convolve in the spatial domain). Thus, the computation time for the rendering step is dependent on the image size and the number of non-empty depth images. The room scene has a resolution of 1280 X 720 and each image took about 8 minutes to render, using 11 depth images, on a Pentium 4 running at 2.4 GHz, using Matlab. This time could be significantly reduced by converting to a C or C++ implementation with a standard FFT library.
Fig. 21. Simulation of vision of LASIK patient DR based on (a) Pre-operative and (b) Postoperative data
Validation
An important area of future work is validation, and will involve the establishment of psychophysical experiments. Nonetheless, some preliminary experiments are possible immediately, and our initial results have been positive. First, patients who have unilateral vision problems can view our simulations of the vision in their pathological eye using their contralateral eye, thereby evaluating the fidelity of the simulation. Second, consider patients who have vision conditions such as myopia, hyperopia, and astigmatism, that are completely corrected by spectacles or contact lenses. More precisely, in optometry terms, they might have 20/20 BSCVA (best spectacle corrected visual acuity).
Fig. 22. Original photograph with both Campanille and Golden Gate Bridge in focus (top) and output image with background blurred (bottom)
Such patients could validate the quality of the depiction of their vision in vision-realistic rendered images simply by viewing them while wearing their corrective eyewear. Third, the visual anomalies present in keratoconus are different from those in more common conditions such as myopia, and this distinction is indeed borne out in our example images. Specifically, keratoconus can cause the appearance of diplopia (double-vision) whereas myopia usually engenders a smooth blur around edges. Indeed, exactly this distinction can be observed upon close examination of our sample images. Fourth, severe astigmatism causes more blur in one direction than in the orthogonal direction, and this is exactly what is depicted in our sample image of astigmatism. Fifth, our simulations of the vision of patients with more myopia are more blurred than those of patients with less myopia.
Conclusions and Future Work
We introduced the concept of vision-realistic rendering - the computer generation of synthetic images that incorporate the characteristics of a particular individual’s entire optical system. This paper took the first steps toward this goal, by developing a method for simulating the scanned foveal image from wavefront data of actual human subjects, and demonstrated those methods on sample images. First, a subject’s optical system is measured by a Shack-Hartmann wavefront aberrometry device. This device outputs a measured wavefront which is sampled to calculate an object space point spread function (OSPSF). The OSPSF is then used to blur input images. This blurring is accomplished by creating a set of depth images, convolving them with the OSPSF, and finally compositing to form a vision-realistic rendered image. Applications of vision-realistic rendering in computer graphics as well as in optometry and ophthalmology were discussed.
The problem of vision-realistic rendering is by no means solved. Like early work on photo-realistic rendering, our method contains several simplifying assumptions and other limitations. There is much interesting research ahead.
The first limitations are those stemming from the method of measurement. The Shack-Hartmann device, although capable of measuring a wide variety of aberrations, does not take into account light scattering due to such conditions as cataracts. The wavefront measurements can have some error, and fitting the Zernike polynomial surface to the wavefront data can introduce more. However, since the wavefronts from even pathological eyes tend to be continuous, smooth interpolation of the Shack-Hartmann data should not produce any significant errors. Consequently, any errors that are introduced should be small and, furthermore, such small errors would imperceptible in final images that have been discretized into pixels.
Strictly speaking, the pupil size used for vision-realistic rendering should be the same as the pupil size when the measurements are taken. However, the error introduced in using only part of the wavefront (smaller pupil) or extrapolating the wavefront (larger pupil) should be quite small. We have made use of three assumptions commonly used in the study of human physiological optics: isoplanarity, independence of accommodation, and off-axis aberrations being dominated by on-axis aberrations. Although we have argued that these assumptions are reasonable and provide a good first-order approximation, a more complete model would remove at least the first two.
As discussed in Section 5.1, we have assumed "independence of accommodation” since aberrometric measurements with the eye focused at the depth is not usually available. However, this is not a limitation of our algorithm. Our algorithm can exploit wavefront data where the eye is focused at the depth that will be used in the final image, when such a measurement is made.
We currently do not take chromatic aberration into account, but again that is not a limitation of our algorithm. Since the data we acquire is from a laser, it is monochromatic. However, some research optometric colleagues have acquired polychromatic data and will be sharing it with us. It is again interesting that recent research in optometry by Marcos [56] has shown that except for the low order aberrations, most aberrations are fairly constant over a range of wavelengths.
We only compute the aberrations for one point in the fovea, and not for other points in the visual field. However, it is important to note that for computer graphics, the on-axis aberrations are critically important because viewers move their eyes around when viewing a scene. If we had actually included the off-axis aberrations of the eye, then the off-axis parts of the scene would have been improperly blurred for a person who is scanning the scene. The off-axis aberrations are of minor concern even without eye movements since the retinal sampling of cones is sparse in peripheral vision. The image that we are simulating is formed by viewing the entire scene using the on-axis aberrations because we assume that the viewer is scanning the scene.
However, since peripheral vision does makes important contributions to visual appearance, viewers are affected by optical distortions of peripheral vision. Thus, it is of interest to extend this method to properly address the off-axis effects.
