The current state-of-the-art sequencing relies on the Sanger dideoxy chain termination method (Sanger et al., 1977). The method is based on a DNA synthesis process controlled by adding labeled dideoxy terminators, ddNTPs, into a polymerase reaction. DNA polymerases copy single-stranded DNA templates by incorporating nucleotides at the 3′ end of a primer annealed to the template DNA. The polymerase grows a new DNA strand by adding a nucleotide to the 3′-hydroxyl group at the growing end. The Sanger method exploits the fact that DNA polymerases are able to incorporate nucleotide analogs, such as dideoxynucleotides, ddNTPs, and fluorescently labeled terminators. ddNTPs are nucleotides that lack the 3′-hydroxyl group, while the label of the terminators block the 3′-position. By adding terminators, along with ordinary dNTPs, to the reaction, the elongation process is terminated once a terminator is incorporated. Since each terminator carries a different fluorescently colored label, we will be able to tell at which nucleotide the elongation was terminated. Several rounds of elongation will generate fragments of all sizes. These fragments are subsequently size-ordered by electrophoresis, and the nucleotide sequence can be read by detecting fluorescence after the labels are excited by a laser beam. This analysis is routinely performed in automatic sequencers, which usually utilize capillary electrophoresis.
Automatic sequencers produce so-called electropherograms or chromatograms (Figure 1), which are analyzed by specialized base-calling software (Ewing et al., 1998; Andrade and Manolakos, 2003; ABI, 1996) to determine the nucleotide sequence of the original template. The peak height is related to the number of fragments, which have the same length and end with the same nucleotide. The x-axis in a chromatogram is the time when the subpopulation has arrived to the detector of the sequencer. Depending on the terminators used, a specific mobility shift correction may be necessary, due to differences in migration caused by the different labels.
Figure 1 A section of a chromatogram produced by an automatic DNA sequencer. There are four different traces: Red for T, black for G, green for A, and blue for C. The x-axis is the time line when a subpopulation passes the detection point. The peak height is related to the number of fragments passing the detection point
Ideally, peaks in chromatograms for all four traces, one for each base, would be Gaussian-shaped and distributed evenly with no background noise. In real life, many factors perturb the signal detection, which make the base-calling procedure challenging and occasionally error prone. Some of the most important factors are:
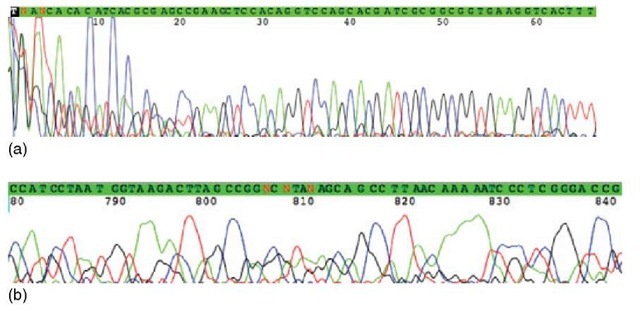
1. In the beginning of the chromatogram, large and noisy peaks appear owing to unincorporated dyes, usually roughly the first 10 to 30 bases (Figure 2).
2. Toward the end of the chromatogram, peaks will be less evenly spaced and lumpy caused by diffusion of the fragments in the gel and by the loss of resolution due to the decrease in the difference of the relative mass of the fragments (Figure 2).
Figure 2 In the beginning of the chromatogram, large and noisy peaks appear because of unincorporated dyes. The first 66 positions are shown in (a). The peak height gets smaller toward the end of the chromatogram due to decreasing quantity of ddNTPs. The peaks may also be lumpy and unevenly spaced, which is caused by diffusion and the loss of resolution. Toward the end, the relative difference of the mass of the fragments decreases. The last 780-841 positions are shown in (b)
3. Toward the end of the chromatogram, the peak height gets smaller due to decreasing quantity of terminators relative to dNTPs.
4. The peaks may be compressed as a result of the formation of secondary structures in DNA fragments, such as hairpins. This is particularly common in GC-rich sequences.
5. Primer-dimer formation may cause false stops.
6. Uneven quantity of fragments may in some cases cause problems (ABI, 1996).
Thus, a base may be erroneously called, uncalled, or missed. These errors result in substitutions, deletions, and insertions of nucleotides respectively. Several attempts have been made to improve the quality of base calling (Ewing et al., 1998; Andrade and Manolakos, 2003; Davies etal., 1999; Brady etal., 2000; Giddings et al., 1998). It is, however, unlikely that the sequence data will ever become error free. Thus, it is necessary to try to improve the data quality using downstream methods. The latter include redundant sequencing, where the same region is sequenced several times, estimation of error probabilities, and error-correction methods.
In the shotgun sequencing method, the same genomic region is routinely sampled 5 to 10 times. This will increase the reliability of the data, since each base is sequenced several times and a so-called consensus sequence may be computed from the multiple alignments of the redundant sequences (Figure 3).
Figure 3 In a multiple alignment, a consensus sequence may be computed. A section of an alignment is shown in the Consed editor (Gordon et al., 1998). The numbers at the top are contig positions, followed by the consensus sequence and the reads. On the left are the read names, and arrows show the direction of the reads. The line in the middle separates the two DNA strands
Estimation of error probabilities of called bases is a powerful method to cope with sequencing errors. Many early base-calling algorithms estimated confidence values (Giddings et al., 1993; Giddings et al., 1998; Golden et al., 1993). Lawrence and Solovyev (1994) performed an extensive study and defined a large number of chromatogram parameters and analyzed them to determine which are most effective in distinguishing accurate base-calls. The base-calling program Phred (Ewing et al., 1998) is widely used today because of its ability to estimate the probability of an error in a base-call. Phred quality values have become the de facto standard within the sequencing community (Richerich, 1998). The quality values are logarithmic and range from 0 to 99. They are defined as follows:
where q is the quality of the base-call and P is the estimated error probability of the call. The range of the Phred quality values is wide. For example, a quality value 10 means that in average one out of 10 calls is wrong and a value of 60 means that in average one out of a million base-calls is in error. In a typical sequence read, the quality is usually lowest toward the end of the reads as described above.
By characterizing signal traces in chromatograms and assigning parameter values to base-calls in sequences from an already known nucleotide sequence, it is possible to compare the output from a base-calling program to a benchmark data set. The relation to the frequency of base-calling errors can now be related to the parameter values calculated for each base-call. This can be used to estimate error probabilities in an unknown sequence by comparing parameter values of the known error frequencies. Phred uses a lookup table containing 2011 lines to set quality values. However, Phred does not provide any probabilities of missing base-calls or probabilities for any of the three other uncalled bases.
A widely used fragment assembly program, Phrap (http://www.phrap.org, 2005) utilizes Phred quality values. Phrap does not perform error correction, but uses a statistical framework to determine read overlaps. The quality values are also used in the computation of the consensus sequence, in most cases resulting in a more reliable sequence. Phrap assigns error probabilities to the consensus sequence itself, which helps to pinpoint problematic areas in assemblies.
The key problem in fragment assembly is the correct assembly of reads sampling repeated regions. The original genome sequence is reconstructed from short, redundantly sampled reads by using the criteria of similarity in the sequence. Similar reads are aligned together into multiple alignments, which form contiguous sequences, so-called contigs. In general, genomic sequences contain many repeats that may be identical or almost identical, and it is extremely difficult to distinguish the differences between reads originating from different repeated regions from sequencing errors. This is especially true when the difference between repeat copies is below 3%. Note that the error rate in sequencing varies and may be up to 11%. However, reads are normally trimmed at the ends to reduce errors, and an average remaining sequencing error in trimmed reads is somewhere around 1-2%. Error correction would reduce this problem.
Currently, there are three software tools that perform error correction on shotgun sequences: MisEd (Tammi et al., 2003), EULER (Pevzner et al., 2001), and AutoEditor (Gajer et al., 2004), each of which use a different approach to the problem.
MisEd creates multiple alignments of shotgun reads. In this approach, the errors are corrected by first detecting differences between repeated reads using a statistical approach described by Tammi et al. (2002). If the multiple alignments are properly constructed, all the remaining differences must be sequencing errors. MisEd corrects these simply by converting the remaining differences to agree with the consensus base. In alignments that solely consist of nonrepeated or unique reads, all observed differences should be errors, since these reads sample the same genomic region. In the shotgun sequencing approach, the same genomic regions are generally sampled 5 to 10 times in average, and it is fairly easy to assemble reads originating from nonrepeated regions of the genome.
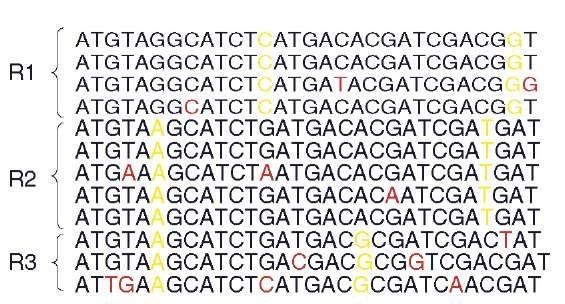
Patterns of differences between reads can be observed by creating multiple alignments of all similar reads in a shotgun project. An example of such an alignment is shown in the Figure 4, in which reads from different, very similar genomic repeats are aligned. Differences between reads caused by sequencing errors appear random, but a systematic appearance of differences between reads originating from separate repeat copies can be observed. In fact, the appearance of sequencing errors can be approximated by the Poisson process. This phenomenon is utilized in the MisEd program, which computes the probability of a random appearance of such patterns. If the estimated probability of observing a pattern of differences by random sequencing errors is very low, below a certain threshold, the differences are considered to be true differences. These differences are labeled as Defined Nucleotide Positions (DNPs). Errors are corrected by converting all, but DNPs into the same base as the consensus base in the alignment.
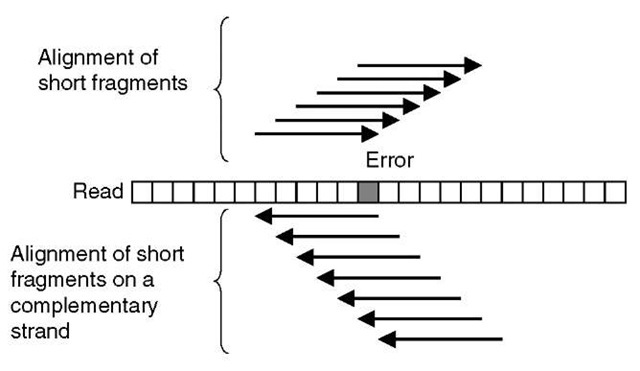
EULER or EULER assembler is a shotgun assembly program, which contains an error-correction step. In this approach, the reads are chopped into small pieces, roughly 40-bases long, and so-called spectral alignments using these short fragments are constructed (Figure 5). These alignments of short fragments display a similar pattern of differences between fragments as multiple alignments constructed of whole-shotgun reads. Sequence errors appear sporadically and real differences between repeats appear more systematically, that is, more frequently in a column of the alignment. The count of short fragments aligned on each read is analyzed and erroneous positions determined by the number of aligned short fragments (Figure 5). The EULER program does not rely on any statistical framework. Certain parameters are used to set the lower threshold of the number of differences accepted as sequencing errors. All bases below this limit are considered to be caused by sequencing errors and converted to the consensus base. The parameters are user definable.
Figure 4 An example of an alignment of reads originating from repeat copies located in different genomic regions. The systematic appearance of differences can be observed for the real differences between repeat copies. The appearance of sequencing errors is sporadic. The repeat copies are marked as R1, R2, and R3
Figure 5 A schematic illustration of a spectral alignment of short fragments of reads. An error in a read affects the number of short read fragments, which can be aligned exactly on a read and its complementary strand
AutoEditor combines an approach of realigning shotgun reads to the consensus sequence and reexamination of the chromatogram data produced by sequencers. By recalling suspicious base-calls, AutoEditor is effectively able to correct errors. However, surprisingly, this program does not yield better results than the two previously described methods, even though chromatogram data is reexamined.
Sequencing errors are the root of the challenges in genome sequencing, particularly in combination with repeated genomic regions. They cause many errors in genome assemblies, and finishing of the projects requires a lot of manual labor. Perhaps we will see many automated finishing tools utilizing some kind of error correction/analysis methods in the near future.


