Abstract
Wireless Sensor networks have become one of the most widely-used forms of ad-hoc networks which have countless number of applications in the modern life. Due to the unreliable communication medium and the failure-prone sensors, coverage is an important functional property of a sensor network. Coverage is represented as a function of sensor density, which in turn depends on sensing range and the deployment function. The sensing range and the deployment function have random nature that can greatly affect sensor coverage. In this study, we subjected a densely deployed sensor network to stochastic variations in sensing range and deployment. Also, we captured deployment variations in space dimension by a random deployment pattern and a random noise. In addition, we considered time dependent random variation in noise and environmental factors. More specifically, we studied the effect of randomness resulting in a certain percentage of uncovered area in the network.
Keywords: Wireless Network, Coverage, Connectivity, Deployment, Node Density.
Introduction
The recent advances in CMOS technologies and wireless communications have enabled the development of tiny, battery-operated multifunctional sensor nodes [1]. These tiny devices are characterized by their low cost, short radio range, limited supply energy and inadequate processing capabilities. Providing unlimited number of applications, wireless sensor networks (WSNs) are composed of a large set of sensors deployed randomly or uniformly in a field, where air is the communication medium between them. Typically, sensor nodes have the ability of monitoring a wide variety of ambient conditions. Upon detecting an event, sensors cooperate together to deliver the sensed data to the base station (sink), thus, each sensor acts as data source and data router for other sensors data. The applications in which sensor networks are valuable include surveillance, agricultural, medical, army, fire fighting and many more.
Sensor networks are subject to node failure due to their limited power supply of the sensor nodes. Thereby, coverage is by far the most important property of sensor networks that takes into consideration sensing ability of individual sensors in addition to the deployment strategy. Sensors coverage is the problem of node deployment for the purpose of sensing [2]. In order to explain the importance of the coverage problem, consider a sensor network deployed for the purpose of intrusion detection. This sensor network must report every intrusion detected immediately in order to take the suitable action. At any given time, if there is any part of the network that is not covered by sensor nodes, undesirable consequences may happen. Therefore, we must guarantee the continuous coverage for the whole field.
Depending on the constraint of a given application, the coverage problem can be studied as worst-case coverage [3], deterministic coverage [3], [4] or stochastic coverage [3], [4], [5], [6], [7]. Moreover, apart from sensing function, a sensor network also needs to attain the required connectivity in order to relay the data to the appropriate nodes. Therefore, coverage and connectivity form the two basic density control properties of sensor network. Furthermore, a region is fully covered if there is at least one sensor to cover each point in that region. Extending this definition, a region is K-covered, if there are at least K sensors that cover every point in that region. Coverage can be defined in terms of percentage of the covered area since some applications may not require 100% coverage. In order to satisfy the coverage requirements aforementioned, the density of the deployed sensors along with the deployment strategy must be carefully examined.
Apart from determining the sensor deployment density, there are other questions of vital importance. Of utmost vitality, is the energy efficiency, and connectivity insurance which can be attained through several protocols and algorithms at the MAC, topology control and routing layers [13][14][18].
While connectivity involves the sensors’ transmission range, coverage involves the sensing range. However, there is a relationship between the two properties as shown in the following equation [5].
Thus, in order to maintain the network connectivity, each sensor must have a transmission radius that is double the sensing radius as shown in Fig. 1.
Fig. 1. The relation between the transmission range and the sensing range
Coverage and sensor density also has significant implications upon the design of MAC and routing protocols. Typically, in a dense system with stringent K-coverage requirement, high sensor density may lead to scalability and coordination problems.
The remainder of this paper is organized as follows: the next section summarizes the related work. In Section 2, we introduce the concepts of deployment density, sensing radius, sensor footprint and network lifetime. Section 3 & 4 present the system model and the experimental results that support our model. Finally in Section 5, the conclusion and directions for future work are discussed.
Previous Work
Coverage problem represents one of the fundamental problems in sensor networks; thereby a large body of research has been conducted in this context. The sensor networks are energy constrained, hence, a small duty cycle in their sensing and transmission functions is preferable. The majority of the routing protocols focus on maintaining coverage (and thereby the connectivity) by conserving nodes energy during routing and also during sensing activities. For instance, PEAS protocol has proposed energy conservation mechanism for sensing functions via sleep cycles [14]. The protocol maintains working sensors while turns off unnecessary ones. This assumes a dense network in which turning off some sensors will not affect the network performance. On the other hand, OGDC protocol geometrically optimizes coverage via minimum overlapping [16].
In [8] the sensor network is partitioned into n non-intersecting cover set. Depending on the deployment, each cover set contains random number of sensors. Any sensor can perform the sensing task within the cover set, so it is possible to deactivate some sensors to save their energy if other sensors can perform the monitoring task. The monitoring task is rotated between the sensors so that their energy is consumed fairly.
A distributed coverage algorithm based on a node scheduling scheme is proposed in [9]. The algorithm uses directional antenna to gather geographical information regarding the sensor nodes (in addition to arrival of angle information). This information is used to determine which sensors should be activated (working set sensors). GPS-based sensor networks are characterized by high cost and high energy consumption. High energy consumption may worsen the coverage problem in sensor networks. The work presented in [10] proved that the algorithm that is based on node scheduling has a low efficiency.
K. Kar, and S. Banerjee studied the node placement strategy in order to attain connectivity in sensor networks [11]. The study involved sensing the field of interest with a minimum number of sensor nodes but guaranteeing the connectivity between these nodes. In order to achieve the connectivity, the authors used deterministic node placement, bearing the assumption of disk model for modeling the sensing area.
[12] demonstrates the possibility of improving the sensor network coverage by using multi-hop routing features. The paper also studied the effect of path length on the network performance and thereby network coverage. It optimizes the coverage constraint to the limited path length. On the other hand, our study of coverage mainly focuses on random variation such as the uniform and the Poisson random node deployment on the percentage of the uncovered area.
Besides extending network lifetime via energy control, some researches include several other constraints in order to determine sensor density, for instance, Shakkottai et. al [17] have assumed a binomial probability of death of a sensor in an unreliable environment. They have analytically derived a critical value of sensor density in a unit-sensing disc that will ensure coverage. To the best of our knowledge, this work is the closest to ours. We, however, considered random variations in the sensor network to impact the sensor density.
The work proposed in [19] defines coverage as the ability to find a path through the sensor network nodes. The work addresses two coverage problems namely: the best coverage problem and the worst coverage problem. The best coverage problem employs a localized algorithm that tries to find a specific path that will minimize the maximal distance between all nodes and the closest sensor. On the other hand, worst coverage problem employ localized algorithm that tries to find a path that maximizes the minimal distance between all nodes and the closest sensor.
In our work, we consider the effect of white noise and cumulative effect of other environmental factors, on the sensing range. To the best of our knowledge, none of the previous works have considered the effect of noise and environmental factors on sensor density. The majority of the previous works focus on studying the influence of node deployment on the coverage and connectivity. More specifically, we study the way in which sensor density would respond to stochastic factor in space and time. We also relate the notion of network lifetime to coverage and senor density.
Sensor Coverage
In our study of sensor network coverage, we include the concepts of deployment density, sensing radius, sensor footprint and network lifetime. In this section we briefly describe each of these concepts.
Deployment Density
In our analysis, we assume the deployment density to be the number of sensing elements per unit length of the sensing distance. We quantify our deployment density by parameter A, which is the distance between any two adjacent sensors along the sensing line. The higher the deployment density, the lower will be the value of A and vice versa. In fact, the value of A depends on deployment density via an appropriate random density function.
The density function of deployment can be either deterministic or random in nature. In our study, we consider random placement of sensors along the sensing line. We perform our study with deployment density chosen to be Uniform and Poisson distribution. The deployment density will be represented as uniform U(0,2A) and Poisson P(A) , using the parameter A.
Sensing Radius
Sensing radius corresponds to the distance dependent capacity of a sensor to perform its sensing function. For our study, we assume sensing radius of the sensor to consist of a deterministic constant and a stochastic variable. We further assume that the deterministic constant to be equal to the sensing range specified by the sensor manufacturers. We denote the manufacturer specified sensing radius as S. The sensing radius also have a variable component in their sensing range which may depend at any instant on several external factors such as noise and environmental effects.
External noise on a sensor is a collection of several factors that result in an independent and identically distributed effect on sensing radius. Such an external white noise is assumed to be Gaussian with zero mean and unit variance. The impact of such noise will either increase or decrease the sensing radius. This impact will be independently and individually for each senor in a random point of time. Thus, the effect of noise on sensor i is independent of the effect on sensor j. Likewise, the effect of noise on a sensor at time t1 is independent of its effect at time t2. Thus, the effect of noise will change the radius S, with a variance of S+1 or S-1 along the distribution N(S, 1).
Sensor Footprint
Footprint of a sensor is the relative area covered by a single sensor with respect to the total area covered by a network of sensors. Footprint of a sensor decides the strength of an individual sensor within a network of sensors. Sensor networks with a smaller footprint constitute a densely deployed system. In our study, we assume a small footprint of sensors, this will help to highlight the impact of noise on the coverage.
Network Lifetime
Lifetime of a network is closely related to the functions that the network performs. Typically, the main functions that a sensor network performs are coverage and connectivity. While coverage takes care of sensing function, connectivity relates to several other network related factors such as routing, energy conservation, topology control, medium access etc. In our case, we relate network lifetime to coverage and we assume a strong relation between coverage and connectivity. Thus a network is alive and functioning well, if it attains the required coverage that the application demand. With such a perspective on network lifetime, we quantify the coverage dependent network lifetime in our case, by the percentage of uncovered area along the one-dimensional sensing line.
K-coverage is another level of complexity that we impose on uncovered area and network lifetime. In the case of a K-coverage situation, a certain percentage of the network area needs to attain K-coverage. K-coverage may be a redundancy requirement built into the application.
Experimental Design
Average Percentage Uncovered
Since, the percentage of uncovered area is related to various parameters, we need to develop appropriate metrics and assumptions. We assume a small footprint system with a fixed sensing capacity. The sensing capacity depends on the internal noise limited sensing radius as developed by the sensor manufacturers. In our experiment, we assume a sensing radius of 20 unit and the sensing line to be 1000 units long. As we described earlier, the sensor deployment density is closely related to the sensing radius. For a 20 units sensing radius, 1000 units sensing length, and a deterministic placement, we need a sensor spacing of at least 40 units for full coverage. However, due to stochastic placement, we may not be able to keep the spacing to be exactly 40 units between every pair of sensors. For instance, in case of uniform deployment U (0, 80) the spacing can vary from zero to 80. In order to compensate a spacing of 80 units, and assuming a constant sensing range of 40 units, there is a need to deploy more sensors to cover the entire area.
The number of sensors that needs to be deployed is further aggravated if we consider the effects of environment and noise in addition to random spacing. The instantaneous sensing radius depends on time and space. The time varying environmental effects and noise variation, will cause the uncovered length between sensors to change with time and space. Thus, at any instance in time, we have a certain value of uncovered length between any two adjacent sensors.
We are interested in the expected value of the percentage-uncovered area, considering these three effects.
System Modelling
We will use the distance between any two adjacent sensors to model the uncovered area as a function of random deployment (Uniform and Poisson), sensing radius, noise and environmental effects. We relate the spacing distance A to the sensing range, which is related to a fixed sensing radius S. If the network is composed of N sensors, then for any sensor with fixed sensing radius S, we have a stochastic sensing range Si (t) (i = 1,2,3….N). The variation in sensing range is due to the superposition of normally distributed noise and environmental effects on to the value of S. Thus at any point of time the instantaneous sensing range of the i th sensor is given by (2)
Let Xi be the spacing between sensors i-1 and i. Since we assume Uniform/Poisson distribution for sensor deployment with parameter A, and we have Xi = U(0, 2A) or Xi = Exponential(0,A). In order to cover this sensor spacing completely by the two adjacent sensors,
For 1 sensor coverage:
For 2 sensors coverage:
For K sensors coverage :
Thus the uncovered length between sensors i and i-1 is given by:
The spacing between any two sensors depends on A, and Si (t ) depends on S for fixed value of V (environmental effects constant), hence A and S are dependent and the system can be fully characterized by A. Moreover, we control environmental and noise effects on our system by controlling our deployment parameter A. In our study,we quantify the network lifetime by the mean value of Ui (t) which relates to the system variable A.
The percentage of uncovered length = Expected [ Ui (t) ] / Total length.
Results
In this section we present the experimental results in order to validate the proposed system model in section 3.2. The simulations analyze the impact of several factors on the uncovered area. Energy efficiency, network throughput, and fault tolerance are generally considered to be the main metrics of sensor networks performance. Having dense deployment (i.e. low deployment factor and high K values) is expected to improve these metrics.
Studying the Effect of Random Deployment and White Noise
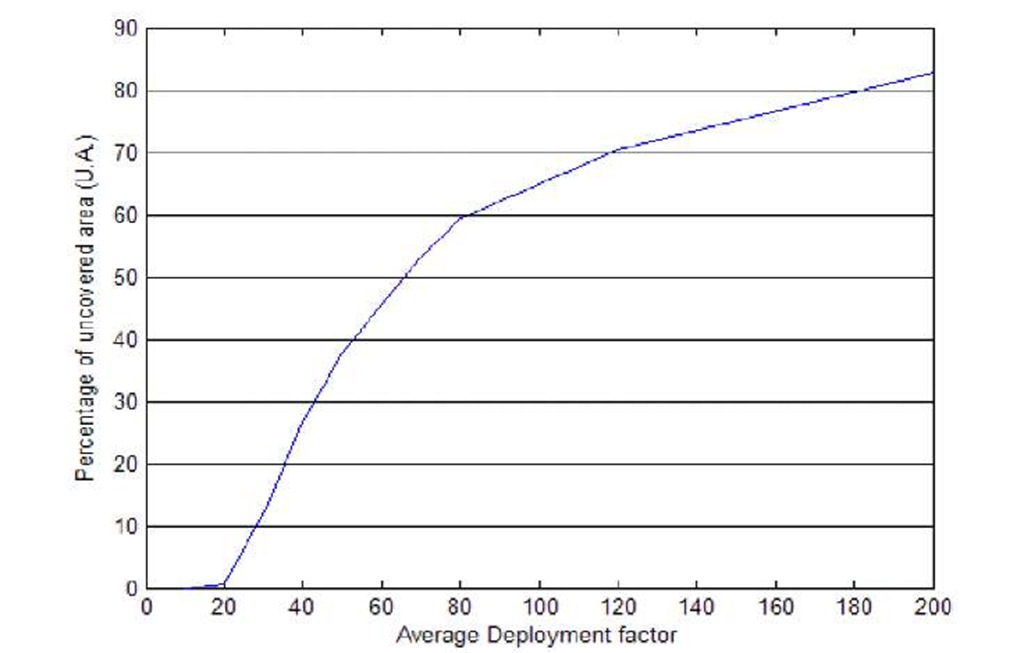
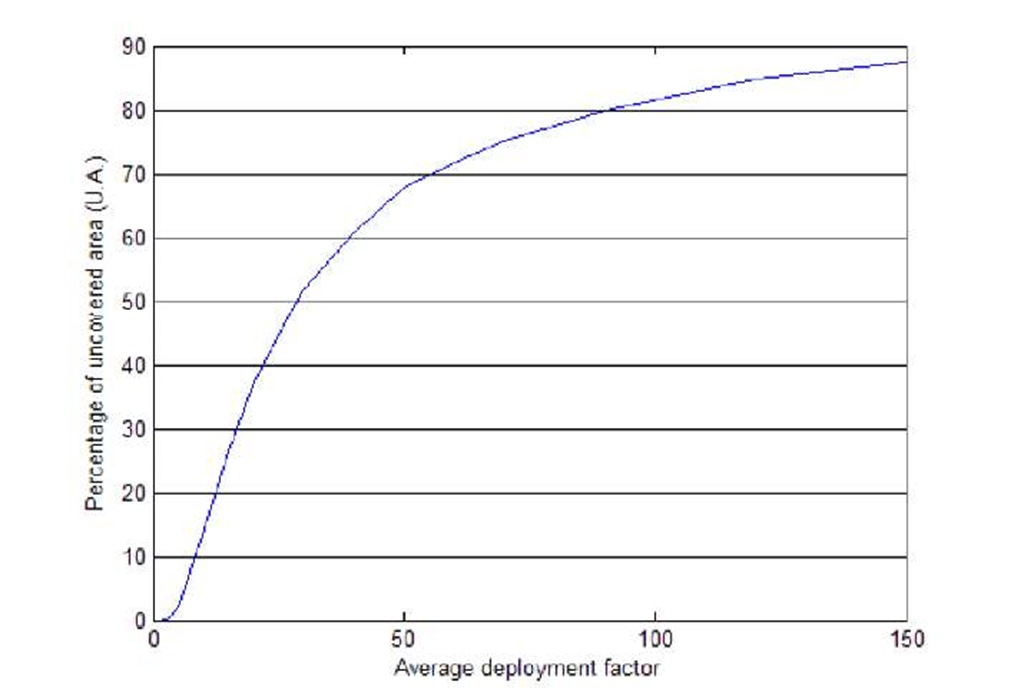
Figure 2 shows the percentage of uncovered area (UA) for various values of deployment factor A using uniform node distribution. The figure shows that the uncovered length increases as the average deployment factor increases. More specifically, as the deployment factor increases, the distance between the adjacent sensor increases and thereby the percentage of uncovered area will also increase. For smaller values of deployment factor, a random reduction in white noise compensates the variations in deployment. The reason of that, is because the noise is represented as N(0,1), where there is a chance for the noise to take negative value. Hence, UA drops rapidly (almost linearly) for low values of A. For higher values of A, a reduction of UA requires a larger decrease in A. For higher values of A, compensating the effect of noise is less powerful compared to the case with lower values of A. The same result is shown in Figure 3 but for Poisson distribution. However, the results show that the percentage of UA increases faster with the increase of the average deployment factor in the case of Poisson distribution.
Fig. 2. Percentage of uncovered length for uniform deployment (K=1, N(0,1))
Fig. 3. Percentage of uncovered length for poisson deployment (K=1, N(0,1))
Studying the Effect of K Coverage
Figure 4 shows the percentage of uncovered area for different values of K. It is clearly shown that for K=2 and K=4 the percentage of UA is much larger than the case with K=1 coverage. The reason is that it is more likely to violate the K coverage criteria for higher values of K. Thus, in order to provide K-coverage redundancy for some applications, we may need much larger deployment rate of the sensors in the network.
Fig. 4. Percentage of uncovered length for different values of K
Studying the Environmental Effects
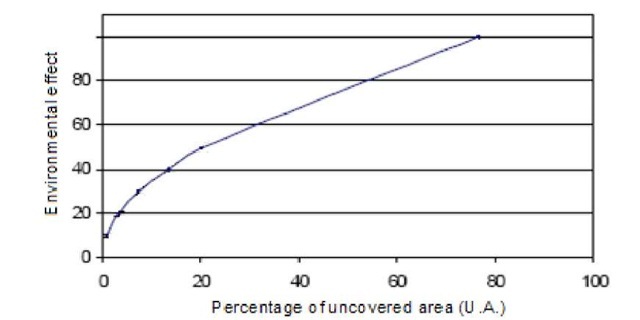
Compared to the impact of noise, the environmental effects will affect all sensors equally. The environmental effect is given by equation (7). Figure 5 shows the relationship between the percentage of UA with respect to the environmental effects. The percentage of UA increases as the environmental effects increase. As discussed in the previous section, noise may have negative excursion from its mean value. However, similar effect is unlikely to exist for environmental effect.
Enviromental effects = V/A (7)
Fig. 5. Environment effect for different values of UA using uniform distribution (A = 40 and K=1)
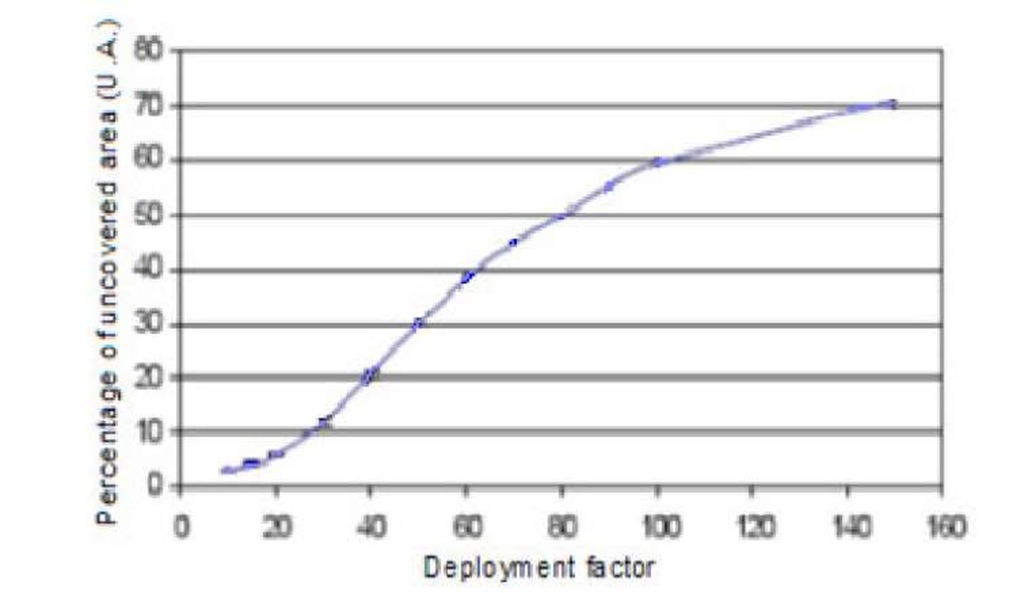
Generally, environmental effects have more significant effect on the stochastic variability compare to the pure noise. This is clearly shown from the high values of V for the environmental effects. Figure 6 shows the effect of V on the percentage of uncovered area with the deployment factor. In this case (with environmental effects), the percentage of UA increases faster with the increase of the deployment factor compared with the previous cases. In Figure 6 we have considered random uniform deployment, white noise, and environmental effects.
Fig. 6. Percentage of uncovered area for different deployment factor using random distribution (V=20, K=1)
Conclusion and Future Work
The results driven from the analytical and experimental analysis on random variations in sensor network coverage, recommends that high degree of over engineering might be required for a system to attain homogenous coverage. The degree of over engineering is particularly crucial for small footprint networks, where the number of sensors per unit length is very high. Large number of sensors is needed to achieve sensor network functionality such as coverage. This may also have significant implications on the design of MAC and routing protocols. Our future work will be to extend the analytical analysis to cover two dimensional area. We also plan to extend our analysis to study non-stationary, time dependent variation on the values of sensing coverage. Moreover, we will consider other deployment distributions such as the Gaussian distribution. Furthermore, we plan to study the impact of coverage on other performance metrics such as the energy efficiency and the packet delivery ratio.


