Simulation Parameters
We have evaluated the 802.15.4 protocol performances in star topology, where nodes transmit data directly to the coordinator. We considered that the wireless channel is without interferences, so this means that each node is able to hear the transmissions of all the other nodes. The CSMA/CA mechanism uses imply that the messages can not be delivered because of collisions or impossibility of reaching an occupied channel.
In this scenario, every 30 ms, the sensors generate messages of 108 bytes. These messages are composed of 75 bytes of data, 2 bytes of control added by the request, the ZigBee heading is equal to 20 bytes, and 9 bytes corresponds to the heading included by the 802.15.4 protocol. The delivery acknowledgement (ACK) sent by the coordinator is composed of 5 bytes. The Sensors start to generate the data at random moment between the beginning of simulation and 30 ms. Each sensor sends 1000 messages to the coordinator. In the table one and table two, we have regrouped respectively the CSMA/CA and the Nic802154_TI_CC2420 parameters used during simulation.
Table 1. CSMA/CA Parameter
|
Parameter |
Value |
|
minBE |
3 |
|
maxBE |
5 |
|
MaxCSMABackoffs |
4 |
|
MaxFrameRetries |
3 |
|
AckWaitDuration |
864 |xs |
|
SIFS |
192 |xs |
|
AUnitBackoffPeriod |
320 |xs |
|
CCADetectionTime |
128 |xs |
Table 2. Nic802154_TI_CC2420 Parameter
|
Parameter |
Value |
|
DelaySetupRx |
1.792 ms |
|
DelaySetupTx |
1.792 ms |
|
delayRxTx / delayTxRx |
192 |xs |
Several parameters can be defined to evaluate the wireless network performances. These measurements were carefully selected to give an idea of the ZigBee networks behaviour and reliability. The considered parameters are as follows:
- Throughputs is the data quantity transmitted correctly starting from the source to the destination within a time U (sec). The node rate is measured by counting the total number of data packets received successfully on the node, which leads to the calculation of the received bits number which is divided by the total time of simulation execution. The network rate is defined as the average of all nodes rates implied in the data transmission.
- End-to-End-delay is equal to the time taken by a data packet to reach the destination node. Simulations are carried out with a star network topology, and the routing mechanism was desactivated. Consequently, the term End-to-End Delay can be exchanged with delay. The packet delay is the time put by the packet to reach the destination.
- Goodput is calculated as the rate between packets received correctly and the total transmitted packets. The lost packets number does not take into account the retransmissions. So the Goodput is evaluated by the following relation:
- Latency time is equal to the arrived message time minus the message creation time.
- Service time is the message life time from its creation by the transmitter until the positive ACK reception.
Scenarios
Scenario1
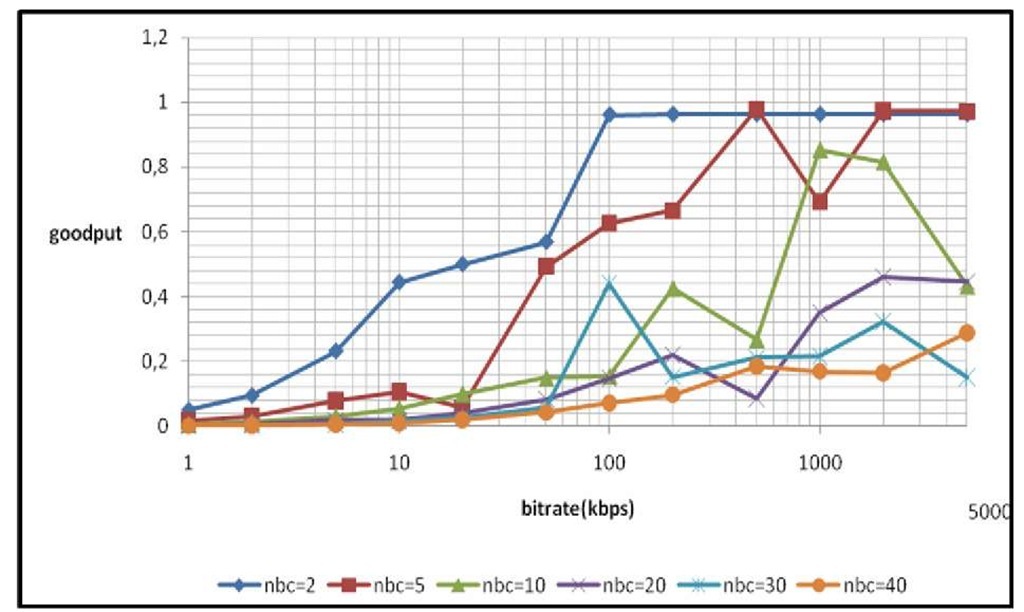
In this scenario (star topology one coordinator and n nodes), in first step, we have fixed the sensors number, then for different rates we have computed the goodput and the latency. In the second step, we change the number of sensors and we repeat the same process. Fig.6 illustrates simulations results corresponding to this scenario.
Fig. 6. Goodput according to the rate for various numbers of sensors
For the curve (nbc=2) we notice that the goodput reached a threshold. The rate increases doesn’t have any advantages. For the curves (nbc=5 and nbc=10) we perceive that the goodput converge to the ideal value when the rate increases. For the curves (nbc=20, nbc=30 and nbc=40), the goodput has a low value even though the rate increases. According to the network size, If the number of sensor is high, it is necessary to have a high rate to ensure a correct network operation.
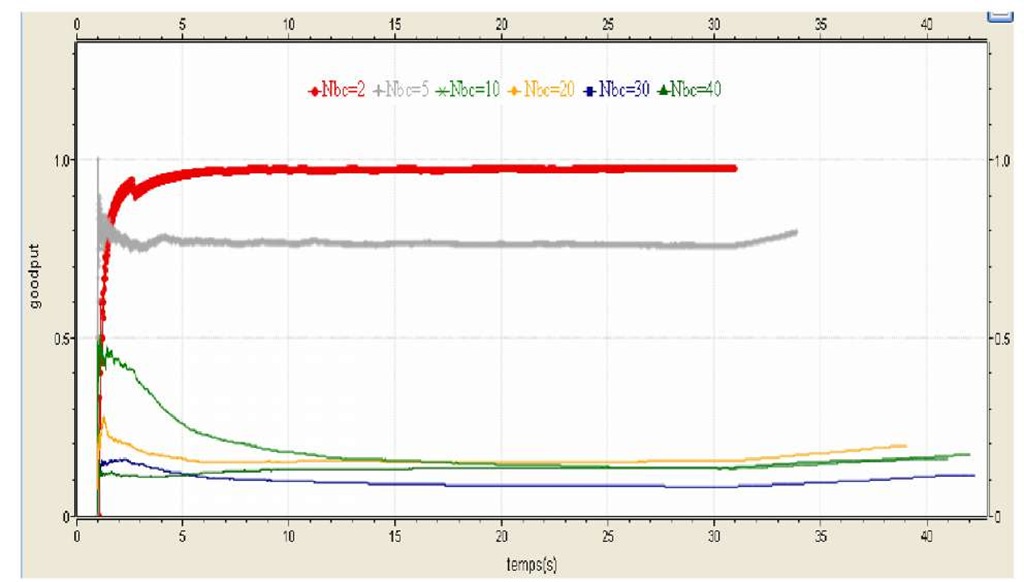
For the curves illustrated by Fig.7 which represent the goodput according to the simulation time we have fixed the rate equal to 250 Kbps.
Fig. 7. Goodput according to the simulation time
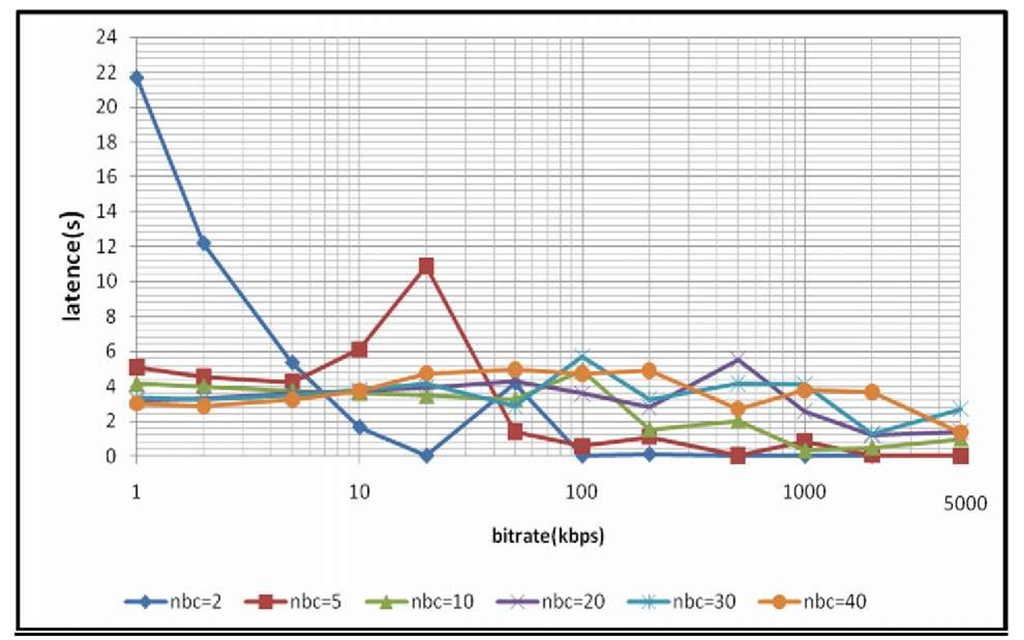
The latency time variation according to the rate for various numbers of sensors is illustrated by Fig.8.
Fig. 8. Latency according to the rate for various numbers of sensors
For the curve (nbc=2, rate 100 Kbps) the latency time is limited by 15ms. For the curves (nbc=5 and nbc=10) the latency time varies according to the rate. For the curves (nbc=20, nbc=30 and nbc=40) the rate does not have a great effect on the latency time. When the number of sensor is increasing the rate doesn’t guaranteed the latency time decreases because of the collisions and the messages losses.
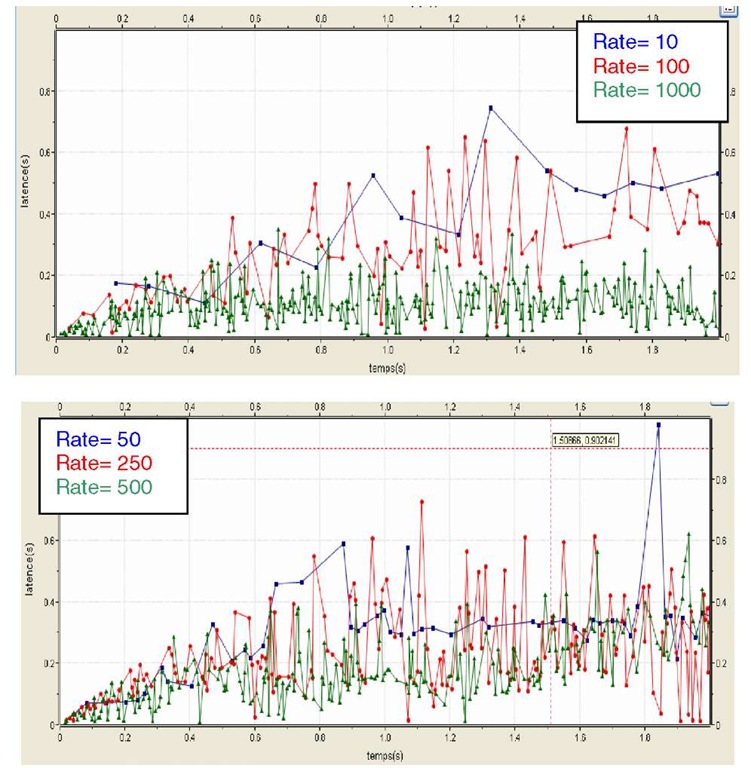
In Fig.9 we illustrates the latency time variation according to simulation time for various rate values (sensors number= 10, packet number = 100).
Fig. 9. Latency time according to the simulation time
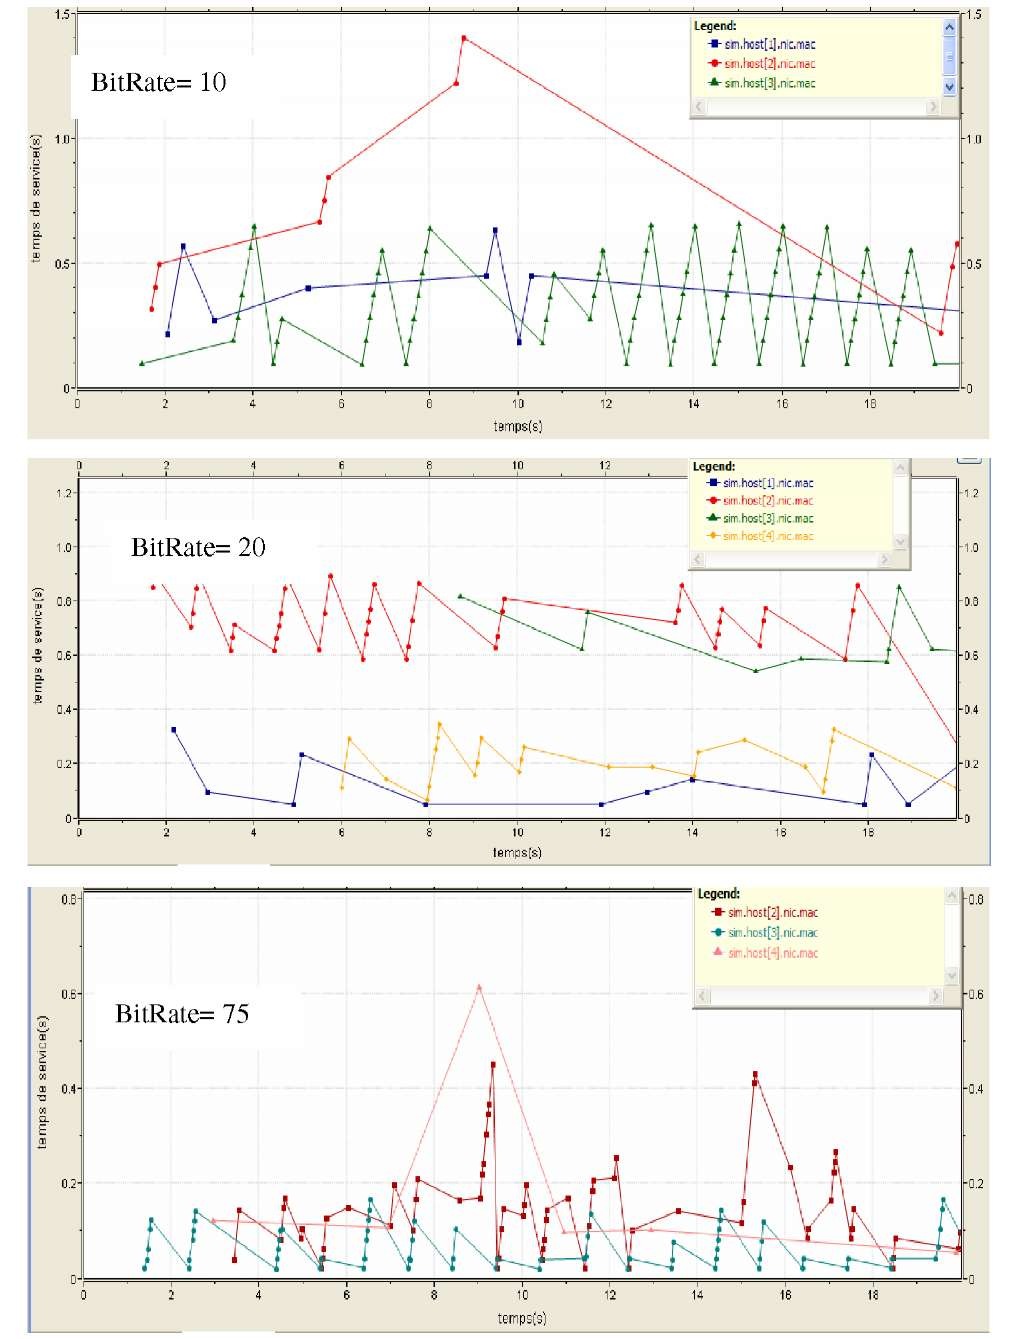
In order to evaluate the service time variation according to different rate as shown in Fig.10, we have considered that every one second the sensors generate messages; each sensor sends 100 messages to the coordinator. We have fixed the number of sensor equal to five.
Fig. 10. Service time according to the simulation time
Scenario 2: Payload Size Analysis
In this scenario, we have analyzed the IEEE 802.15.4/ZigBee performances using a star topology for different payload sizes and ten sensors. We seek to determine the
Fig. 10. Service time according to the simulation time 4.3.2 Scenario 2: Payload Size Analysis
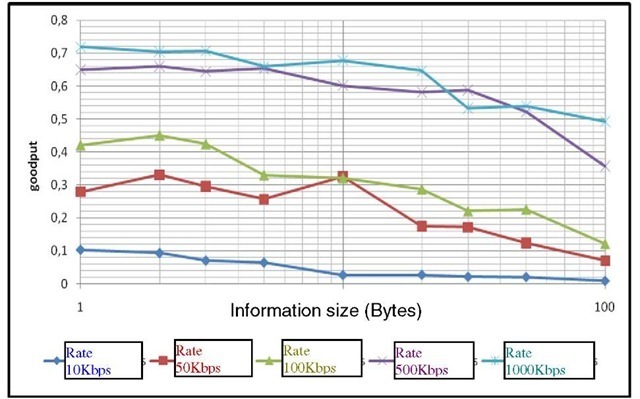
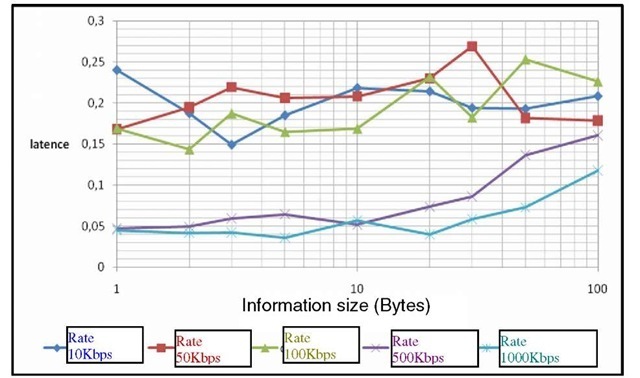
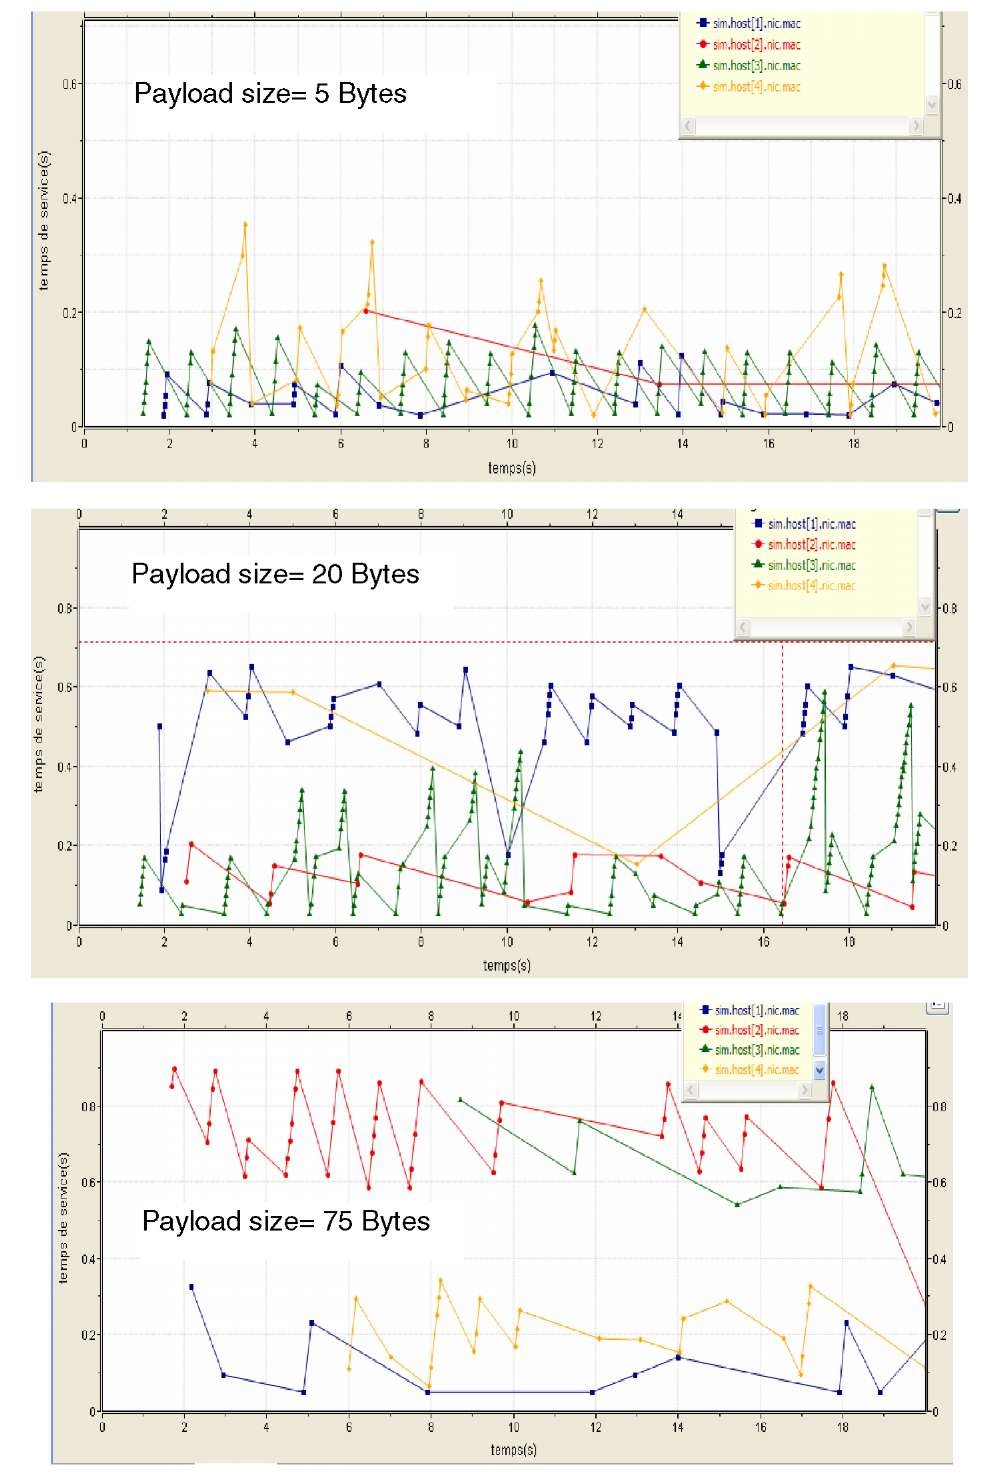
In this scenario, we have analyzed the IEEE 802.15.4/ZigBee performances using a star topology for different payload sizes and ten sensors. We seek to determine the performances according to the rate in order to estimate the suitable payload size for a given rate. We have used the network parameters of the preceding scenario. Simulations results, illustrated respectively by figure 11, 12 and 13.
According to the obtained results, there isn’t correlation between the latency and the useful information size in the real times applications case (when the information size doesn’t exceed 100 bytes).
Fig. 11. Goodput variation according to payload information size
Fig. 12. Latency variation according to payload size
Fig. 13. Service time variation according to payload size
In order to evaluate the service time variation according to different rate as shown in Fig.13, we have considered that every one second the sensors generate messages with 20Kbps. We have fixed the sensor number at 5.
Conclusion
In this paper, we have presented and discussed a number of performance measures of the IEEE 802.15.4 protocol. In essence, we obtained these results in a simulative performance study using IEEE 802.15.4 simulation model, which is implemented under OMNeT++. We have analyzed two different scenarios for the CSMA/CA operation mode using a star topology. In the first scenario, we treated the scalability problem by evaluating the metric performance (goodput, latency) for different network sizes (different sensors number). In addition, in the second scenario, we analyzed payload sizes effect on the IEEE 802.15.4/ZigBee performances. In future work, we will continue to study the applicability of IEEE 802.15.4 in low-latency and energy-aware applications especially in real network and for healthcare use.
