A practical example
Until now we have discussed many aspects of JVM tuning. All the concepts that you have learnt so far need a concrete example to be truly understood.
We will introduce here a complete JVM analysis use case, which can be used as pathfinder for your tuning sessions. In the first part of the example we will choose the correct amount of memory that needs to be allocated, then, we will try to improve the throughput of the application by setting the appropriate JVM options.
It is clearly intended that the optimal configuration differs from application to application so there is no magic formula which can be used in all scenarios. You should learn how to analyze your variables correctly and clearly find the best configuration.
Application description
You have been recruited by Acme Ltd to solve some performance issues with their web application. The chief analyst reported to you that, even if the code has been tested thoroughly, it’s suspected that the application has got some memory leaks.
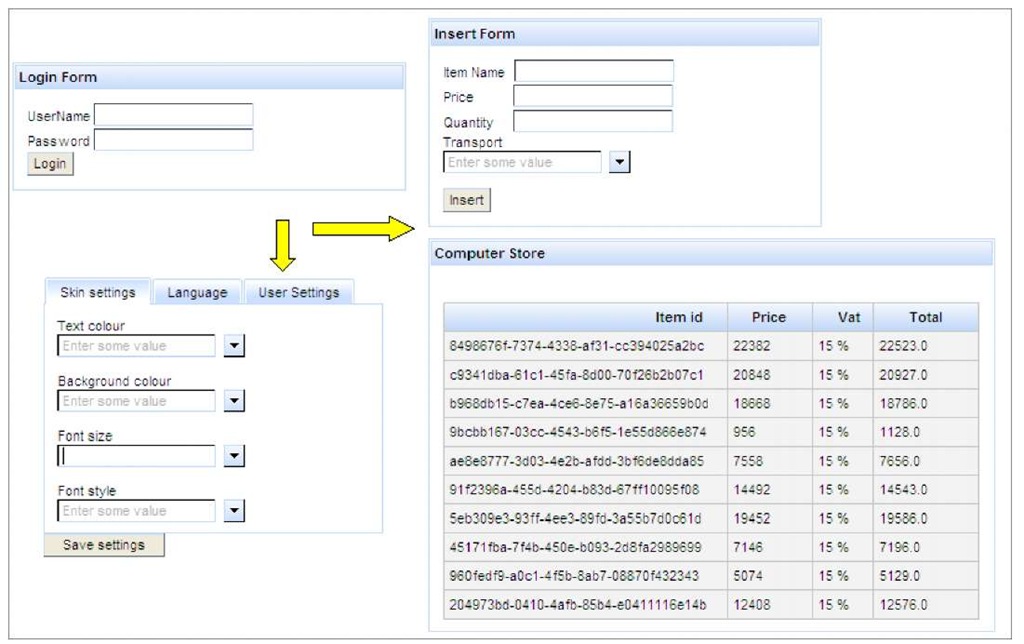
The Acme Web Computer Store is a quintessential web application, which is used to keep an on-line store of computer hardware items. The application lets the user log in, query the store, insert/modify orders, and customize the user’s look and feel and preferences.
The application requires a Java EE 5 API and it is made up of a front-end layer developed with JSF Rich Faces technology and backed by Session Beans, and Entities.
Most of the data used by the application is driven through the Servlet Request, except for user settings, which are stored in the user’s HttpSession.
The application is deployed on a JBoss AS 5.1.0, which is hosted on the following hardware/software configuration:
• 4 CPU Xeon dual core
• Operating System: Linux Fedora 12 (64 bit)
• JVM 1.6 update 20
Setting up a test bed
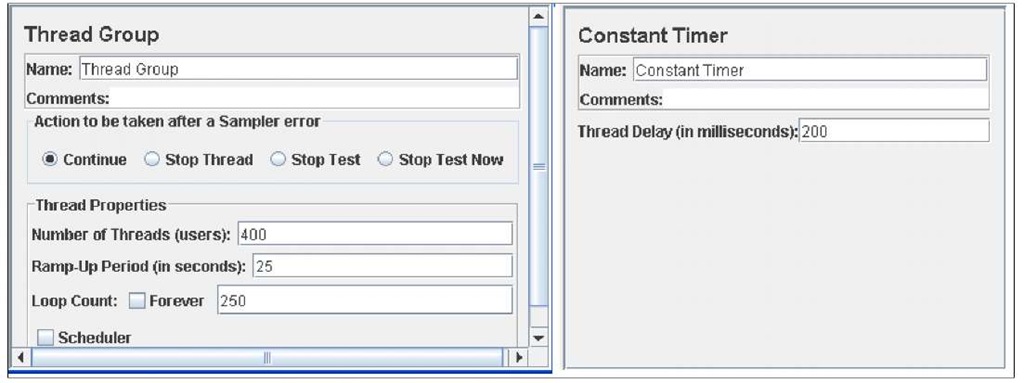
The application has an average of 400 concurrent users navigating once through every page of the Web application (which are four in total). Since we require to keep running this benchmark for about 30 minutes, we have calculated that the test need to be repeated for about 250 times. We have allowed a 200ms time interval to make the test more realistic.
In total, that’s 1000 pages for each user and a total of 400,000 total pages requested. Here’s our Thread configuration on JMeter:
The amount of loops which need to be performed in a test bed
It depends mostly on the response time of the application and the hardware we are using. You should experiment with a small repeat loop and then multiply the loop to reach the desired benchmark length. In our case we tested that with 400 users and 50 repeats, the benchmark lasted around 6 minutes, so we have increased the repeats to 250 to reach a 30 minute benchmark.
Once we are done with the JMeter configuration, we are ready to begin the test.
As first benchmark, it’s always best to start with the default JVM settings and see how the application performs. We will just include a minimal JVM heap configuration, just to allow the completion of the test:
set JAVA_OPTS=%JAVA_OPTS% -Xmx1024m -Xms1024m
Benchmark aftermath
Here’s a screenshot of the JVM heap taken from the VisualVM monitor:
There are two elements, which draw your attention immediately:
Consideration #1
At first, you disagree that the application has got a memory leak. The heap memory grows up at regular interval with high crests. However, after each garbage collection, the memory dips to the same baseline, around 300 MB. Also the peak memory stays around 800 MB.
However, the fact that the application’s heap grows steadily and can recover memory just at fixed intervals is a symptom that, for some time, lots of objects are instantiated. Then, a bit later, these objects are reclaimed and memory is recovered. This issue is well shown by the typical mountains top’s heap trend.
What is likely to happen is that the application uses the HttpSession to store data. As new users kick in, the HttpSession reclaims memory. When the sessions expire, lots of data is eligible for garbage collector.
Consideration #2
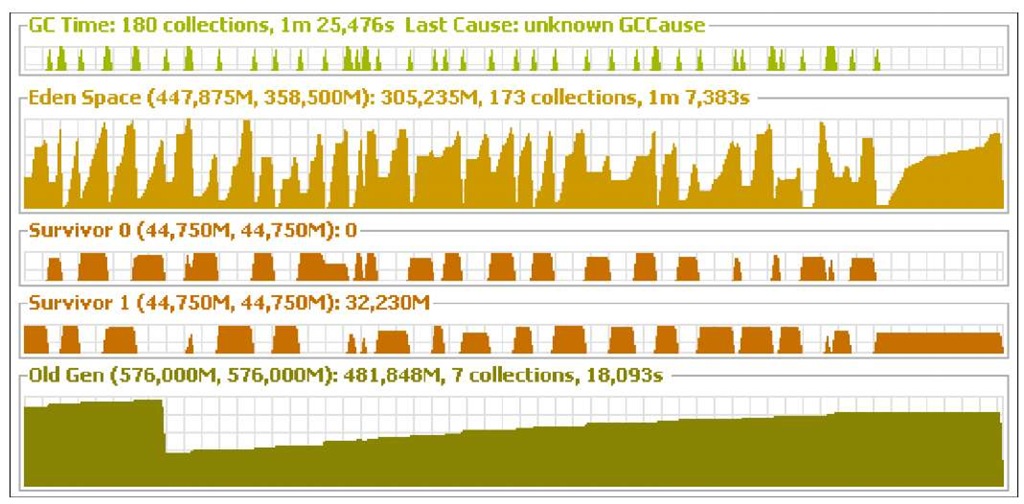
Second, the impact of major collections is too high—the JVM spent an average of 1.7 seconds for each major collection because of the amount of objects that needed to be reclaimed. The total time spent by the application in the garbage collection is about 1 min. 46 sec. (of which 1′ spent in minor collections and 46” in major collections).
The following screenshot is taken from the VisualGC tab:
Action
The first fix we need to add will be increasing the size of the young generation. As it’s evident from the graph, lots of objects are created. Both short-lived and medium-lived. If we let all these objects flow in the tenured generation, it will be necessary for a frequent evacuation of the whole JVM heap.
Let’s try to change the JBoss AS’s default JVM settings, increasing the amount of young generation to 448 MB:
As we have stated in the first topic, it’s important to introduce a single change in every benchmark, otherwise we will not be able to understand which parameter caused the actual change.
So let’s run again the benchmark with the updated heap configuration. This is the new graph from the monitor tab:
It’s easy to guess that things got a lot better: the new heap’s trend looks rather like a sore tooth now, which is a symptom that the memory is regularly cleared in the early stages of the objects’ lives. The VisualGC panel confirms this visual estimate:
The total amount of time spent in garbage collection dropped down for over 20 seconds, especially because the number of major collections was drastically reduced.
The time spent for each major collection stays a bit too high and we ascribe this to the fact that the application uses about 10KB of Objects in the HttpSession. Half of this amount is spent to customize each page Skin, adding an HTML header section containing the user’s properties.
At this stage, the staff of Acme Ltd does not allow major changes in the architecture of the web application, however by removing the block of text stored in the HttpSession and substituting with a dynamically included HTML skin, the amount of data stored in the HttpSession would drop down significantly, as shown by the following graph, which shows how an ideal application heap should look like.
Further optimization
The Acme Ltd representative is quite satisfied with the throughput of the application; nevertheless, we are asked to pursue an additional effort in reducing the occasional long pauses, which happen when major collections kick in. Our customer would like to keep a maximum response time of no more than 2.5 seconds for delivering each response; with the current configuration, there’s a very little amount of requests, which cannot fulfill this requirement.
The following picture, taken from JMeter’s aggregate report, shows that a group of HTTP Request pages report a maximum response over the 2.5 limit.
Since we are running the application on a server class machine, the default algorithm chosen by the JVM for garbage collection is the parallel collector, which is particularly fit for applications requiring a high throughput for example, a financial application or a data warehouse application performing batch processing tasks.
We would need, however, an algorithm, which can guarantee that GC pauses will not take that long, at the price of an overall little performance degradation. The concurrent collector is particularly fit for application like ours, where latency takes precedence over throughput. In order to enable the concurrent collector we use the flag -xx:+UseConcMarkSweepGC, so this is our new set of Java options:
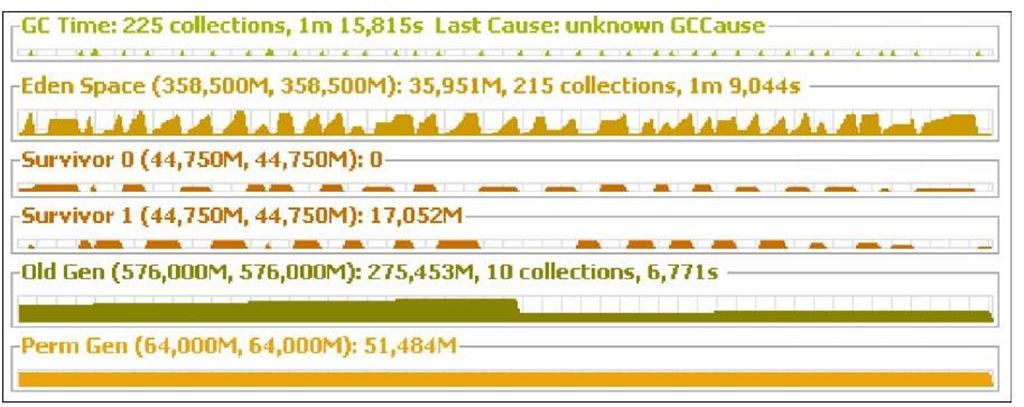
Following here, is the VisualGC tab resulting after benchmarking the application with the concurrent collector:
As you can see, the time spent in garbage collection has been further reduced to 1’15” seconds This is generally because the Old Generation collection dipped just to 6.7”, even if the number of collection events increased. That’s because the garbage collection pauses with the concurrent collector are short and frequent.
The aggregate report from JMeter shows that the application throughput has slightly dropped, while remaining still acceptable, but no single request was server over 2.1 seconds:
While there are still margins for improving the application, for example by analyzing what’s happening on the persistence layer, at the moment we have applied all the fixes necessary to tune the JVM. If you check the Oracle/Sun JVM docs there are a pretty good number of other parameters which you can apply to tune the heap (http://java.sun.com/javase/technologies/hotspot/vmoptions.jsp), however we suggest you not to specialize too much your JVM configuration, because the benefits you could gain, might be invalidated in the next JDK release.
Summary
JVM tuning is an ever-evolving process that has changed with each version of Java. Since the release 5.0 of the J2SE, the JVM is able to provide some default configuration (Ergonomics), which is consistent with your environment. However, the smarter choice provided by Ergonomics is not always the optimal and without an explicit user setting, the performance can fall below your expectations.
Basically, the JVM tuning process can be divided into three steps:
• Choose a correct JVM heap size. This can be divided into setting an appropriate initial heap size (-Xms) and a maximum heap size (-Xmx).
° Choose an initial heap size equal to maximum heap size for production environment. For development environment set up the initial heap size to about half the maximum size.
° Don’t exceed the 2GB limit for a single application server instance or the garbage collector performance might become a bottleneck.
• Choose a correct ratio between young generations (where objects are initially placed after instantiation) and the tenured generation (where old lived generations are moved).
° For most applications, the correct ratio between the young generation and the tenured generation ranges between 1/3 and close to
° Keep this suggested configuration as reference for smaller environments and larger ones:
• Choose a Garbage collector algorithm which is consistent with your Service Level requirements.
• The serial collector (-xx:+useSerialGc) performs garbage collector using a single thread which stops other JVM threads. This collector is fit for smaller applications, we don’t advise using it for Enterprise applications
• The parallel collector (-xx:+useParallelGc) performs minor collections in parallel and since J2SE 5.0 can perform major collections in parallel as well (-xx:+UseParalleloidGc). This collector is fit for multi-processor machines and applications requiring high throughput. It is also a suggested choices for applications which produce a fragmented Java heap, allocating large sized objects at different timelines
• The concurrent collector (-xx:+UseConcMarkSweepGC) performs most of its work concurrently using a single garbage collector thread that runs simultaneously with the application threads. It is fit for fast processor machines and applications with strict a service level agreement. It can be the best choice also for applications using a large set of long lived objects live HttpSessions.
In the next topic we begin our exploration of the JBoss application server, starting at first with the basic configuration provided in the 4.X and 5.X releases, which is common to all applications. Then during the next topics, we will explore the specific modules, which allow you to run Java EE applications.


![tmp39-95_thumb[2][2][2] tmp39-95_thumb[2][2][2]](http://what-when-how.com/wp-content/uploads/2011/09/tmp3995_thumb222_thumb.jpg)


![tmp39-100_thumb[2][2][2] tmp39-100_thumb[2][2][2]](http://what-when-how.com/wp-content/uploads/2011/09/tmp39100_thumb222_thumb.jpg)


![tmp39-103_thumb[2][2][2] tmp39-103_thumb[2][2][2]](http://what-when-how.com/wp-content/uploads/2011/09/tmp39103_thumb222_thumb.png)
