Digging in to a VoIP call is fun, but first you have to find the call. Not every capture you execute will be so clean as to start with the first INVITE message and finish with a BYE. The majority of captures you’ll be looking at probably include ancillary TCP/IP information and other packets flowing through the LAN that may or may not have an impact on the VoIP call you’re investigating.
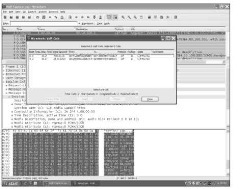
Wireshark provides an easy way to isolate the individual VoIP calls in a capture, filtering out the unrelated packets. Click Statistics in the top menu bar and select VoIP Calls. Wireshark scans the entire packet capture, identifying all VoIP calls and populating them in a Wireshark: VoIP Calls pop-up window, shown in Figure 11-3.

Figure 11-3:
Viewing VoIP calls.
The window summarizes the calls by their general profile, allowing you to quickly see
‘ Start Time: This isn’t the time of day the call began, such as 8:49 p.m. or 20:49 in military time, but the amount of time between the moment the capture being analyzed began until the call was initiated.
Stop Time: The amount of time between the initiation of the packet capture and the final BYE message ended the call. This is not the duration of the call from INVITE to BYE, but the time in the capture when the BYE for the call was received.
Initial Speaker: The IP address that originates the call. The first call in Figure 11-3 originated from the IP of 4.00.00.00.
From: The origination SIP URI on the call. To: The destination SIP URI on the call.
‘ Protocol: Because you’re looking at a VoIP call, it’s listed as SIP. Despite the fact that only SIP is listed in the protocol, the call listed includes SIP/SDP and RTP packets.
‘ Packets: Provides the total quantity of SIP packets listed for the specific VoIP call. Other RTP packets may be associated with the call, but only the quantity of SIP packets are listed.
State: Identifies the disposition of the call. The options include
• Completed: Indicates a VoIP call that was established and was disconnected with a normal BYE.
• Rejected: This call was refused by the receiving SIP node, most likely with a 404 Not Found or 503 Service Unavailable.
• Cancelled: Identifies a call forcibly disconnected with the SIP
method CANCEL.
• Call Setup: The call listed in the capture was never established and includes only the initial INVITE message and provisional responses, such as 180 Ringing.
Graphing a call
The bottom of Wireshark’s VoIP Calls window has four buttons that remain grayed out until you select a VoIP call to analyze.
The first button to select when analyzing a VoIP call is the Graph button. This option allows you to see a call tree for the specific VoIP call selected.
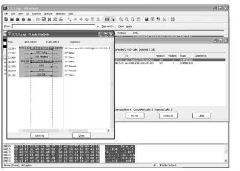
Figure 11-4 shows the call tree for a completed call, originating at IP 4.00.00.00 and terminating to IP 24.00.100.0 listed on the top of the graph. The dotted lines extending below these IP addresses function as a reference point for the IP as either the originator or recipient of each packet. The example is a very simple voice call running through the normal
INVITE/200OK/ACK call setup.
The graph provides you more information about the call setup. Figure 11-4 shows that three codecs were offered in the initial INVITE — both versions of G.711 as well as G.729. The (5060) to the outside of each dotted line represents the SIP port used for signaling on the call. The 200 OK also provides more information, listing that the call was established as G.711u before the ACK was returned and the audio portion of the call proceeded. About 12 seconds later, the call concluded when the destination IP sent the BYE,
responded to by the 200 OK.

Figure 11-4:
A graph analysis.
The example in Figure 11-4 is a simplified version of a normal VoIP call. The very nature of VoIP encourages the design of more complex networks. This frequently translates into the deployment of SIP proxies and intermediary SIP devices to facilitate connectivity. A single incoming VoIP call may then include two legs:
Inbound from your VoIP carrier to your SIP proxy Outbound from your SIP proxy to the destination VoIP phone
In this example, both legs of the call are populated in the VoIP Calls pop-up window, but since they represent SIP messages cascading in from one leg of the call and out the other, it isn’t helpful to look at each graph separately. You need to view both pieces as an integrated whole so you can instantly see how each call responded to SIP methods and responses that originated from the other leg of the call. Wireshark allows you to do this just as easily as viewing a single call graph.
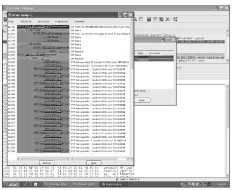
Select both calls in the VoIP Calls window by clicking them individually or Alt-clicking the other call. After you highlight both calls, click the Graph button. The calls are now displayed together as one large graph with a different background color identifying each call.
Figure 11-5 identifies a call originating from IP 4.00.00.00 and passing through the SIP Proxy of 24.00.100.0 with a final destination at the VoIP carrier’s IP of 74.100.00.00. This option clearly shows how the SIP messages bounce between the nodes.
This option allows you to view the SIP banter while it cascades across the SIP nodes from end to end on the call. This view makes it possible to find inconsistencies or portions of a VoIP call where a SIP method failed to receive a response. It’s also a good place to identify when a SIP node continues to send SIP methods or responses, even after that node has received a legitimate reply from the far end.

Figure 11-5:
Multi-call I graph, j
Filtering down to one call
The call tree allows you to take a quick snapshot of the SIP messaging on the call before deciding to investigate it further. If you need to dig deeper into the individual packets of the SIP or SDP messaging, simply close the graph analysis with the close button at the bottom of the window and, with the individual call still highlighted in the VoIP Calls pop-up window, click the Prepare Filter button. A filter designed specifically for the selected call appears in the Filter toolbar of Wireshark.
Close the VoIP Calls window and then click the Apply button to the far-right of the Filter toolbar. The Summary window of Wireshark now includes only packets associated with that call. You can use this method to quickly and efficiently eliminate packets associated with other VoIP calls or auxiliary LAN traffic.
Now that Wireshark has filtered out all packets not belonging to the one call you’re investigating, expand the sections of the packet in Wireshark’s Protocol Tree window to display the Call Header, Message Body, or SDP sections, as you require. If you’re attempting to follow the RTP port used for either the outbound or inbound stream, drill down into the SDP sections of the packet so that you can see the port number in the first line of the Media Description. After you expand the view in the Protocol Tree window, it displays all packets that you select in the Summary window expanded down to identify the first line of the Media Description if the highlighted packet has and SDP element to it. So, you can quickly scroll down packets in the Summary window, confirming that the details of the SIP methods and responses translated accurately from end to end.
Listening to a capture
A Wireshark capture doesn’t only grab the SIP overhead messaging, it also captures the audio of the call in the RTP packets. You can listen to the audio of the call by using the Player button on the VoIP Calls window, located by the Graph and Prepare Filter buttons.
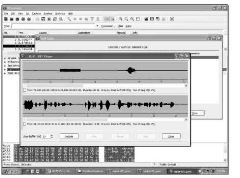
When you click the Player button, the VoIP RTP Player pop-up window appears, providing you the option to change the jitter buffer on the player before you click the Decode button. A new window now appears with both media streams displayed.
Figure 11-6 shows the RTP Player window in Wireshark with each stream identified below it. The RTP stream on the top of the window originates at IP 72.000.100.00 and is 20.66 seconds long. The small check box to the left of the identifying information provides you with the option to select one or both RTP streams to play at the same time. This option allows you to hear the exact conversation as it was experienced by the device from which the packet capture was executed. If the line experienced static, echo, or clipping because of packet loss, you can hear the degradation in sound quality for yourself.
Wireshark can play the audio on packet captures for only audio calls. If you’re listening for handshaking or connection tones on a fax or a failed call, you don’t get an RTP stream to listen to.
If you select a completed voice call to play and only one RTP stream is listed, that means you had one-way audio. Identify which RTP stream you have, either the outbound or the inbound. If only the outbound RTP stream was captured,


you may have an issue with your firewall or Network Address Translation (NAT) blocking the incoming RTP. (NAT is covered in detail in topic 17.) If you have only the incoming RTP, check the Dial Plan for your VoIP phone system. Having only the incoming RTP indicates that something isn’t mapping correctly between the phone on your LAN that originates the call and the part of your software that packetizes the audio for transmission in your SIP server.

Figure 11-6:
The RTP player.
