Uncertainty Associated with the Use of MIR Reflectance
As with the use of the NOAA AVHRR NDVI there are several uncertainties with using NOAA AVHRR MIR reflectance. In particular, there are uncertainties associated with the method of deriving MIR reflectance (Nerry et al., 1998; Roger and Vermote, 1998) from the total radiant energy measured in AVHRR channel 3, specifically, with the emissivity information that is required to determine the emitted portion of that signal. The term ch3 is introduced to equations (3) and (4) since any radiation emitted from a target, at a particular wavelength, is a combination of its spectral emissivity and brightness temperature, which can be expressed (without atmospheric effects) as
where![]() is the measured spectral emitted radiance at a particular wavelength
is the measured spectral emitted radiance at a particular wavelength ![]() is the spectral emissivity at a particular wavelength and
is the spectral emissivity at a particular wavelength and![]() is the brightness temperature at a particular wavelength (K) (Price, 1989).
is the brightness temperature at a particular wavelength (K) (Price, 1989).
The emissivity of a target is a dimensionless number that is the ratio of the actual radiant emittance from a target and that from a blackbody at the same temperature (Norman et al., 1995). Most natural targets are not blackbody emitters, but rather are greybody emitters (i.e. e < 1.0), thus only emit a portion of the energy they receive. It is the characteristics of the target itself that principally determine this portion (for example, surface roughness, architecture, LAI and water content) (Becker et al., 1986; Elvidge, 1988; Norman et al., 1990; Schmugge et al., 2002) and so the Earth’s surface has a highly variable emissivity, both temporally and spatially (Cracknell and Xue, 1996). If MIR reflectance is to be derived accurately from the total radiant energy measured in AVHRR channel 3, knowledge of the emissivity of the forest canopy over space and time is required. To acquire the emissivity value of a target remains a difficult task, particularly within MIR wavelengths (Givri, 1995). Furthermore, emissivity values in the MIR spectral region of vegetation have been found to range between 0.7 and 1.0 (Sutherland, 1986; Salisbury and D’Aria, 1994; Goita and Royer, 1997). This therefore, introduces a known uncertainty parameter to our proposal to use MIR reflectance to monitor ENSO-related drought stress of the rainforests of the DVCA.
One approach to overcoming uncertain emissivity is to assume an emissivity value and use this when deriving MIR reflectance over space and time or to ignore its influence (e.g. use e = 1.0). However, if the actual emissivity deviates from this constant value then the predicted MIR reflectance will be in error and ultimately any information on the ENSO impact of the forests of DVCA may be compromised. The problem of uncertainty in the magnitude of the emissivity has been evident in other studies (Becker, 1987; Coll et al., 1994, Franca and Cracknell, 1994) and has been demonstrated to present more significant problems in using remotely sensed data than those induced by atmospheric effects (Wan and Dozier, 1989). It was important, therefore, to ascertain whether uncertainty in the magnitude of the emissivity in the derivation of MIR reflectance from the total radiant energy measured in AVHRR channel 3 over the DVCA compromised the use of MIR reflectance for the monitoring of ENSO-related drought stress.
Data and Image Pre-processing
The remotely sensed data used in this study were selected from a series of 41 NOAA-14 AVHRR images acquired during the period between November 1996 and December 1998, covering the 1997-98 ENSO event. Application of a cloud mask algorithm (Franca and Cracknell, 1995) reduced the number of useable images to 15. Data extracted from these images were compared to daily rainfall totals measured at the field site.
Data acquired in all five AVHRR channels were converted to radiances (Kidwell, 1991). Conversion of data in channels 1 and 2 took into account the orbit degradation effects associated with using pre-launch calibration coefficients (Rao et al., 1996). The remotely sense dradiances in visible,NIR and MIR wavelengthswerethen processed to derive the desired variables for subsequent analyses. Here the ratio of exiting to incident surface radiance for each AVHRR pixel in the visible, NIR and MIR channels was obtained. The incident radiance was determined by applying an atmospheric correction model, based on work by Iqbal (1983), to the solar radiance within the limits of AVHRR channel 1 (visible), channel 2 (NIR) and channel 3 (MIR). The atmospheric variables accounted for included molecular and aerosol attenuation and absorption by ozone, water vapour (calculated from radiation in channels 4 and 5 following the Dalu (1986) procedure) and the remainder of the atmospheric gases, which were treated together as a well-mixed gas. The exiting radiance was determined by inversely applying the atmospheric model to the satellite sensor radiance measured at the top of the atmosphere. Running the atmospheric correction model required inputs describing the solar and satellite geometrics, predictions of aerosols and ozone amounts, aerosol optical properties and sensor characteristics.
The resultant atmospherically corrected signals from this image processing procedure constituted surface reflectance in visible and NIR wavelengths and a full MIR radiation signal (mW m2 sr cm-(i.e. inclusive of reflected and emitted components). The reflectances in visible and NIR wavelengths were combined in the NDVI.
To obtain MIR reflectance the model described in equations (2-4) was applied. In this case, the land surface temperature was determined using a split window algorithm described by Price (1989). By applying Planck’s function to the surface temperature over the bandwidth of AVHRR channel 3 and the relevant channel response coefficients supplied by Planet (1988), the blackbody radiance was obtained. Emissivity was then applied to the blackbody radiance to derive the emitted surface radiance. The emitted surface radiance value was subtracted from the total exiting radiance to leave the purely reflected component at MIR wavelengths, which is used in conjunction with the incident solar radiance to determine the bi-directional reflectance value for the MIR channel (i.e. MIR reflectance).
Exploring Uncertainty in Emissivity
Pre-processing of the 15 images was undertaken twice using different estimates of the emissivity parameter to establish the impact of uncertainty on the derivation of MIR reflectance. One pre-processing run used the emissivity value of 1.0. The other preprocessing run used emissivity values calculated from an image-based approach. The selection of the image-based approach was based on a comparative study undertaken by Sobrino et al. (2001) of four of the most recently proposed algorithms for the independent calculation of emissivity from data acquired by the NOAA AVHRR sensor. For the purposes of this study, each of these algorithms was evaluated against a specified set of requirements (Table 8.1). These requirements are that the method adopted should be adapted easily to an operational situation, require minimal ancillary data and that emissivity values are produced on a pixel-by-pixel basis. From this, it was concluded that the TS-RAM model method (Goita and Royer, 1997) was the only approach that could be used in this case study.
Table 8.1 Evaluation of the four algorithms for the independent calculation of emissivity in MIR wavelengths from NOAA AVHRR imagery
|
Method |
Approach |
Comment |
|
|
1. |
The Thermal Infrared Radiance Ratio Model (TS-RAM) method proposed by Coita and Royer |
Empirical version of TISI. |
Empirically derived from existing studies. |
|
(1997). |
|||
|
2. |
The Temperature Independent Spectral Indices (TISI) method proposed by Li and Becker (1 993). |
Paired day- and night-time acquired imagery. Emitted radiation acquired at night used to evaluate the daytime emissivity. |
Theoretically rigorous and produces satisfactory estimates of emissivity but the requirement for matched and accurately georectified day and night images is unlikely to be obtained for tropical areas which are frequently cloudy. |
|
3. |
The Aday method proposed by Coita and Royer (1997). |
Based upon the TISI method (Becker and Li, 1 990) in that it uses images taken at different times. |
Has two assumptions that are unlikely to be satisfied. One is that emissivity values in channel 3 and the two thermal infrared (TIR) channels (4 and 5) remain constant between images. Another is that there is a reasonable temperature gradient between images. This would be difficult to achieve in tropical areas. |
|
4. |
The Normalized Difference Vegetation Index (NDVI) Threshold method proposed by Sobrino et al. (2001). |
Uses the NDVI vegetation index to provide information about the state of the land surface. Assumes that pixels with a low value for NDVI are a mixture of soil and vegetation and high values represent a closed canopy and are assigned an emissivity value accordingly. |
Easy to implement as NDVI straightforward to calculate and emissivity values could be produced efficiently on a pixel-by-pixel basis. However, NDVI has limited sensitivity in tropical forests and highly attenuated in tropical atmospheres. |
The TS-RAM method allows for the calculation of emissivity values based on data acquired for each pixel, requires no ancillary data (we used what was available in the published literature) and could easily be implemented on an operational basis. The method is based on the theoretically rigorous Temperature Independent Spectral Index (TISI) method (Li and Becker, 1993) that uses the emitted radiation sensed at night, which consequently comprises no reflectivity information, to evaluate the daytime emitted radiation. Instead of using a matched pair of day and night images the TS-RAM model uses an empirical linear relationship derived between radiances in channel 3 and the thermal channels (4 and 5) to approximate the TISI parameter from which the emissivity can be calculated (equation 6)
where![]() is the radiance in channel 3,
is the radiance in channel 3,![]() is the surface emitted radiance calculated from the thermal channel, i is channel 4 or 5 of the AVHRR sensor,
is the surface emitted radiance calculated from the thermal channel, i is channel 4 or 5 of the AVHRR sensor, ![]() is the angular form factor (assumed as 1 at view angles less than
is the angular form factor (assumed as 1 at view angles less than ![]() is the solar irradiance at the top of the atmosphere in channel 3.
is the solar irradiance at the top of the atmosphere in channel 3.![]() is the atmospheric transmittance in solar direction in channel 3.
is the atmospheric transmittance in solar direction in channel 3.![]() i is the cosine solar zenith angle and
i is the cosine solar zenith angle and![]() is the diffuse downwelling solar irradiation.
is the diffuse downwelling solar irradiation.
The TISI parameter![]() is approximated from
is approximated from
where P and I are slope and intercept values respectively derived from simulation modelling studies carried out by Sobrino et al. (2001). The simulation conditions were reproduced using the MODTRAN 2.0 code and an emissivity database containing the emissivities for 124 different materials. For this case study, these published P and I values reported for a standard tropical atmosphere at a solar zenith angle of 45.7° were used.
Data Analysis and Results
The 15 images were spatially co-registered using a nearest neighbour approach (with an RMSE of < 1 pixel). The pixels representing the DVCA were identified, and their mean NDVI and MIR reflectance, derived using the assumed ( e = 1.0) and calculated (e = via TS-RAM method) emissivity values, extracted.
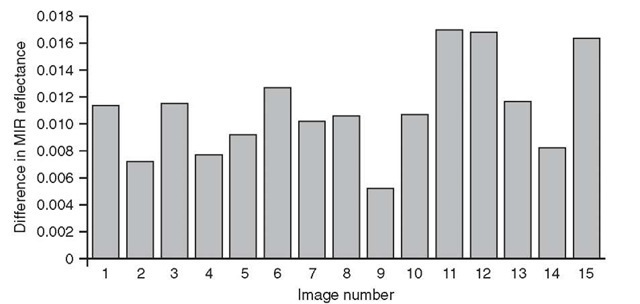
The two data sets of mean MIR reflectance derived for each image were compared, revealing that using an assumed emissivity value led to a lower MIR reflectance compared with the MIR reflectance derived using a calculated emissivity value (Figure 8.3). The magnitude of the difference between the two mean MIR reflectances for each image varies temporally. Further, the two data sets are different statistically at the 0.001 significance level.
Figure 8.3 Difference in MIR reflectance derived using the assumed and calculated emissivities
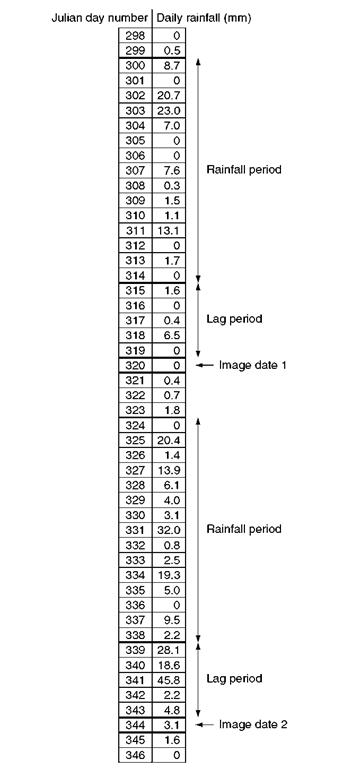
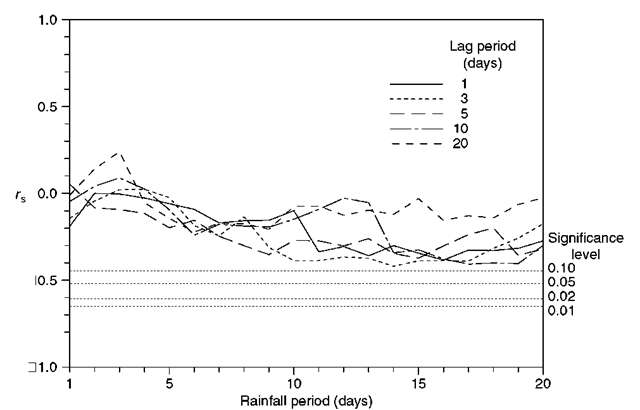
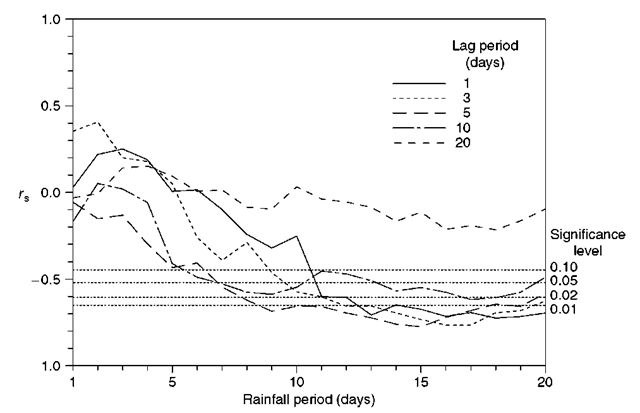
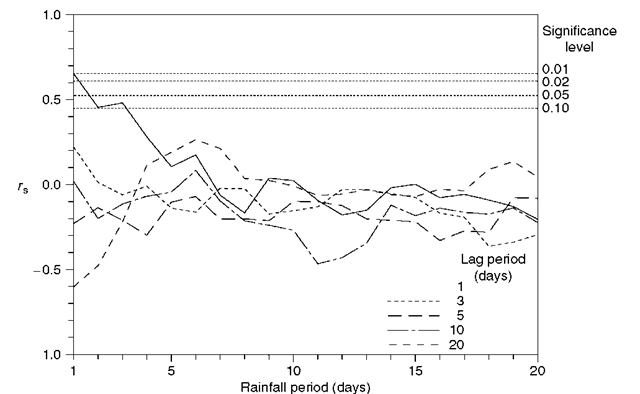
To determine if the variability in mean MIR reflectance across the 15 images was a function of ENSO-induced drought conditions, correlation analyses between mean MIR reflectance and the amount of rainfall preceding each image were undertaken. Rainfall was summed for a range of periods from 1 to 20 days that were lagged 1, 3, 5, 10 and 20 days before each image (Figure 8.4) and the correlation between the mean MIR reflectance responses from each image was plotted against the derived rainfall totals. This was conducted for the mean MIR reflectances derived using assumed and calculated emissivity values. The mean MIR reflectances derived using an assumed emissivity value were weakly related to rainfall totals, with a maximum correlation achieved using a three-day rain period at a 13 day lag (rs = – 0.42, insignificant at 0.05 level) (Figure 8.5). The mean MIR reflectances derived using an emissivity value calculated using the TS-RAM method were more strongly related to rainfall, with a maximum correlation achieved using a five-day rain period at a 14 day lag (rs = – 0.78, significant at 0.01 level) (Figure 8.6).
The above results indicate that the emissivity parameter used when deriving MIR reflectance is important. Uncertainty in emissivity has implications for the derived relationships between remotely sensed MIR reflectance and environmental variables, which are ultimately used for monitoring purposes. In this case study, using the emissivity values calculated using the TS-RAM method significantly increased the correlation between MIR reflectance and rainfall. This is of particular relevance since MIR reflectance appears to offer more useful information about the impact of ENSO-drought on the rainforest of Danum Valley than the more commonly used NDVI (Figure 8.7). Relationships between NDVI and rainfall were weak and insignificant. These results indicate that MIR reflectance is more sensitive to change in canopy properties, such as leaf biomass, foliar chlorophyll activity and water concentration, associated with ENSO-induced drought at this site than the NDVI. There is a good case, therefore, for reducing the uncertainty in the emissivity parameter when deriving MIR reflectance from the total radiant energy measured in AVHRR channel 3, and being more certain of the emissivity parameter used.
Figure 8.4 Example of 15 Julian day rainfall period taken five days (lag period) before image date. The total rainfall used in analyses for image date 1 would be 84.7 mm. This process is repeated for each of the 15 images and the Spearman’s rank correlation (rs) between total rainfall and remotely sensed data derived for increasing lag periods (n = 15)
Figure 8.5 Relationship between rainfall of different periods and at different lags to imagery and MIR reflectance derived using a constant emissivity value
Figure 8.6 Relationship between rainfall of different periods and at different lags to imagery and MIR reflectance derived using emissivity values calculated from the imagery using the TS-RAM algorithm
Figure 8.7 Relationship between rainfall of different periods and at different lags to imagery and NDVI
How Certain is Certain?
The above results illustrate that to use NOAA AVHRR data optimally to monitor the effects of ENSO on tropical rainforests such as those at the DVCA, MIR reflectance should be considered instead of the NDVI, but only if emissivity is known or can be predicted accurately. The mean emissivities calculated for the DVCA for each image vary temporally and spatially as would be expected. However, some values appear to be lower than would be expected, though they fall into the range reported in the literature (e.g. Nerry et al., 1990; Wan and Dozier, 1989). It is very tempting to use these values in the derivation of MIR reflectance as they produce MIR reflectances that are highly correlated with rainfall and these relationships can be used in the development of a monitoring system. Thus, the scenario presented is one of further uncertainty arising as a result of measurement error (i.e. the emissivities produced by the TS-RAM method may be inaccurate). The question is whether or not these MIR reflectances should be used. To help answer that question, the accuracy of the calculated emissivities needs to be evaluated.
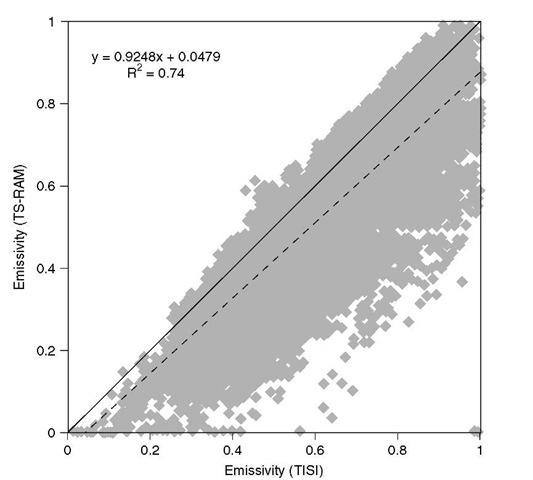
It was not possible to validate the emissivities obtained over the DVCA for each image in the time-series based on the data available. As an alternative, therefore, the emissivities produced by the TS-RAM method of one image were compared with those derived using a more rigorous approach, the Becker and Li (1990) TISI method. The TISI method requires a day-night pairing of images. However, only one of the 15 day images used in the time sequence had a corresponding night pairing data set and, due to cloud occurrence, this was of the area around the DVCA, rather than the DVCA itself, and therefore not ideal. The land cover of the Sabah state of Malaysia has a 60 % coverage of dipterocarp forests (Kasperon et al., 1990), with the remainder of the land cover including logged rainforests, oil palm and cocoa plantations, degraded rainforest, grasslands and urban areas, thus providing a range of emissivities to be compared. The emissivities produced using the TS-RAM and TISI approaches for 31 283 pixels extracted from the image were compared (Figure 8.8). A significant and large correlation (r = 0.86; at 0.01 level) was obtained between the predicted emissivities. Overall, the TS-RAM approach underestimated the emissivity of a pixel by 15.177 % in relation to emissivities obtained using the TISI method. This error adjustment could be applied to the calculated emissivities using the TISI method and MIR reflectances derived. However, without the ability to test the emissivities of each pixel of the DVCA in the time-series there would still be a known uncertainty in our remotely sensed data set. It is apparent, therefore, that in an attempt to reduce a known uncertainty further uncertainties have been uncovered. At what point, therefore, do we accept that we have uncertainty in our remotely sensed data but continue to use them?
Figure 8.8 Plot of the emissivities produced using the TS-RAM and TISI approaches applied to one image for 31 283 NOAA AVHRR pixels over Sabah, Malaysia
Conclusions
This topic explored one uncertainty associated with the use of NOAA AVHRR MIR reflectance data to monitor the impact of ENSO-induced drought on a tropical forest ecosystem of Sabah, Malaysia. It demonstrated that the use of MIR reflectance for this application shows considerable potential. However, this was compromised by the uncertainty associated with the emissivity parameter used when deriving MIR reflectance from the total radiant energy measured by the AVHRR sensor in channel 3. The processing of NOAA AVHRR imagery to derive MIR reflectance is a computationally demanding process and is still evolving (e.g. Nerry et al., 1998; Roger and Vermote, 1998). This, coupled with the realization that there is an important uncertainty associated with it, may discourage its use. However, the use of an emissivity parameter increased the correlations between MIR reflectance and rainfall above those obtained with the widely advocated NDVI.
Whilst there is no doubt that remotely sensed data can contribute greatly to our knowledge of terrestrial biospheric change, and has the potential to go further, with more useful employment of the data (e.g. to drive ecosystem simulation models) and launch of new satellite sensors designed for the purpose in mind (e.g. EOS Terra), there are also many uncertainties involved with its use. This study has illustrated the impact of just one area of uncertainty on a specific application There are, however, uncertainties at every stage of the use of remote sensing data in environmental research, for example, in data acquisition, calibration, processing and in its application and these are compounded further when using a multi-temporal data set such as that used in this case study. Moreover, we have still to wholly understand the nature of the data that are acquired in such great quantities and have, therefore, yet to realize the full potential of remote sensing. By identifying the impacts of uncertainty of remotely sensed data and ultimately overcoming them there is a vast and growing archive of data from which important information about the terrestrial biosphere can be extracted.
From this case study it is recommended that the use of MIR reflectance become more commonplace. This will be facilitated by other sensors that acquire MIR radiation (Envisat Advanced Along Track Scanning Radiometer (AATSR) and Terra Moderate Resolution Imaging Spectroradiometer (MODIS)), methods to use the data (e.g. Petitcolin and Vermote, in press) and the generation of global data sets of MIR surface reflectance (e.g. AVHRR Pathfinder II; El Saleous et al., 2000). However, before these data sets can be used on an operational basis the user must examine how the MIR reflectance values have been derived from full MIR radiation, in particular, how emissivity has been calculated and, thus, use the data with greater certainty.
![tmp255316_thumb[2] tmp255316_thumb[2]](http://what-when-how.com/wp-content/uploads/2012/02/tmp255316_thumb2_thumb.png)
![tmp255333_thumb[2] tmp255333_thumb[2]](http://what-when-how.com/wp-content/uploads/2012/02/tmp255333_thumb2_thumb.png)
