Mathematical model with delay time in infection period
In this section, we take a delay time into account and re-analysed the resulting model by introducing a new compartment to mimic the presence of the delay time. This is done by adding a sub acute or minor acute compartment Am into the previous system. The sub acute population has a lower force of infection than the acute population considering their worm burden status, and it might be not infectious yet. This is reflected by a lower successful rate of filarial transmission PV 2 from the sub acute to susceptible mosquito population, compared to the successful rate of filarial transmission from the acute population PV 1 . In this case, we can consider the sub acute compartment consist of exposed or latent individuals. Individuals stay in sub acute compartment with the sojourn time 1/ γ before they leave to the acute compartment. The system of equations takes form as the following,
Numerical examples for the model with delay time in infection period
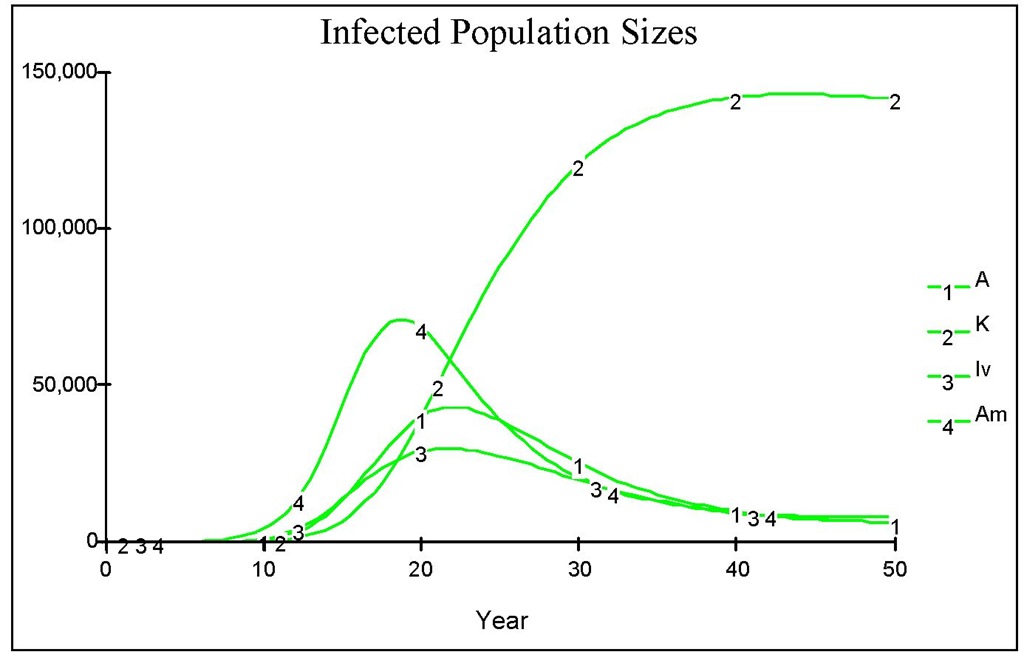
As in the previous section, we provide a simulation for the model of equations (7) to (11) to gain some insights. The parameters are the same as before unless it is stated explicitly. Compared to Figure 1, in which there are 10 acute infected human initially, Figure 10 shows that the present of time delay, by assuming that the sojourn time in the sub acute compartment is 5 years (hence γ is 1/5) with the probability of transmission to the mosquitoes is only 10% of the probability of the acute compartment (hence PV2 is 0.01), has an effect on significantly delaying the accumulation of the chronic and reducing the number of acute human population. However, the total infectious![]() in Figure 10 is slightly greater than the total infectious ( A ) in Figure 1.
in Figure 10 is slightly greater than the total infectious ( A ) in Figure 1.
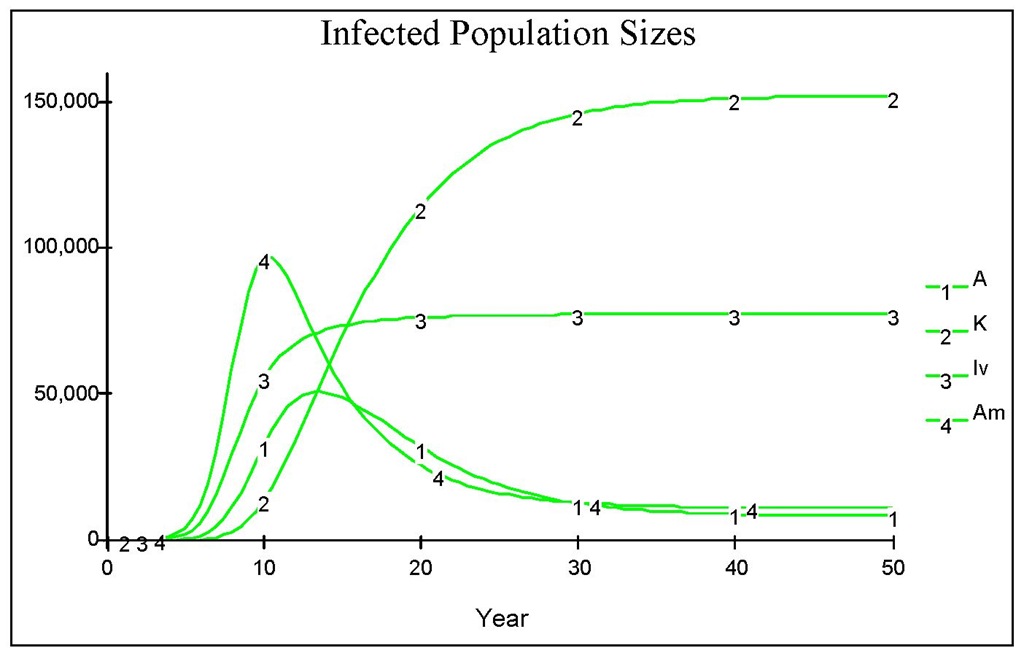
We can also simulate if in fact we were unable to perfectly isolate the chronic individuals, hence there is a transmission from a portion of them to the mosquitoes. We would expect the transmission rate from the chronic is far greater than the one from the acute population, say the transmission is more certain considering the worm burden carried by them. One of the realisations is shown in Figure 11.
Fig. 10. The dynamics of infected population when there is no medical treatment after the invasion of infected human comprising of 10 acute individuals. Here we assume that there is no sub acute individual, initially.
Fig. 11. The dynamics of infected population as with all parameters as in Figure 10, with an addition that infection also occurs from the chronic by assuming there is no perfect isolation.
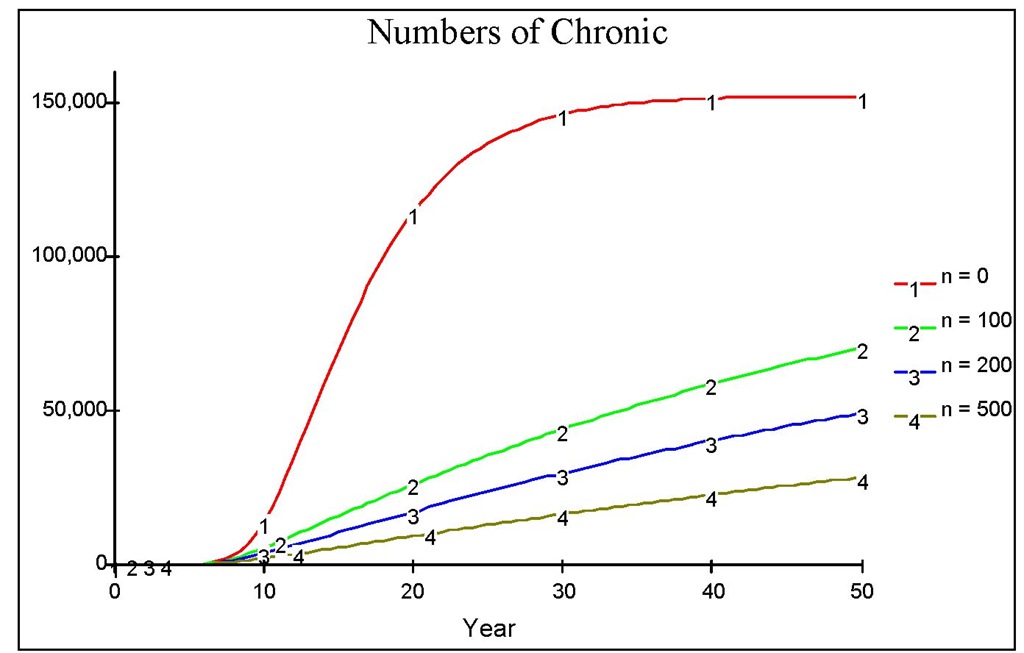
Fig. 12. The dynamics of chronic population when there is an early medical treatment with various values of n.
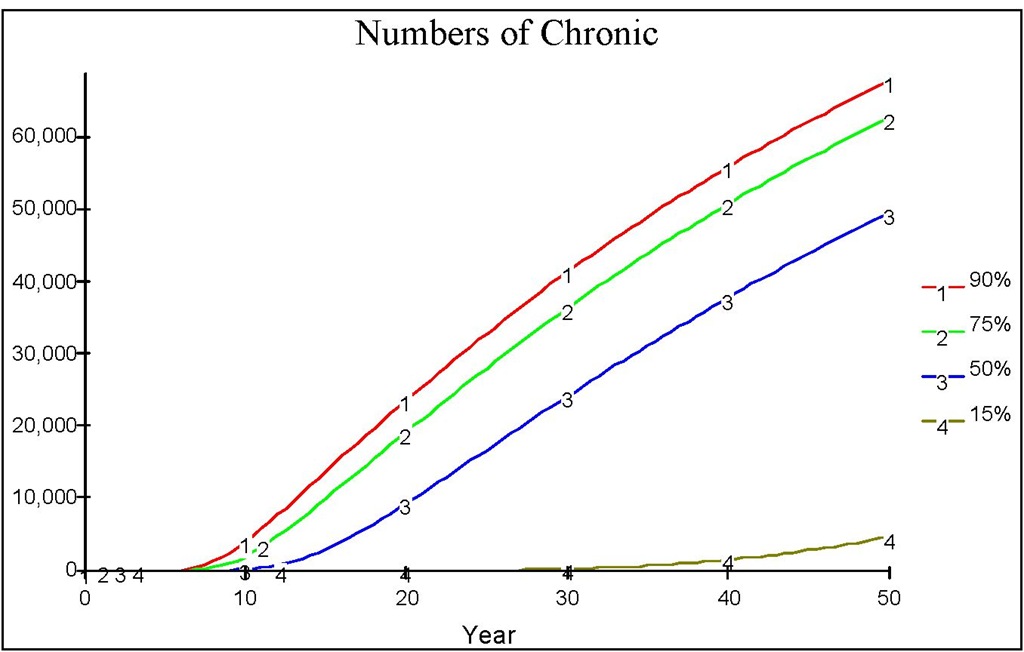
Fig. 13. The dynamics of chronic population when there is an early medical treatment with n=100 together with the various reduction of the biting rate up to a certain level.
The figure reveals that the peak of the outbreak is higher and reached earlier compared to that in Figure 10. Note that in the early years, there is an iceberg phenomenon, in which the number of chronic is far less than the number of acute. This indicates that early treatment is better than late treatment. Suppose that we administer a medical treatment as in the previous section, measured by the number of screening n. Figure 12 shows various regimes of treatment done continuously since the beginning of the course of the epidemic. Figure 13 shows that a low level of medical treatment combined with the high reduction of biting rate (e.g. up to 15% of the original biting rate) performs better than that resulting from high level of medical treatment with no reduction in biting rate.
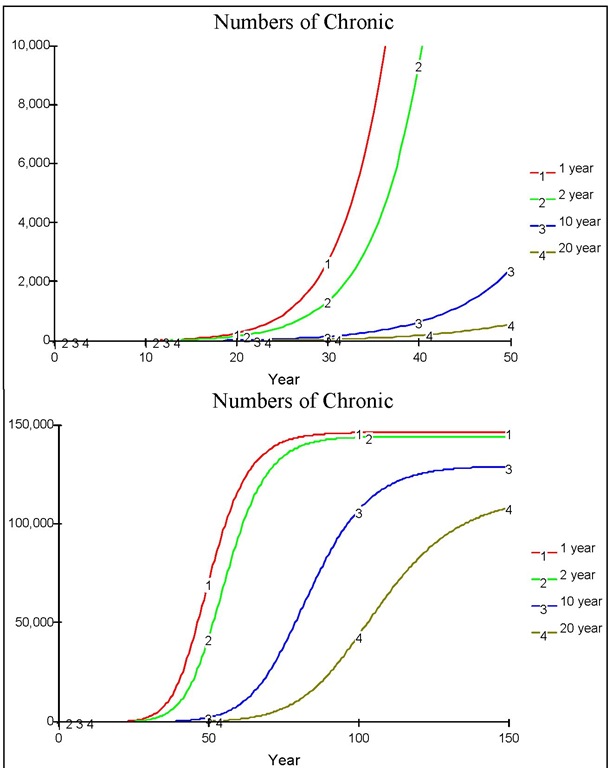
Fig. 14. The dynamics of chronic population when prophylaxis is given to the whole population with various effects to the sub acute sojourn time (equivalent to the reciprocal value of the recruitment rate from sub acute to acute population).
Suppose now that we have another scenario of treatment, that is giving prophylaxis to all the populations (set n=0, simply to evaluate the effectiveness of this prophylaxis). The prophylaxis works by inhibiting the growth of the worms inside human, say by delaying the recruitment into the acute population A from the sub acute population Am . Technically this is done by varying the values of the transition rate γ (or equivalently the sub acute sojourn time 1/ γ ) in the model. Figure 14 shows the effect of delay for various sojourn time due to the effect of the prophylaxis application. It seems that all the graphs increase exponentially (upper figure), but in fact at the end they end up to their stable equilibrium (lower figure) with different speed and different peak. This indicates that controlling the density of worm inside the body of infective human is effective in reducing the number of filarial infection. The model assumes that the delivery of prophylaxis has a result in a constant effect over time, which doesn’t reflect the reality. To increase the realism, we should consider the decrease of prophylaxis effectiveness by modifying or refining the model. Nevertheless, we still can apply the current model by only believing the short-term prediction given by the model, say only in one to two years prediction and use it as guidance in a periodic delivery of a mass drug administration program.
The introduction of a single exposed compartment is not without a problem. Getz and Lloyd-Smith (2006) showed that a single exposed compartment will produce an exponentially-distributed sojourn time in the exposed stage. Referring to our delay model (equations (8) and (9)), this distribution has mean at 1/ γ while its modus is at 0 , which is a poor match to the real distribution of latent periods. Plant and Wilson (1986) pointed out that the drawback can be resolved by introducing a distributed delay or staging delay time approach comprising of k classes of sub acute or exposed individual. This approach gives a gamma-distributed total time of individuals staying in the exposed class with mean 1 / γ and variance 1 / ^γ2 ). Note that a fixed time delay 1 / γ is obtained whenever the number of delay stages k approaches the infinity.
In this part we use this approach (see also Getz and Lloyd-Smith (2006)) to our delay model by introducing multiple exposed compartments which is more appropriate to the disease like filariasis which has more than one different exposed stages. The general model is the same as equations (7) to (11) except that equations (8) and (9) are replaced by
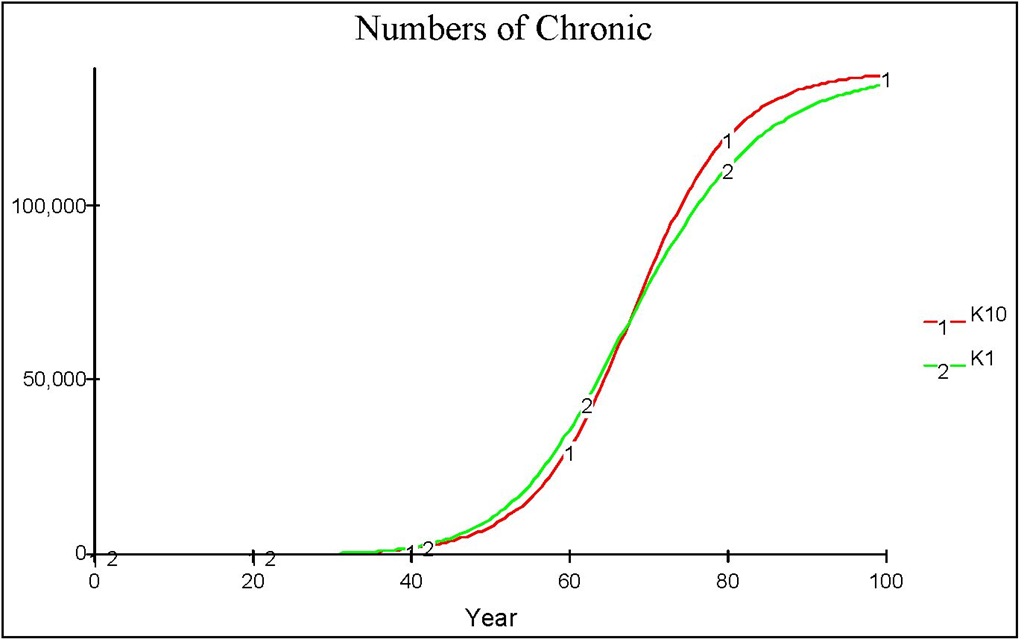
The system is much more complex since it consists of 15 differential equations compared to just 6 differential equations in the previous model. However, numerical example in Figure 15 shows that for k = 10 (and also for any k > 1 ), the simpler model of equations (7) to (11), qualitatively, is a good approximation of the more realistic model of the same equations but with equations (8) and (9) are replaced by equations (12) to (14). Initially, the prediction of simpler model ( K1 in Figure 15) slightly overestimates, but then after a certain years it begins to underestimate, the "true" numbers of chronic individuals ( K10 in Figure 15). However in the long-term both model produce the same equilibrium point (not shown in the Figure).
Fig. 15. The dynamics of chronic population predicted by the simple model of equations (7) to (11) and the more realistic staging delay time model of the same equations but with equations (8) and (9) are replaced by equations (12) to (14).
Conclusion
In this topic we review a mathematical model of filarial transmission in human and in mosquitoes. Some simulations are carried out to obtain some insights regarding the transmission and possible actions to control the transmission. Some refinement of the model could be done in many directions to increase the realism of the model and to obtain a more accurate prediction. New directions may include the evolutionary, sosio-economics, and climatology aspects of the disease (Levin, 2002).
In the evolutionary issues of epidemiology, some agents of diseases may develop resistance to certain drug. It is worth to explore how this affects the transmission of the diseases. In many situations, especially in developing countries, there always competing interests related to limited resources and budget. There are many other important diseases, other than filariasis, needs for attention. Choosing the right priorities are among the concerns of health managers and authorities. In the absence of sufficient health budget it is important to address questions like the long term consequences when the treatment is terminated, either purportedly, e.g. because the budget is re-allocated to a higher priority health problem (to other endemic places of the same disease or to other disease problems) or inadvertently (due to the decreasing compliance of the program implementation). This is an example of sosio- economics issues in epidemiology (Supali et al., in prep.). Climate change also regarded as a factor contributes to current emerging and re-emerging infectious diseases. For example, since the global temperature is rising then suitable habitat for mosquitoes becomes wider. It is reported that many parts in the globe of previously free from mosquito is now invaded by incoming mosquitoes. To obtain a better prediction of global filarial transmission, this climatology aspect also should be considered. We believe that there are many other venues are possible for future research in mathematical aspect of filariasis transmission.
![tmp2EA-41_thumb[2] tmp2EA-41_thumb[2]](http://what-when-how.com/wp-content/uploads/2012/05/tmp2EA41_thumb2_thumb.png)
![tmp2EA-49_thumb[2] tmp2EA-49_thumb[2]](http://what-when-how.com/wp-content/uploads/2012/05/tmp2EA49_thumb2_thumb.png)
