ABSTRACT
This paper presents an experimental protocol developed to locally estimate different energy balance terms associated with the high cycle fatigue (HCF) of steels. Deformation and dissipated energy are respectively derived from displacement and temperature fields obtained using digital image correlation (DIC) and quantitative infrared thermography (QIRT) techniques. The combined processing of visible and infrared images reveals the precocious, gradual and heterogeneous development of fatigue localization zones. It also highlights the plastic character of dissipative heat sources (i.e. proportional to the loading frequencies), and the progress of fatigue dissipation, observing the drift of the mean dissipation per cycle for a given loading. The substantial of internal energy variations during HCF loading are finally underlined. The paper ends with a discussion on the consequences of such energy balance properties in terms of HCF modeling.
Introduction
Standard characterization of fatigue in materials requires time-consuming and statistical processing of the numerous results generated by expensive mechanical tests. Over the last two decades, alternative experimental approaches have been developed to reliably and rapidly measure fatigue characteristics. These new approaches include thermal methods based on the analysis of self-heating during stepwise loading fatigue tests [1-2]. Although realistic estimates of fatigue characteristics have sometimes been obtained, the thermal approach often leads to questionable results [3]. The direct use of temperature as a fatigue indicator may not always be the most relevant approach since temperature variations are not intrinsic to the material behavior. Energy approaches have been consequently proposed [4-6].
During high cycle fatigue, part of the generated heat comes from irreversible manifestations of micro-structural defects (e.g. intra-granular slip bands), while another part comes from thermoelastic coupling sources linked to reversible thermal expansion of the crystalline network. A combined image processing technique was thus developed to obtain 2D patterns of energy balances. Speckle image correlation techniques, involving a charge-coupled device (CCD) camera, were used to assess surface displacement fields. In parallel, thermal data were provided by an infrared focal plane array (IRFPA) camera. Heat sources were estimated on the basis of partial derivative operators present in a local form of the heat diffusion equation by using a set of approximation functions that locally fits the displacement and temperature field and takes the spectral properties of the sought sources into account [7].
The present paper shows several important properties associated with the fatigue of a dual-phase steel (DP600) commonly used in mechanical industries. This paper laid out as follows: the different terms of the energy balance associated with high cycle fatigue of steel are first recalled. A brief presentation of the experimental set-up is then given, while the main part of the paper presents the energy balance properties. In particular, the precocious, gradual and heterogeneous development of fatigue localization is shown. Then the "plastic" character of dissipation (i.e. proportional to the loading frequency fL) and the evolution of the mean dissipation per cycle during blocks of cycles within a constant stress range Ao for a given fL and a given stress ratio Ro are successively underlined. Finally, the experiments revealed substential internal energy variations (stored energy) during so-called elastic loading cycles. The paper ends with a discussion the consequences of such energy properties in terms of HCF modeling.
Theoretical background
a. Heat equation
Concepts and results of the thermodynamics of irreversible processes must be used to define the different heat sources induced by HCF processes. In this paper, thermodynamics with internal state variables will be used, whereby the equilibrium state of each volume material element is characterized by a set of n state variables [8]. The chosen state variables are the absolute temperature T, the small strain tensor e, and the n-2 scalar components (ai, …, an-2) of the vector a of so-called "internal" variables that model the micro-structural state of the material. By construction, the thermodynamic potential is the Helmholtz free energy y. Combining the first and second principles of thermodynamics leads to the local heat diffusion equation:
where p denotes the mass density, C the specific heat, k the heat conduction tensor, o the Cauchy stress tensor and e the strain rate tensor. The left-hand side consists of a differential operator applied to the temperature, while the right-hand side pools the various types of heat source: the intrinsic dissipation d1, the thermo-mechanical coupling sources sthc, and the possible external heat supply re (e.g. radiation exchanges). The intrinsic dissipation characterizes the material degradation accompanying the irreversible microstructure transformation, while the thermo-mechanical heat sources translate the thermo-sensitivity of the matter, indicating that the mechanical and thermal states are closely coupled. When the couplings are only due to thermo-elasticity, the coupling sources are limited to the famous Lord Kelvin’s term
Up to now, the following strong hypotheses have been put forward to compute heat sources:
- the mass density and the specific heat are material constants, independent of the thermodynamic state.
- the heat conduction tensor remains constant and isotropic during the test (ky = k.8y).
- the external heat supply re due to heat exchange by radiation is time-independent, so the equilibrium temperature field![]() It is then convenient to consider the temperature variation 8 defined by
It is then convenient to consider the temperature variation 8 defined by
Taking the latter hypotheses into account, the heat equation can be rewritten in the following compact form:
where 8 is the particular time derivative of the temperature variation, A the 3D Laplacian operator, w’h the overall heat source, while wh is the heat locally evolved and where the non standard dot (.)• specifies that the energy rate is path dependent (i.e. such energy is not a state function).
These hypotheses are reasonable in many situations and in particular at the beginning of HCF processes. However, they become inadequate when a strong anisotropy pre-exists or develops during the loading, whether a strong strain and/or damage localization occurs or whether the thermo-mechanical loading leads to dynamic instabilities.
Energy balance
Let us consider a load-unload cycle, where![]() denote the thermo-mechanical states of the material at the extremities of the process. Let us then draw up the energy balance corresponding to the following three situations:
denote the thermo-mechanical states of the material at the extremities of the process. Let us then draw up the energy balance corresponding to the following three situations:
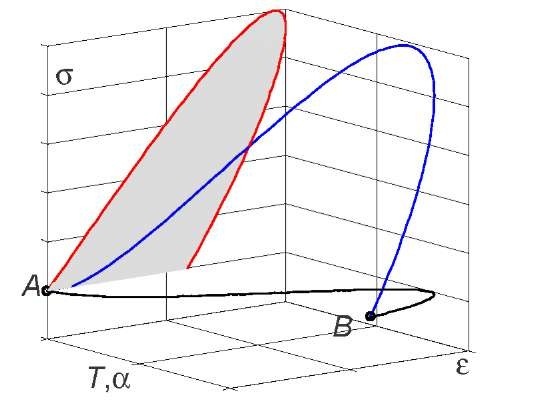
- case 1: A ^ B, this general situation can be illustrated by the schematic stress-strain diagram proposed in Fig. 1.
- case 2: A ^ B and eA = eB, a mechanical cycle is then associated with the load-unload test. The stress-strain diagram shows a hysteresis loop.
- case 3: A = B, the mechanical cycle is now a thermodynamic cycle.
For a quasi-static process and under the small strain hypothesis, the rate of deformation energy is classically defined by:
Following Eq.(1), the intrinsic dissipation d1 is then the difference between the deformation energy rate ef, and the sum of the elastic we and stored ws energy rates:
Both principles of thermodynamics give an alternative expression of the volume deformation energy associated with the load-unload test:
Fig. 1 Schematic stress-strain diagram for a load-unload test; tB-tA is the cycle duration
Equation (7) shows that:
-case 1: in the general case, the balance of deformation energy during a load unload test involves, energy dissipation, internal energy variations, variation of heat stored in the material, coupling heat sources.
- case 2: for a mechanical cycle, the deformation energy then corresponds to the energy Ah of the area of the hysteresis loop.
- case 3: for a thermodynamic cycle, this hysteresis loop is then only due to dissipation and couplings when the heat capacity pC is assumed to be constant.
The energy balance form then gives the restricted conditions for which the dissipated energy can be estimated by computing the hysteresis area of a uniaxial load-unload cycle. This underlines the necessity of analyzing the thermal effects to verify if a mechanical cycle is also a thermodynamic cycle, and of checking the relative importance of coupling effects. It is worth noting that in the case of HCF of DP 600 steel, the thermoelastic energy remains negligible over a complete cycle. Moreover, after some cycles, the temperature becomes periodic and the mean temperature variation stabilizes. In such cases, the deformation energy over a loading cycle consists of dissipated energy and internal energy variation.
If the deformation energy is equal to the dissipated energy, the mechanical cycle is a thermodynamic cycle (case 3) and there is no overall microstructure evolution over a cycle. A mechanical illustration of this situation is the perfect elastic-plastic shakedown. If the deformation energy is greater than the dissipated energy (while neglecting coupling heat over a cycle), the material stores some internal energy (case 2). This stored energy is used by the material to modify its microstructure. If the deformation energy becomes declines to below the dissipated energy, part of the stored energy is then transformed into dissipated energy which means that the material is no longer able to adapt its microstructure.
Note that dividing the volume energy (resp. energy rate) by the volume heat capacity pC of the material gives the volume energy (resp. energy rate) expressed in °C (resp. in °C.s-1). This operation is convenient because it associates equivalent heating in adiabatic conditions and then gives the orders of magnitude of this energy (resp. energy rate) in readily understandable units.
Experimental arrangement
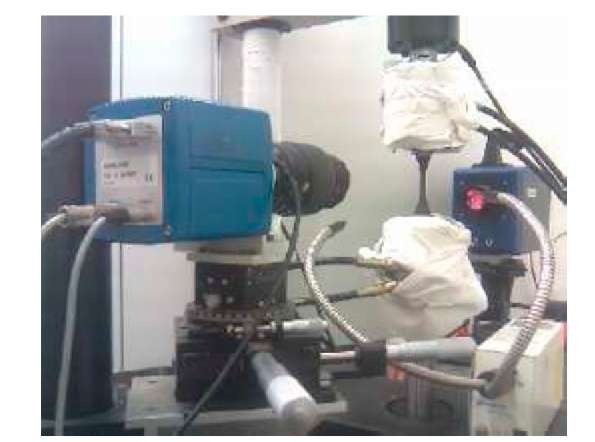
The experimental set-up, designed to derive local energy balances, involved an MTS hydraulic testing machine (frame: 100 kN, load cell: 25 kN), a Camelia 8M high resolution CCD camera and a Cedip Titanium infrared camera. The optical axis of both cameras was set perpendicularly to the frame of the testing machine, and remained fixed during the test. A simultaneous record of infrared and visible images was performed on each side of the sample surface, and thin flat samples were therefore used.
Fig. 2 Experimental set-up. (Front): CCD camera and cold light sources, (back): IRFPA camera. The grips and columns of the testing machine are roughly wrapped to avoid parasitic reflection
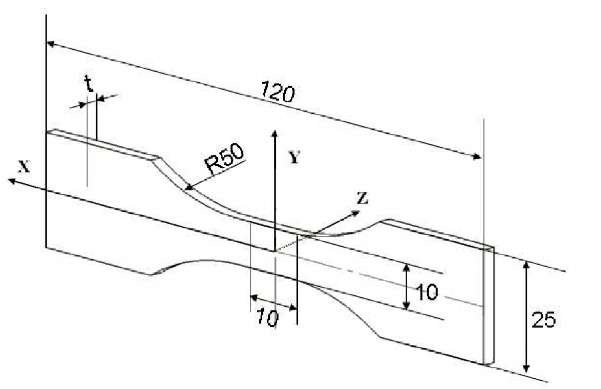
The sample shape corresponded to a standard dog-bone specimen (Fig.3). The sample surface in front of the CCD camera was speckled with white paint on a black background to optimize the contrast of local optical signature, while the surface emissivity of the sample gauge part placed in front of the IR camera was increased and homogenized using mat black paint. Typically the size of the analyzed zone was about 10×10 mm2 for a space resolution of about 0.1 mm. The conventional strain rates were less than 10-2 s-1. This strain rate order of magnitude ensures the quasi-staticity of processes and induces significant (thermal) signal-to-noise ratios.
Fig.3 Shape of the specimen (unit: mm) and frame of reference
Each camera was controlled by a separate computer although a specific electronic device was designed to synchronize the frame grabbing of the two cameras. Using this device, the synchronization error between the two cameras is estimated to be less than 0.05 ms.
Reference speckle and infrared images were mapped by determining the affine transformation coefficients (rigid body movement and homothetic transformation) of the shape of a calibrated target. The main material constants of the DP600 steel are given in Table 1.
Tab. 1 Thermophysical properties of DP600
 |
 |
 |
 |
|
10-11 |
7800 |
460 |
64 |
For each acquisition time, the thermal data given by the IR camera (measured in the current Eulerian configuration) were linearly interpolated in space and time using the positions of the deformed configuration given by the DIC computation. This operation allowed the material surface element (mse) associated with the DIC mesh to be tracked so that the extent of the volume heat rate induced by matter convection and associated with the particular time derivative of the temperature could subsequently be computed and checked. Readers interested in the many tricky metrology issues and in a detailed presentation of the image processing can refer to [7, 9].
An appropriate image processing method was developed to separately estimate fields of mean intrinsic dissipation per cycle d1 and fields of thermoelastic source amplitude![]() [5, 7]. The local fitting function 8fit of the temperature charts is chosen as:
[5, 7]. The local fitting function 8fit of the temperature charts is chosen as:
where the trigonometric time functions describe the periodic part of the thermoelastic effects while the linear time function takes transient effects due to heat losses, dissipative heating and possible drifts in the equilibrium temperature into account. Functions p,(x, y), i = 1,…,4, are 2nd order polynomials in x and y. These polynomials enabled us to take the possible spatial heterogeneity of the source patterns into account.
Experimental results
Description of tests
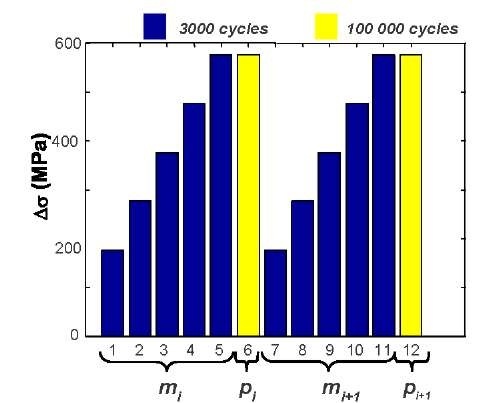
Tests involved loading blocks, with each block being performed at constant![]() Tests were constructed in stages (Fig. 4), each stage S,, i=1,2, …, including:
Tests were constructed in stages (Fig. 4), each stage S,, i=1,2, …, including:
- a series of 5 "mini" blocks of 3 000 cycles per block with increasing Ao varying regularly from 175 up to 580 MPa (m^,
- a large block of 100 000 cycles performed at Ao = 580 MPa (p)
Fig.4 Basic sketch of the fatigue test
The stages were repeated until a macro-crack occurred. The series of mini blocks was performed to construct the curve d1 vs. Ao at a "constant" fatigue state, while the large blocks were defined, close to the fatigue limit so as to speed up the fatigue progress. For the large blocks, camera shots were regularly taken to check the monotonous evolution of dissipative effects.
Mechanical response
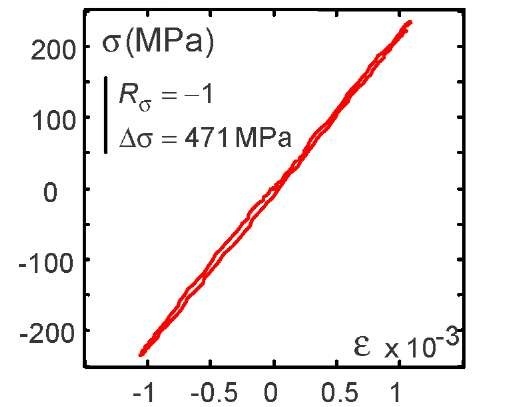
To visualize the hysteretic mechanical response of the material during a loading cycle, and to improve computation of the deformation energy corresponding to the hysteresis area of the stress-strain curve (Fig. 3), the CCD camera data acquisitions were performed at fL= 5.10-3 Hz to increase the fS/fL ratio, with fS de g the frame rate of the camera (fS = 3 Hz).
Fig.5 Mechanical hysteresis loop corresponding to case 2.
Note that the the stress state fields were computed assuming a plane stress state and an isochoric transformation. These hypotheses are naturally questionable, particularly at the end of the specimen’s life, where the triaxiality of the stress state is certainly coupled with damage development. Note also that the complete passage from strain to stress field measurements has already been detailed in [10]. The relation used to compute the mean deformation energy rate over a cycle was then:
