ABSTRACT
Fatigue characterization is an expensive operation commonly undertaken in industry. Some authors thus developed experimental measurement methods based on the materials thermomechanical behaviour to provide faster fatigue limit estimations. Yet, the physical ground of these methods needs to be understood. In this work, it has been assumed that heat dissipation phenomena are related to dislocation movements in the material lattice (internal friction); changes in the dislocation characteristics (through plastic straining for example) will affect the material dissipative behaviour.
The dissipative energy characteristics of a Dual-Phase 600 grade (DP600) have been experimentally estimated during traction-traction cyclic loadings on thin sheet specimens. The specimens surface temperature variations have been recorded using an infrared camera and analysed using the heat balance equation. Each dissipative energy measurement has been performed for a specific microstructural state of the material (no macroscopic plasticity occurs during the measurement).
The effect of different loading sequences on the material dissipative behaviour has been tested and interpreted using the commonly used specific damping capacity. The dissipative energy (the dislocation mobility) has been proved to increase with the macroscopic plastic strain and to be affected by aging periods at ambient temperature.
INTRODUCTION
Fatigue characterization is a time consuming and expensive operation commonly undertaken in industria. The development of many theories and experimental measurement techniques is thus of first interest to provide faster fatigue limit estimation methods. Thus, with the development of infrared cameras, some authors proposed experimental methods to estimate the fatigue limits based on the material temperature increase under cyclic loading [1,2]. Yet, the physical explanation of such methods is not fully understood, and heat dissipation phenomena needs to be more thoroughly studied.
The thermomechanical sources of materials can be dissociated into two main phenomena, such as the thermomechanical coupling and the dissipative energy. The dissipative energy, responsible for the mean temperature increase of the specimen under harmonic loading, can be experimentally measured by solving a heat balance equation [3]. An experimental method to precisely measure the dissipative energy is proposed in [4] and is used in this study.
The dissipative energy phenomena is related to internal friction mechanisms [5]: under loading, the material defects (inclusion, dislocations, etc) are moving in the material lattice and dissipate energy, the main part of dissipated energy being attributed to dislocation movements. It seems thus that the dissipative energy should depend on the material microstructure such as the mobile dislocation density, their spatial repartition and interactions, the lattice friction coefficient etc. In fewer words, the dissipative energy should be a good experimental criterion to monitor the material microstructural evolution.
Moreover, it is well known that loading history has a direct impact on the material microstructure. Depending on the applied loading, the dislocations move, extend, multiply [6,7], or create specific spatial structures [8-11] such as cells, persistent slip bands etc. The dislocation density usually increases with the plastic strain. In this study, it is thus chosen to observe the correlation between the dissipative energy, the plastic strain and from a more general point of view, with the loading history.
Few works have been made to analyse the dissipative energy evolution with the cold work. The temperature versus alternate stress curve has been studied in [12,13] on different cold worked specimens. Yet, as the materials were loaded with![]() are respectively the minimum and maximal stress), heat dissipation was probably due both to internal friction and macroscopic plasticity. In this work, every dissipative energy measurements have been performed during traction-traction tests
are respectively the minimum and maximal stress), heat dissipation was probably due both to internal friction and macroscopic plasticity. In this work, every dissipative energy measurements have been performed during traction-traction tests![]() and when no macroscopic plastic strain (ratcheting effect)occurs. Thanks to these loading conditions, internal friction and macroscopic plasticity have been dissociated [14] and attention has been focussed only on the heat dissipation due to internal friction. In the rest of this study, the heat dissipation due to internal friction will be simply referred as "heat dissipation" or "dissipative energy".
and when no macroscopic plastic strain (ratcheting effect)occurs. Thanks to these loading conditions, internal friction and macroscopic plasticity have been dissociated [14] and attention has been focussed only on the heat dissipation due to internal friction. In the rest of this study, the heat dissipation due to internal friction will be simply referred as "heat dissipation" or "dissipative energy".
This paper presents thus an experimental measurement of the dissipative energy variation along with the uniaxial plastic strain of a dual phase steel (DP600). The idea is that such experimental data may help to better understand heat dissipation phenomena and provide some data to temperature increase predictive models.
EXPERIMENTAL PROCEDURE AND RESULTS
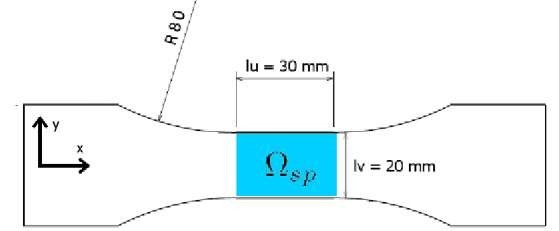
This study has been performed on a specimen machined in a 2 mm thick steel plate of DP600 steel which geometry is presented in Figure 1.
Fig. 1 Specimen geometry
The dissipative energy and plastic strain in the observed area Qsp have been monitored with the experimental setup presented hereafter.
Plastic strain measurement. The strain has been measured with a 350 strain gauge (Vishay, CEA-06-250UW-350) connected to a quarter Wheatstone Bridge. This strain gage was bonded on one side of the specimen in the loading direction. In all this study, plastic strain has been measured while no loading was applied to the specimen.
Dissipative energy measurement. The dissipative energy is measured using an infrared CEDIP Jade camera by applying the experimental procedure proposed in [4,14]: during a dissipative energy measurement, the specimen is cyclically loaded and the temperature field of the observed area Qsp is acquired. The dissipative sources are estimated using a local energy balance which general shape is:
where p is the material density, C the calorific capacity, k the thermal conductivity and A2 the laplacien operator. Q is here the local temperature variation measured with the infrared camera. This equation gives thus the local dissipative sources dj and the sources due to the thermoelastic coupling Sth by estimating :
• the energy stored by temperature increase
• energy exchanges by conduction
• and energy exchanges by convection and radiation
is a time constant characterizing the convection and radiation exchanges. Equation 1 is then integrated over the observed area![]() and over each cycle which provides the dissipative energy per cycle
and over each cycle which provides the dissipative energy per cycle
where fL is the loading frequency and ti the beginning of the cycle i. In this study, the specimen have been harmonically loaded with![]() For each stress levels, a high enough number of cycles have been applied so that the material reached a steady state (the mean strain remains constant). As the loading ratio is greater than zero, no macroscopic plastic strain occurred during the dissipative energy measurements. The dissipative energies measured in these conditions have been attributed to internal friction. Moreover, the dissipative energy is constant during each measurement. Only the temporal mean of the dissipative energy has thus been used in this paper. This temporal mean will be noted Em in the rest of this paper. A noise level analysis showed that the measurement incertitude of a mean
For each stress levels, a high enough number of cycles have been applied so that the material reached a steady state (the mean strain remains constant). As the loading ratio is greater than zero, no macroscopic plastic strain occurred during the dissipative energy measurements. The dissipative energies measured in these conditions have been attributed to internal friction. Moreover, the dissipative energy is constant during each measurement. Only the temporal mean of the dissipative energy has thus been used in this paper. This temporal mean will be noted Em in the rest of this paper. A noise level analysis showed that the measurement incertitude of a mean
dissipative energy![]() (±2 Standard deviations) is of ±100 J.m"3.cycle_1 for a loading frequency of :
(±2 Standard deviations) is of ±100 J.m"3.cycle_1 for a loading frequency of :![]() [14].
[14].
To summary, this experimental setup provides the plastic strain ep while the specimen is not loaded and the dissipative energy Em under cyclic loading in steady state conditions. Measurements sequences have been organized in this work to d1strudy the correlation between dissipative energy and plastic strain.
Six measurement sequences at different loading levels (Phase I to VI) have successively been applied to the specimen, each sequence being designed to reach a different goal: the material initial state behaviour is analyzed during Phase I. The material is then plastically strained and its evolution is analyzed during Phase II. Phase III and IV are then performed to monitor the changes in the material dissipative energy due to the previous two phases. Phase V and VI are applied after a rest period to analyse recovery period effect on the material dissipative behaviour.
The tests sequences are represented graphically in the upper graph of Figure 2. In this representation, each point represents three successive tests:
• a cyclic loading at the maximum stress (represented by the point ordinate) applied until a steady state is reached,
• then a dissipative energy measurement in the same loading conditions,
• and eventually a plastic strain measurement ep while the loading is zero.
The cumulated plastic strain ep at the end of each test is presented in the bottom graph of Figure 2.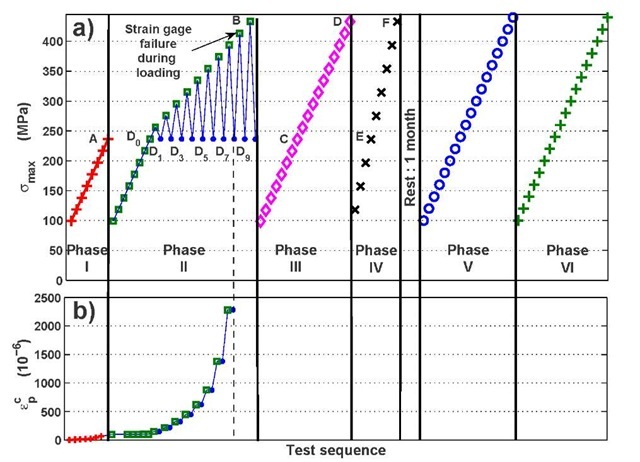
Fig. 2 DP600: test sequence and associated cumulated plastic strain ep measurements
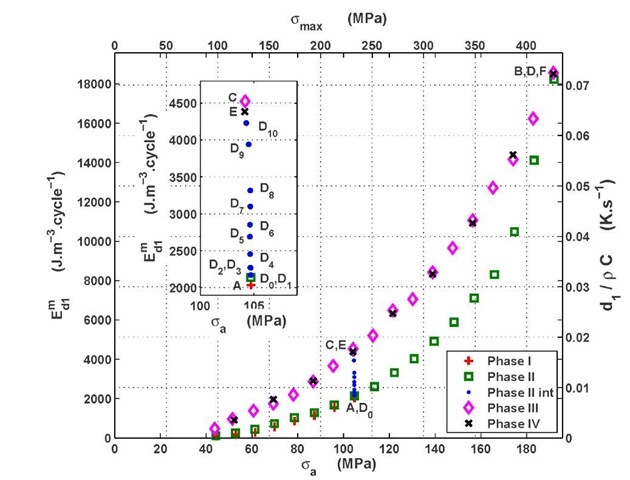
Phase I: the dissipative behaviour of the material in its initial state has been analyzed during this phase. Dissipative energy measurements have been performed for increasing maximal stress Omax from 100 to 240 MPa by steps of 20 MPa (figure 2, upper graph): the dissipated energy per cycleE^ increases with the alternate stress (figure 3, Phase I). The yield stress at 0.02% being of 295 MPa for the DP600, the cumulated plastic strain ep remained small during these tests (figure 2, bottom graph).
Phase II: the reproducibility of the results of Phase I has been checked during the 1Kt levels of Phase II: as in Phase I, dissipated energy measurements have been performed while increasing the maximal stress Omax from 100 to 240 MPa by steps of 20 MPa. As expected, the plastic strain did not change during these 1rst steps and the dissipative energies per cycle Em overlap; the measurements are well reproducible on the same specimen.
Then, the maximal stress omax has been increased from 260 to 440 MPa by steps of 20 MPa (figure 2, Phase II). The material microstructural state after each loading step have been characterized both with a cumulated plastic strain measurement ep (figure 2, bottom graph) and a dissipated energy measurement under identical loading conditions (omax =240 MPa, dots D2..D10 in figures 2 and 3). The measured dissipated energies show a progressive increase after each load.
Phase III : at the end of Phase II (point B, figure 2), the material has been plastically strained at omax =440 MPa and reached an elastic behaviour. The material microstructural state in B (referred to as "state B") is thus different from its initial state and should have a different thermomechanical behaviour. The thermomechanical behaviour of the material microstructure in state B has been tested by increasing the maximal stress Omax from 100 to 440 MPa by steps of 20 MPa. As expected, the measured dissipated energy (Figure 3, Phase III) is always greater than the dissipated energy of the material in its initial state (Phase I) and for lower plastic strains (Phase II): Phase III is a thermomechanical characterization of the material in state B while Phase II is a step by step characterization of the material progressive evolution up to state B. Moreover, the measurements are reproducible for the stress level omax =440 MPa.
Phase IV: a reproducibility test of the dissipated energy measurements during Phase III has been performed immediately after Phase III. Once again, the dissipated energy measurements prove to be well reproducible on the same specimen (Figure 3, Phase IV).
Phase V and VI: In [15], Lazan reported that materials damping could be affected by a recovery period. Phases V and VI have thus been performed on the same specimen after a one month recovery period at ambient temperature. The dissipative energy results will be described later in this paper.
The dissipated energy per cycle E^ depends here on the alternate stress oa and thus on the input mechanical work per cycle.
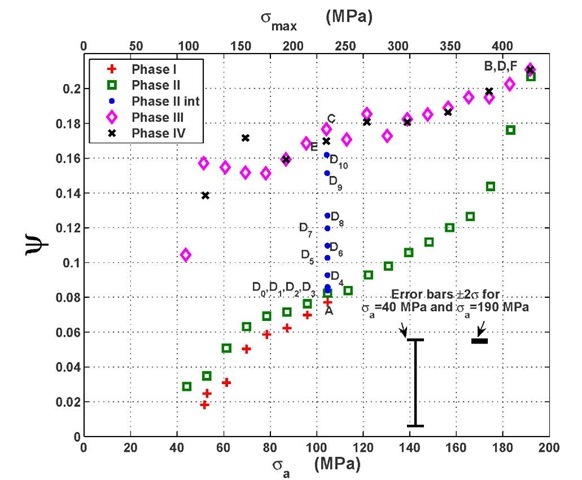
These results can be further analyzed by computing the specific damping capacity y. As the tests have been performed in the elastic hysteretic domain), the specific damping capacityycan be written as:
where E is the Young’s modulus. During traction-compression test (R0=-1), W represents the maximum work given to the material during one cycle. This definition has been kept in this work even if the loading ratio is here R0 = 0.1.
The results presented as specific damping capacity y in figure 4 are thus the same data as presented in figure 3 but on a scale which emphasizes the data for low alternate stress oa. Moreover, as Em is known at ±100 J.m^.cycle"1, equation (2) has also been used to compute the measurement error-bars depending on the alternate stress amplitude oa.
The specific damping capacity results (figure 4) underline that whichever phase is considered, the specific damping capacity y increases with the alternate stress amplitude Oa and is not constant: the dissipated energy per cycle Em is not simply proportional to Oa2. The fact that the proportion of dissipated energy per received mechanical work increases with the alternate stress can be interpreted as an increase of the dislocation mobility, either through an improved mobility per dislocation or an increase of mobile dislocation density [6]. The variations of the specific damping capacity y with the alternate stress could be used as a non destructive indicator of the material microstructure evolution.
Fig. 3 DP600: dissipated energy per cycle![]() (left scale) and equivalent heat rate
(left scale) and equivalent heat rate![]() (right scale) versus alternate stress (bottom scale) or maximal stress (top scale).
(right scale) versus alternate stress (bottom scale) or maximal stress (top scale).![]()
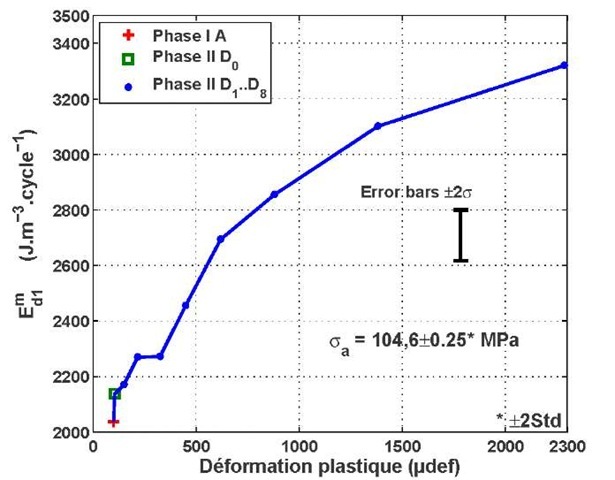
It is also possible to analyze the variations of dissipative energy per cycle E^ measured during Phase II (D2..D8) with the cumulated plastic strain ep (figure 5). The dissipative energies per cycle E^ of this graph have all been measured with the same experimental settings (oa = 104.6 ±0.25 MPa, R0=0.1, etc.). The only difference from one test to another is thus the material microstructure modification due to cold work. Figure 5 presents thus in a different way that the dissipative energy Em increases with the plastic strain. It is yet worth noting that the increase rate of the dissipative energy is greater for d1 small plastic cumulated strain.
Fig. 5 Dissipative energies per cycle![]() versus cumulated plastic strain
versus cumulated plastic strain![]()
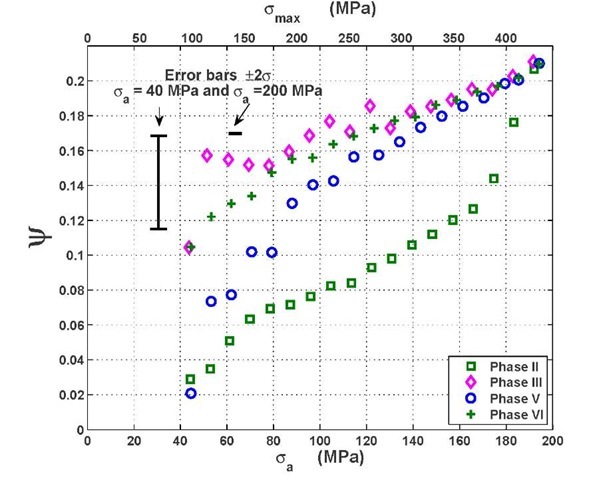
Eventually, the influence of ambient temperature recovery period on the dissipated energy behaviour has been tested during Phases V and VI. The experimental results have been plotted directly as specific damping capacity yin Figure 6.
Phase V : this test sequence has been performed on the same specimen after a one month recovery period at ambient temperature (figure 2, upper graph). The specific damping capacity y during the first levels of Phase V is comparable to the phase-shift of the material in its initial state at the first levels of Phase II (figure 6) and is lower than the specific damping capacity y measured one month before during Phase III (state B, figure 2). This specific damping capacity y then quickly increases with the alternate stress amplitude Oa to reach its previous value during Phase III. The one month recovery period thus affected the dissipated energy behaviour but did not totally erase the effect of the previous test sequences.
Phase VI: this test is performed just after Phase V. The measured specific damping capacity y overlaps with the results obtained during Phase III; Phase V totally erased the recovery period effect.
These results underlines thus that the thermomechanical behaviour of the DP600 depends both on the loading sequences and on the recovery periods. The proposed experimental method to measure the dissipated energy is sensitive enough to observe such effects.
CONCLUSION
The dissipative energy due to internal friction of a dual phase steel evolution with the plastic strain has been measured. First, it clearly appeared that the dissipative energy due to internal friction increases with the plastic strain. When no plastic strain occurs between two tests, the dissipative energy measurement is well reproducible on the same specimen. Thus, the dissipative energy variations versus the alternate stress in the viscoelastic domain could be used as a "signature" of the material.
Eventually, it has been underlined that the dissipative energy measurement method used in this work is sensitive enough to observe small changes in the material microstructure due, for example, to recovering periods. The dissipative energy measurement is thus a sensitive tool that could be used to monitor the material microstructure variations due to the loading history. The variations of the DP600 dissipative energy signature during fatigue tests will be studied in future works.
