IKONOS—San Diego/Coronado Island
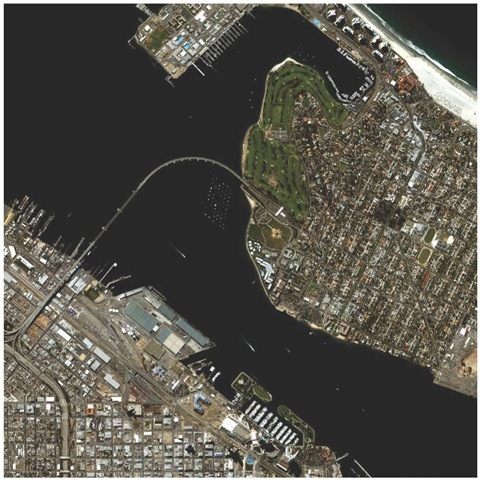
The launch of the IKONOS satellite in 1999 dramatically changed the world of remote sensing. For the first time, imagery comparable to that obtained from military systems was widely available to civilians. IKONOS offers 1-m-spatial-resolution panchromatic imagery, and 4-m-resolution multispectral (color) imagery. Shown in Fig. 1.17 is a color image of San Diego taken on November 17, 1999. The Coronado Bridge, heretofore a rather tenuous, thin line, is now clearly defined, as are the many small watercraft in the harbor. Direct comparison with earlier systems is a bit hard; not only does the modern system have higher bandwidth, it has the ability to look off-nadir (sideways), thus dramatically improving revisit time. IKONOS can image any spot on Earth at 1-m resolution at 3-day intervals. Of course, the whole scene is only 10 km on a side, so there is still a conflict between area coverage and resolution.
Figure 1.16 San Diego Harbor, IRS image.
See if you can locate the Hotel Del Coronado with its red-tile roof and "Coronado" written in the sand.
Figure 1.17 Coronado Island, San Diego, California, IKONOS.
High-resolution airborne imagery
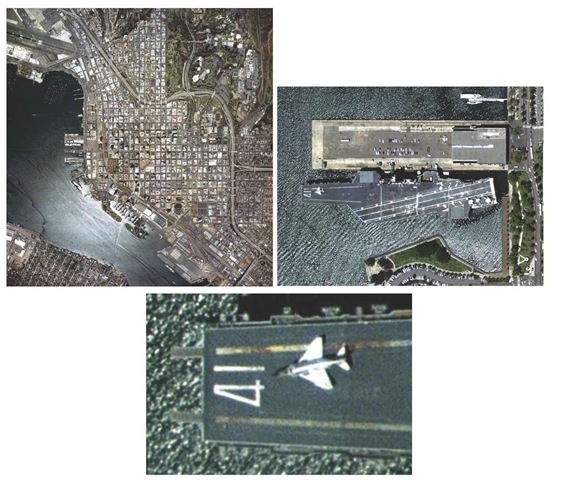
Still higher resolution is possible, primarily from airborne platforms. In the last few years, electronic cameras have begun to replace film cameras, but the latter are still heavily used in the commercial imaging world. An illustration is shown here from a recent flight over San Diego Harbor. The resolution is better than 1 foot. Note the relatively large file size, a consequence of the relatively large area being imaged at high resolution.
Figure 1.18 Three successive images are shown from an aerial photograph taken over San Diego Harbor (2004). The figure at the top left is the full frame, the figure above (top right) is a small chip from the 21,000 x 21,000 pixel image scanned from the film image. A further zoomed-in view of the 1.3 gigabyte file is shown at bottom left. The resolution is between 6 and 12 inches. Note the glare on the water, and how the wind-driven water waves show from above. The carrier is the USS Midway, part of an exhibit at the San Diego Maritime Museum.
Infrared (IR)
The previous sections showed familiar visible imagery in a succession of resolutions. The remaining images illustrate some other important modalities in remote sensing—in particular, infrared imaging and radar. Infrared imagery differs from visible in two big ways: thermal IR works at night, and mid-wave infrared (MWIR) and long-wave infrared (LWIR) data allow for non-literal information—meaning, for example, that you can extract temperatures.
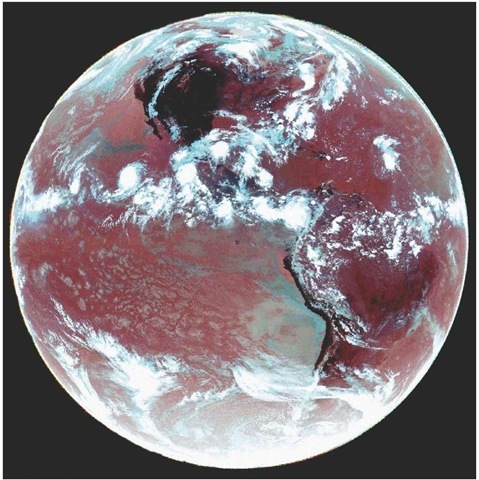
Figure 1.19 GOES infrared imagery, July 11, 1995, 1800 UTC. The cloud colors provide information about their height (which varies with temperature) and water content.
GOES 9
A companion figure to Fig. 1.9 is shown here in Fig. 1.19. Infrared images from the GOES weather satellite again show much of the western hemisphere. Wavelength bands 3.9, 11, and 12 microns (often abbreviated as ^m or simply are encoded as red, green, and blue. Note that per weather convention, the gray scales are inverted: cold is brighter, dark is hotter, so that cold clouds will appear white. This image was taken in daylight in the western hemisphere. The solid earth is hotter than the oceans during the day, thus appearing dark, particularly over the western United States. The drier western states, with less vegetation, are hotter than the eastern side of the country.
The Earth’s atmosphere decreases monotonically in temperature with altitude within the troposphere (the region with weather), and the cloud temperatures vary along with the ambient atmosphere. The character of infrared emission varies in wavelength with temperature, so the apparent color of the clouds in this presentation reflects cloud temperatures, and therefore height.
Landsat—IR San Diego
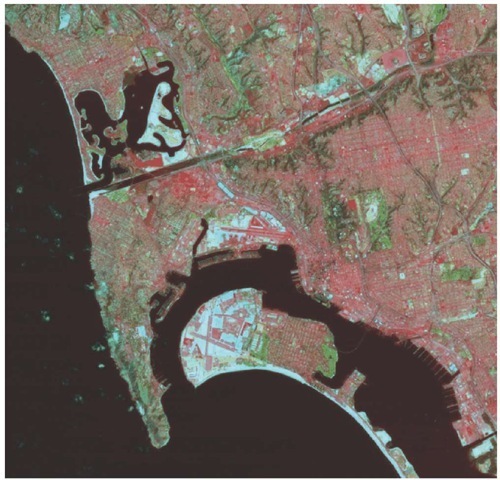
Reflective infrared and thermal infrared data from Landsat 5 (the same scene as in Fig. 1.12) are shown encoded as an RGB triple in Fig. 1.20. Note how the hot asphalt and city features are bright in the red (thermal) frequencies, while parks are green (cool, and highly reflective in shortwave IR).
Figure 1.20 Landsat image taken May 7, 1996 – infrared wavelengths (bands 6, 5, and 7). (Red: 11 pm, Green: 1.65 pm, Blue: 2.2 pm).
DMSP—IR and microwave
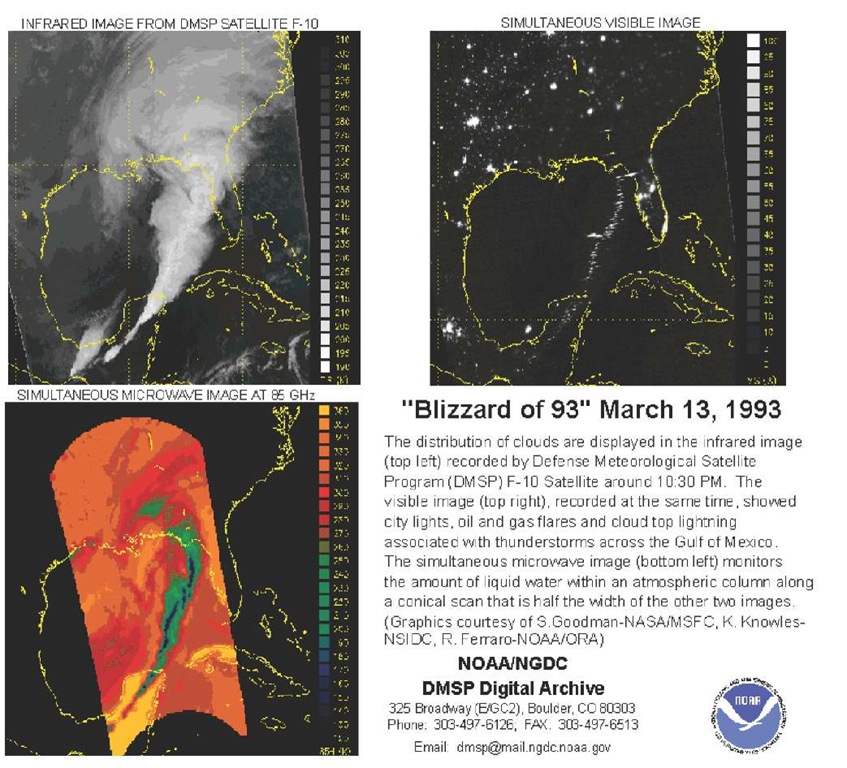
Imagery from the DMSP satellite was shown above in Fig. 1.10. DMSP also carries an infrared sensor, as illustrated below, and a sensor that measures microwave emissions that reflect moisture content in the atmosphere. Combined, these sensors provide a more complete weather picture than any one sensor.
The views in Fig. 1.21 are complementary. The infrared image (top left) shows the clouds (again, white is coded as cooler, dark as warmer). The low-light image at upper right shows city lights to the northwest and a line of lightning extending from Florida towards the Yucatan Peninsula. The microwave data shown at lower left reflect water content in the clouds.
Figure 1.21 DMSP: Visible, infrared, and microwave wavelengths. Microwave wavelengths are also emitted by thermal or blackbody radiators. Here, the 85 GHz band (0.3 cm) gives additional information on atmospheric water content.
Radar (SAR)
The third major remote sensing modality is radar. Radar sensors offer a day or night, all-weather capability that is important not only to the military, but to much of the civilian world. Tropical regions, in particular, are often clouded over, and earth resources work in those areas is difficult to conduct with systems like Landsat. Three civilian radar systems are currently in operation, the Canadian Radarsat-1, the European satellite (ERS-2), and the recently launched Japanese mission, ALOS. NASA flew the Shuttle Imaging Radar-C (SIR-C) as an imaging mission twice (and then a third time as the topographic-mapping mission).
RADARSAT, Maui and the airport
Canada launched RADARSAT on November 4, 1995. The spacecraft is equipped with a C-band (5.6 cm), HH polarization, synthetic-aperture radar (SAR) capable of acquiring reasonably high-resolution images (nominally 25 m, but ranging from 8-100 m, depending on mode). The images have a swath width in the 50-500 km range, again depending on mode.
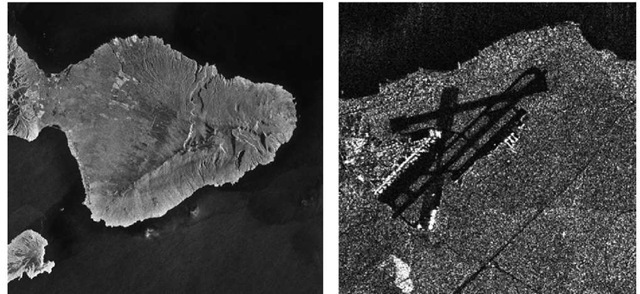
The SAR data look substantially different at high resolution, which bothers some people. Figure 1.22 is an image of Maui. The full scene at left looks some- what like a regular optical image, but the enlarged figure at right reveals the speckled nature of most SAR imagery.
Figure 1.22 RADARSAT image of Maui, Hawaii.
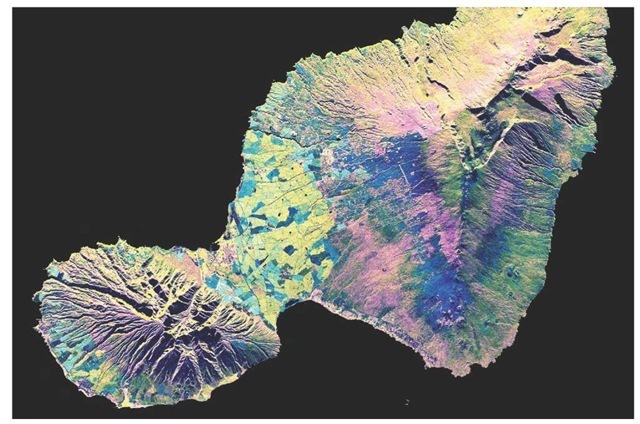
Figure 1.23 SIR-C image of Maui. This image was acquired by Spaceborne Imaging Radar-C/X-Band Synthetic Aperture Radar (SIR-C/X-SAR) aboard the space shuttle Endeavour on April 16,1994. The image is 73.7 km by 48.7 km (45.7 miles by 30.2 miles) and is centered at 20.8° north latitude, 156.4° west longitude. North is toward the upper left. The colors are assigned to different radar frequencies and polarizations of the radar as follows: Red is L-band, horizontally transmitted and received. Green is C-band, horizontally transmitted and received.25 Blue is the difference of the C-band and L-band channels.
Note that the airfield on Maui is black, because the runways are very smooth compared to the wavelength of the radar—the radar’s energy bounces away from the satellite rather than return. The levels of gray in the water of the left image indicate differing wind speeds on the surface, which cause variations in the scattering coefficient of the water. The prevailing winds from the southwest cast a wind shadow in the lees of the islands.
The brightness of the water depends on the amplitude of small wind-driven capillary waves. Wind speed and direction can be derived from SAR imagery—wind speeds within ~ 2 m/s of true wind speed, and 30-40° of true wind direction.26
SIRC—Multi-wavelength/polarization
Maui
Radarsat and ERS are limited to single wavelengths. By contrast, the SIR-C mission carried multi-wavelength, multi-polarization capability. A scene similar to the RADARSAT view above is shown here for Maui, Hawaii. Resolution is similar to that of RADARSAT.
Figure 1.23 shows the results from imaging at different radar wavelengths. Radar is very sensitive to surface roughness, on the scale of the radar wavelengths—here 6 cm and 24 cm for the C and L bands, respectively. The light blue and yellow areas in the lowlands near the center are sugarcane fields. Differences in the vegetation cover on the middle flanks of East Maui can also be identified. Rain forests appear in yellow, while grassland is shown in dark green, pink, and blue.
West Maui Volcano, on the lower left, is 1800 m high (5900 ft), and considered extinct. The entire eastern half of the island consists of East Maui Volcano, which rises to 3200 m (10,500 ft) and features a spectacular crater, Haleakala, at its summit. East Maui Volcano’s most recent eruption took place near the coast at the southwestern end of the volcano in the late 1700s. The different lava types (and ages), are partly revealed by variations in radar response.
SIRC, San Diego Harbor
To conclude, San Diego is again presented. Fig. 1.24(a) shows a full SIR-C image scene; Fig. 1.24(b) shows a subset of the image for comparison with the visible and infrared images above.
Burned areas in the center of Fig. 1.24(a) are dark, and the vegetated areas to the east of San Diego are greenish. In Fig. 1.24(b), the Coronado Bridge shows up rather well, bright against the dark water. Shelter Island, a sandspit in Mission Bay, almost disappears because the damp sand absorbs radar imagery [compare with Figs. 1.15(b) and 1.20].

