This topic contains an account of the processes applied to the raw scans, after the observations were completed, to transform them into a set of corrected spectra, suitable for the extraction of parameters to compare with theory, together with some preliminary observations on the data.
I describe here the absolute calibration of intensity, and the manner in which the scale and datum position for wavelengths were determined, and how the scans were corrected for various imperfections, interferences and systematic errors. The unexpected discovery of Magnesium I emission is discussed, along with its effect on the interpretation of the data for radial velocity determinations. A system of averaging the fully corrected absorption line scans, grouped according to position in the ecliptic, is described, together with various attempts to fit curves to the experimental points. The method of extracting parameters from the finally chosen Gaussian fits is detailed.
Intensity calibration
Method and calculations
The source used for intensity calibration is described in topic 2. The energy input to the interferometer is calculated as follows.
The National Physical Laboratory supplies tables (Jones 1970) of Q(X), the radiant spectral intensity of a tungsten source at colour temperature Tc °Kinside a glass envelope. The value I have used in the calculations is a compromise between this figure and that appropriate to a black body, since for a coiled element the inside parts behave like a black body.
The energy per unit wavelength interval radiated by the lamp is given in the tables as:
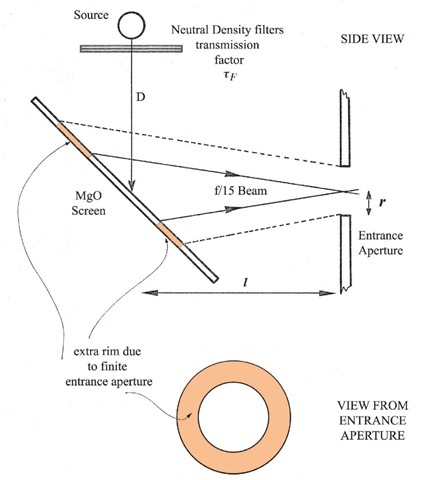
Figure 3.1 Photometry of intensity calibration.
Hence the spectral irradiance on the MgO (Magnesium Oxide) screen, placed at an angle of 45 degrees, at a distance of D cm, modified by the transmission factor tf of the filters is (referring to Figure 3.1)
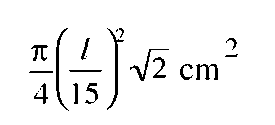
The entrance aperture accepts an f/15 beam, so a small aperture would ‘see’ on the diffusing plate, an elliptical shape, of area
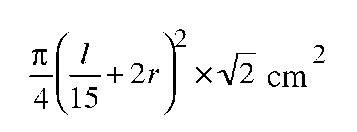
where l is the distance of the screen from the entrance aperture. However the area actually seen is much larger than this because the entrance aperture has a finite radius r cm, so the projected shape has an extra rim of width r cm (Figure 3.1). The total area seen is
Emission from such a screen (assumed non-absorbing) at an angle 9 to the normal has an intensity per solid angle![]() where E is the total incident intensity, and ro is the solid angle, in this case, that subtended by the entrance aperture at the screen, which is
where E is the total incident intensity, and ro is the solid angle, in this case, that subtended by the entrance aperture at the screen, which is![]() Thus the total flux received by the F-P is
Thus the total flux received by the F-P is
For a given finesse, a given photon counting rate represents a definite flux per unit wavelength range. A scan of the calibration source gives a measured Ncal counts per second at the filter. If the filter shape is normalised to unity maximum for the purpose of dividing it out from the scans, for any filter-corrected count per second N measured from the sky, the corresponding energy per unit wavelength range is (now more conveniently expressed per Angstrom):
This represents the flux from one square degree of sky received by a six-inch diameter aperture at the bottom of the atmosphere.
In practice there was some noise on the calibration scan, so it was divided by the filter transmission, point by point, using a noiseless filter profile, and an average corrected count was found for the nominal 50-second integration time.
Putting in the instrumental parameters, experimental values, and those supplied by the NPL, for the narrow region around 5183.6 A, the value of W arrived at was
This may be conveniently expressed in photons. The energy E of a photon of frequency V is given by E = hv, where h, Planck’s constant, is approximately
From the wave equation,
where c is the speed of light, approximately 2.9979x 10 m/sec, and A is in this case 5183.6A, or 5183.6 x 10-10 m.
Thus the number of photons represented by W is
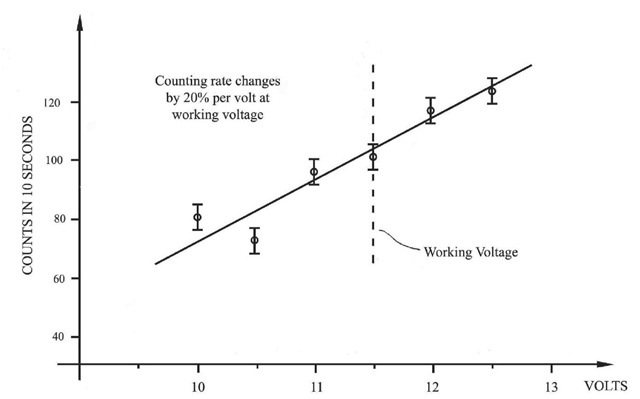
Figure 3.2 Experimental graph of counting rate against voltage across bulb for the intensity calibration set-up.
Hence 1 count represents 4640 photons/A ………. (3.2)
It is sometimes useful to know how many photons are arriving in total for a given count rate. The equivalent width of the F-P pass-band was typically 1.5 A, so
1 count represents 6960 photons ………. (3.3)
Accuracy of intensity calibration
Figure 3.2 shows a graph of counting rates measured in the laboratory using the lamp at different voltages. An uncertainty in the AVO meter reading of 0.1 volts produces an uncertainty in counting rate of only 2 per cent. The National Physical Laboratory’s calibration was to an accuracy of 2 per cent also, so the overall accuracy is limited only by photon shot-noise, small temperature fluctuations of the lamp, geometrical uncertainties and the estimation of the transmission of the coelostat. For sources outside the atmosphere, extinction losses also contribute to the uncertainty. The final calibration is believed to be accurate to a factor of 4.
Wavelength calibration
The aim of wavelength calibration is to assign a true wavelength to every programmed pressure point found by the pressure controller. Since in our case each programmed point corresponded to the positioning of a rotating arm illuminating a particular pea-lamp (see Hindle and Reay 1967), the programmed point scale is referred to by ‘lamp number’, L. The calibration involves (a) determination of the unshifted MgI 5183.62 A position for each scan and (b) determination of the separation of this line and the Zinc 5181.99 A line in terms of ‘lamp number’. From this can be calculated the wavelength interval between each programmed point (in ‘angstroms per lamp’). We will see that this quantity ^^dlL may vary slightly with lamp number itself, because of the non-linearity of the pressure controller.
Determination of the datum line position
For the purpose of determining the 5183 A position, celestial sources (planets, Moon) were considered unsuitable because of their lack of availability near the time of a scan, and the difficulty of evenly illuminating the entrance aperture from a small source on the sky. Instead a Magnesium lamp was used. Because of the slight drift of the etalon over the period of a scan, the lamp was scanned immediately before and after each scan, and the datum line position was determined as the mean value of the two measurements.
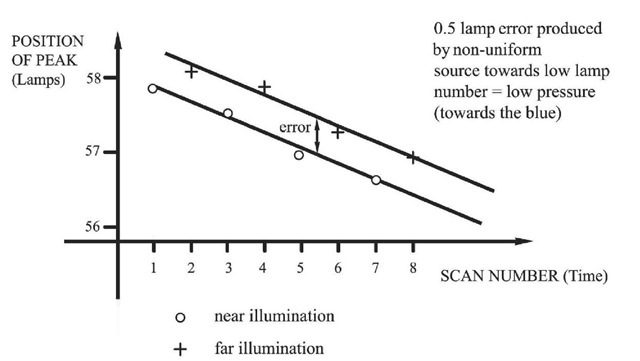
Some early calibrations were done using a stack of diffusers illuminated quite closely by the lamp. At the time, the arrangement was considered adequate, but soon it was suspected that the illumination of the diffuser was slightly greater at the centre than at the edges. To test if this was so, scans of this source were compared with scans of the same lamp using the more evenly illuminated diffuser described in topic 2. The test involved measurement of a differential of only about half a ‘lamp’ in a situation where the drift of the peak from scan to scan and even during one scan was of the same order. A ‘dynamic’ method was adopted, in which the drift and the differential could be easily identified, and measured separately. The technique was to align the etalon, and then make a number of scans alternately using the two configurations, without realignment. A typical result is shown (Figure 3.3), plotted as a function of time.
Figure 3.3 The drift method applied to determination of error due to non-uniform illumination of entrance aperture.
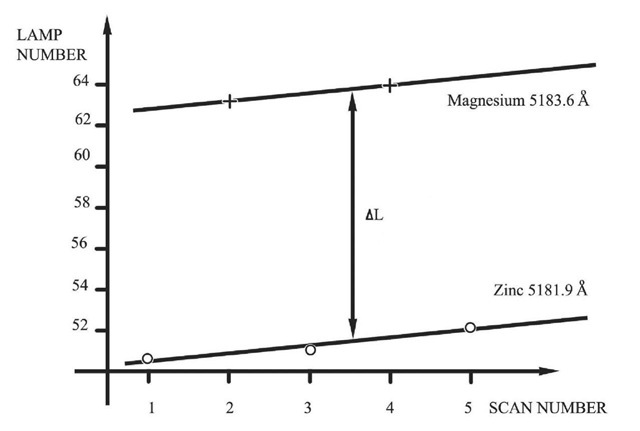
Figure 3.4 Determination of the separation of the two calibration emission lines using the drift method.
Lines joining successive determinations of any one configuration clearly show the drift of the etalon. The separation of the two lines at any time gives an accurate measure of the error in the old configuration, which was found indeed to be 0.5 lamps, to the blue, as would be expected. This correction was applied to the early calibrations, and all subsequent calibrations were performed using the new uniform diffuser for illumination.
Establishment of wavelength scale
The separation in lamp number of the MgI and Zn lines AL was found by a similar method – i.e. scanning the two lamps alternately as long as the finesse stayed good; the positions of the peaks were plotted against time, and the separation at an instant measured from the graph (Figure 3.4).
In this case the two lines appear at different wavelength positions under the filter profile and it would seem at first sight that the filter should be divided out to give the true positions. However the shape of the maxima is entirely instrumental in origin, and arises from a line of virtually zero width, so the shape of the filter profile could have no effect on the position of the peak. Strictly speaking it is only correct to divide out the filter after deconvolving the instrumental function from the spectrum. In the case of a monochromatic source this reduces the spectrum to a line. However the sky spectra under study contain no important narrow features, so the filter division process is valid for these.
With all corrections made, the values of AL were plotted against the position in lamp number of the Zn line (Figure 3.5), which varied depending on how the etalon was aligned at the time.
A linear relationship between lamp number and pressure would give simply the straight line AL = constant, but experimentally this was not found to be the case, indicating a non-linearity in the pressure controller.
Figure 3.5 Experimental graph of separation of Zinc and Magnesium lamps, as position of Zn peak is varied.
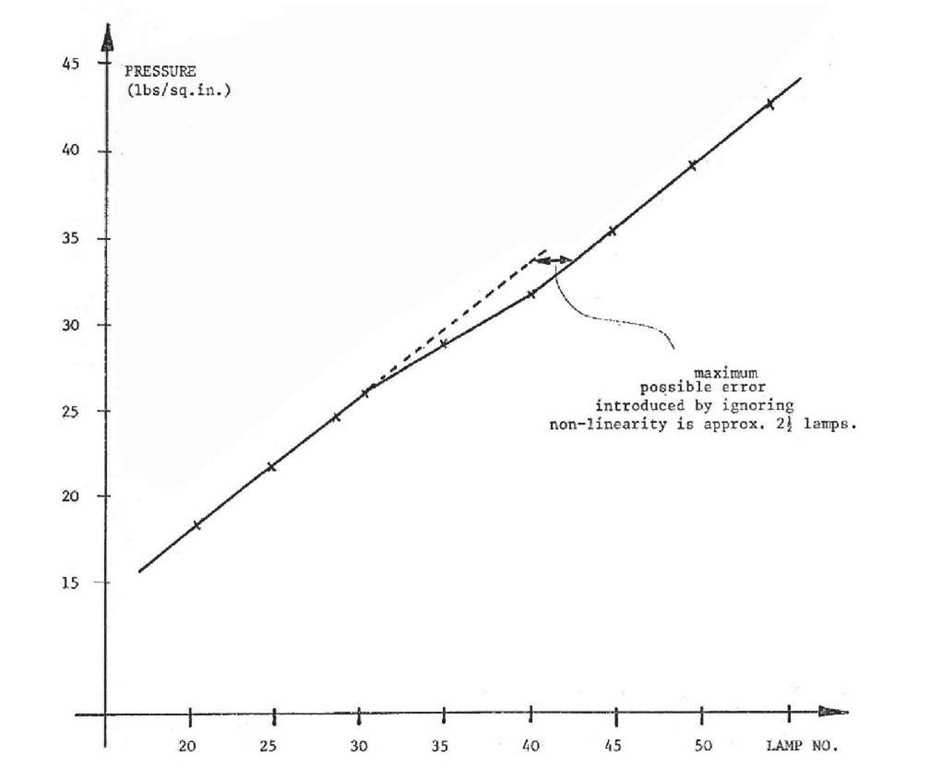
A check was made on readings of the Bourdon pressure gauge for each programmed point and a non-linearity was confirmed (Figure 3.6). For one section of its movement, the controller gave less pressure variation per lamp than expected – around LZn = 20.
The part least affected was around so this was chosen for future sky scans, and is a convenient point to evaluate
![]() in terms of wavelength.
in terms of wavelength.
For LZn _ 40.5, the measured value of![]() was 12.9 lamps. Referring to the pressure/lamps graph (Figure 3.6), at
was 12.9 lamps. Referring to the pressure/lamps graph (Figure 3.6), at![]() of 12.9 corresponds to a pressure difference of 10.0 lbs per square inch.
of 12.9 corresponds to a pressure difference of 10.0 lbs per square inch.
It is this pressure difference which is a constant for a given wavelength interval, so going back to Figure 3.6, we can predict what![]() will be for any position of the Zn line. The curve so obtained is shown dotted in Figure 3.5 a good fit to the experimental data. Thus a value of
will be for any position of the Zn line. The curve so obtained is shown dotted in Figure 3.5 a good fit to the experimental data. Thus a value of can be confidently adopted for each position on the scale of lamps. The values adopted were:
Figure 3.6 Experimental variation of pressure as measured by Bourdon gauge against pressure controller position in lamp number.
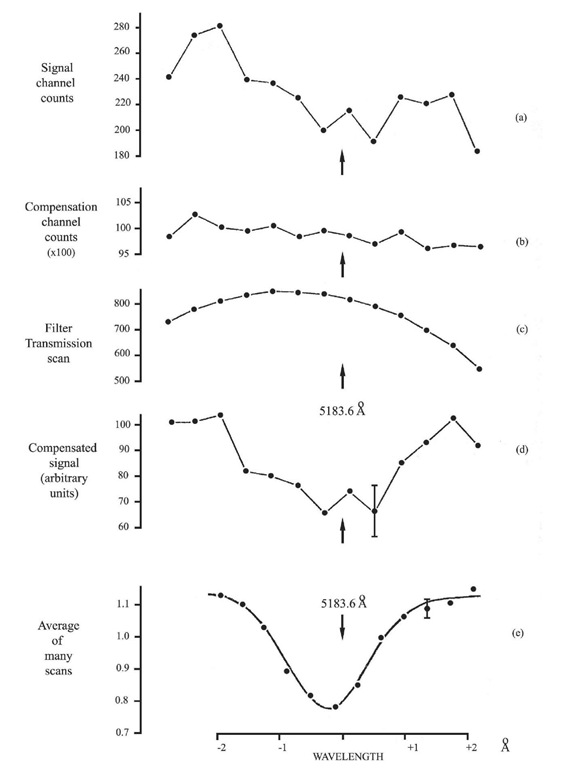
Figure 3.7 Illustrating the treatment of the data.
Hence a wavelength scale was established for all scans. The accuracy of the scale is the accuracy to which the dotted curve in Figure 3.5 can be fitted to the experimental points – i.e. about 0.6 lamps, corresponding to between 0.06 and 0.8 A. The overall accuracy of the position of features in the final corrected spectra is dealt with in section 4.4.
