This topic details the preparations for making the radial velocity measurements, and the manner in which observations were actually performed. It includes the choice of wavelength and resolving power, the site, the building of the observatory, and the construction of the Fabry-Perot Interference Spectrometer – its optics, control electronics, counting electronics, calibration equipment, and information output devices. The optimisation of the instrument is then described, and finally the techniques of operation are detailed, in the two observing periods during which my data were collected. In the following sections it should be noted that I inherited a system used in the experiments of Reay and Ring, but it soon became apparent that this was subject to inherent shortcomings and unreliabilities, and in any case needed substantial changes to operate at a new wavelength in a new, purpose-built observatory. My first year of work on the PhD was spent in redesigning and rebuilding the optics and electronics for an essentially new Fabry-Perot system, featuring a number of important improvements, which will become apparent below.
Choice of wavelength for the observations
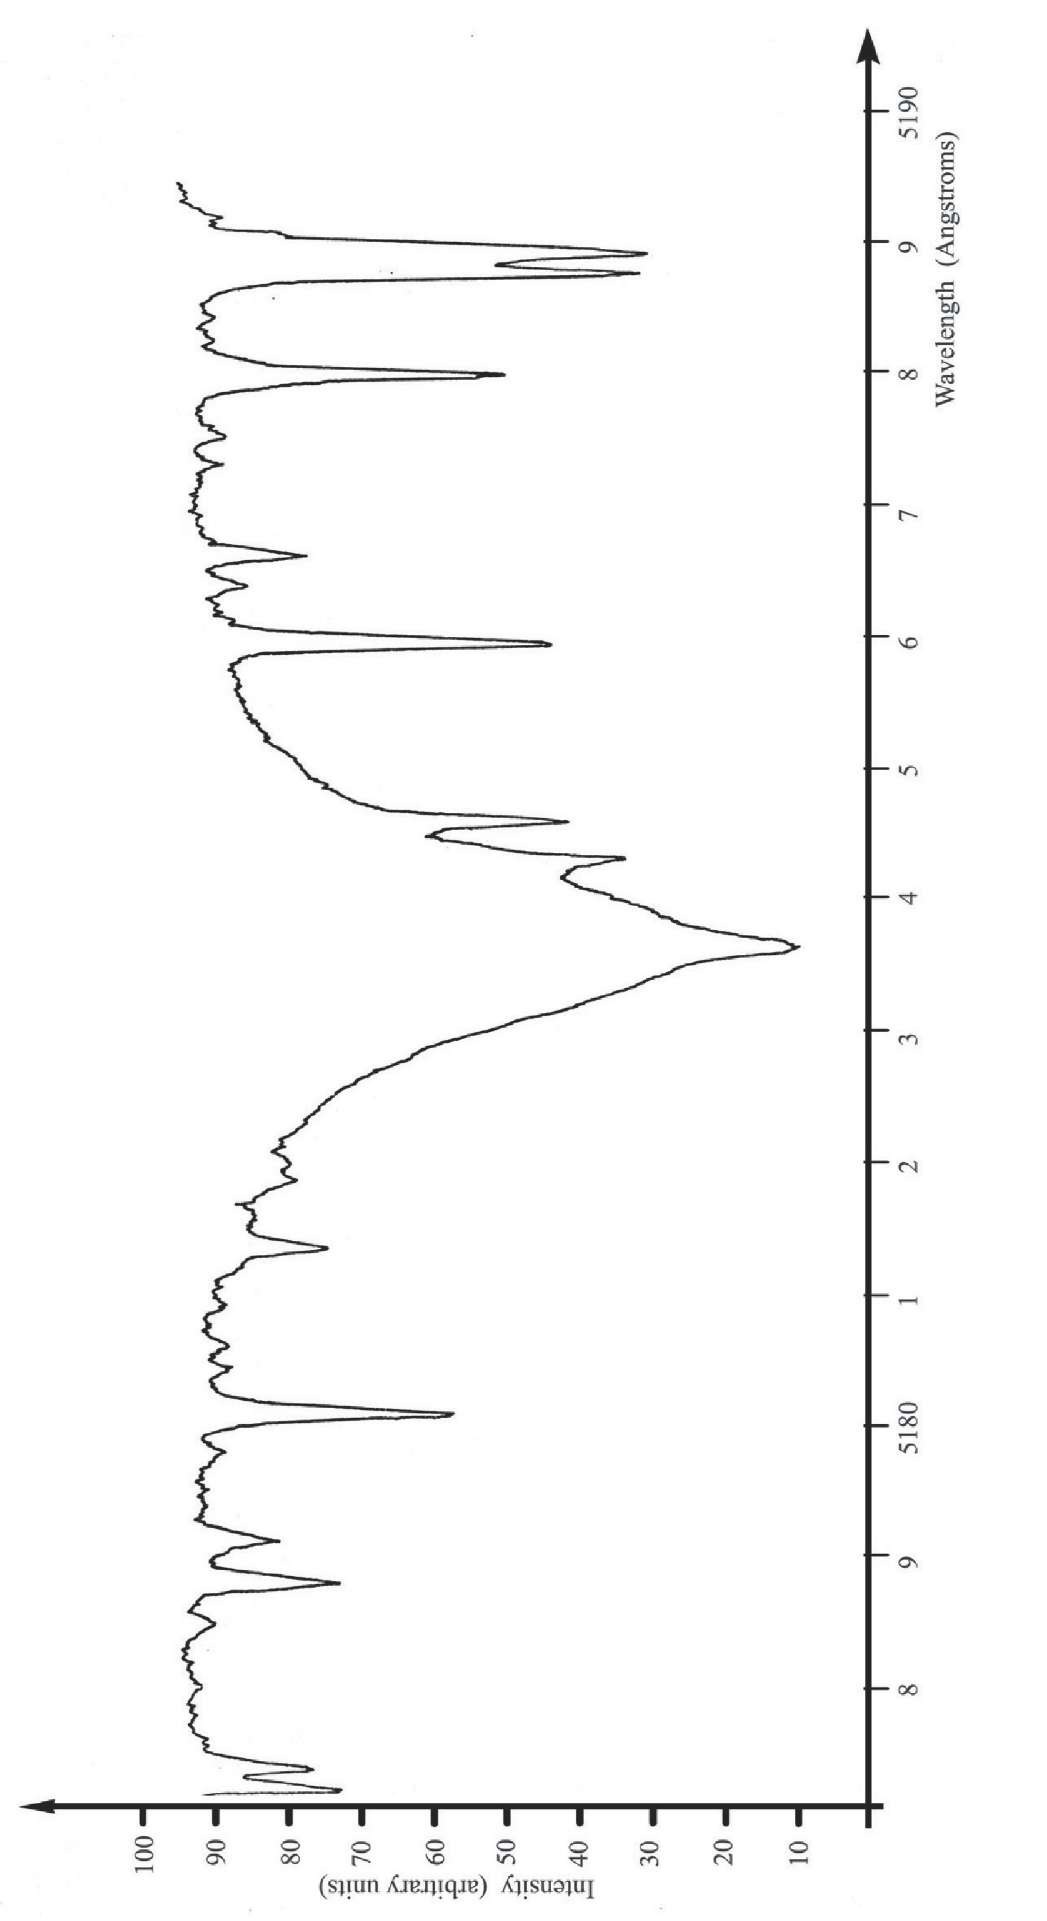
Radial velocity measurements using the Hp region of the spectrum had proved difficult, owing to the presence of high rates of Hp emission (Hindle et al 1968), so I chose to study a different region: the Fraunhofer line at 5183.6 A, present in the Sun’s spectrum because of absorption by relatively cool Magnesium ions in the reversal layer. The profile of this line in pure, unshifted sunlight is shown in Figure 2.1. The hope was that this line, which is deep and relatively free from parasitic absorption by other lines in the Sun’s spectrum, would NOT be present in emission in the spectrum of the ZL.
Choice of resolving power
This choice had been the result of much previous debate (Reay 1968; Smeethe 1970) which will not be repeated here. However, the outcome may be summarised by noting that if the resolving power of the instrument is too low, the depth of the line is underestimated, and the exact position of the minimum point becomes inaccurate; and if the resolving power is too great, the throughput of the instrument with such a narrow profile becomes so small that very low light levels have to be measured.
Figure 2.1 The solar spectrum in the region MgI 5183.6 A Fraunhofer line, at about 1/50th A resolution.
In this case, since only small numbers of individual photons are being counted, photon shot noise becomes dominant, and measurements of the shift in position of the minimum point of the line again become inaccurate. The optimum resolution is thus somewhere between these extremes.
A resolved width of one and a half A was decided upon in this case, since this gave enough resolution to ‘see’ a well-defined absorption line, and at the same time allowed enough light through to give adequate signal-to-noise in the counting rates. It may seem strange to be making measurements on a line only about an angstrom wide with such a wide instrumental profile, but the choice for optimum resolved width has to be made based on the information sought, and the method used to elicit it. My data reduction methods are detailed in topic 3, and it will be seen that, processed in this way, the accuracy of the results is quite insensitive to resolving power.
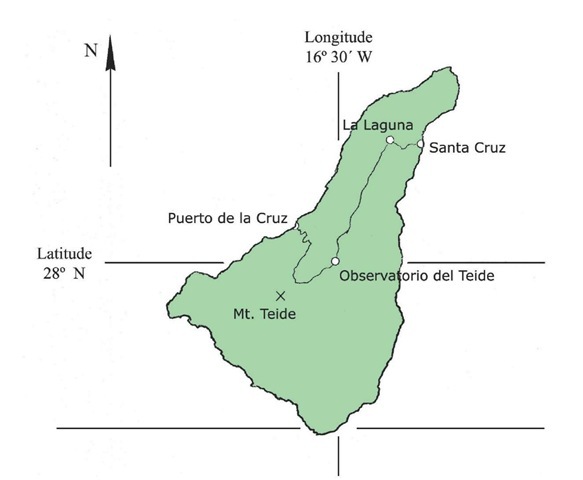
Figure 2.2 Location of the observatory on the island of Tenerife.
The site
The Testa Grigia observatory (in the perennial snow above Cervinia, Italy) having been abandoned as unusable owing to unpredictable weather, an excellent site for ZL observations was offered to us by Prof. Francisco Sanchez of the Universidad de la Laguna, at the (then) newly founded Observatorio del Teide at Izana, situated at an altitude of 7,700 feet on a volcanic ridge in Tenerife, in the Canary Islands.
The weather conditions of Tenerife are dominated by the Trade Winds and its huge central dormant volcanic peak, known as El Teide. For much of the year, conditions are stable enough to produce an almost permanent inversion layer at a level well below the site of the observatory. The resulting view from Izana is, more often than not, a beautiful "Sea of Clouds" below, with only occasional Cirrus clouds above. ‘Seeing’ is usually very good, as first ascertained in 1853 by Charles Piazzi Smythe on his famous expedition for site testing, and the only things which can interfere with good observations are dust in the air (locally known as ‘Kalima’), blown in from the Sahara desert when the prevailing winds are strong enough in a particular direction, moonlight, and latterly some light pollution from the ever-growing English and German ‘ghetto’ of Playa de Las Americas in the South of the island, along with some new resorts being built along the South-East coast. In 1973, in our own experience, the Izana skies were clear for about 70 per cent of the time. The site is high enough, and of suitably low latitude (28 degrees North) for the Zodiacal Light to be favourably positioned most of the time, in a good, dark sky in both morning and evening, allowing observations to be made at quite low elongations from the Sun.
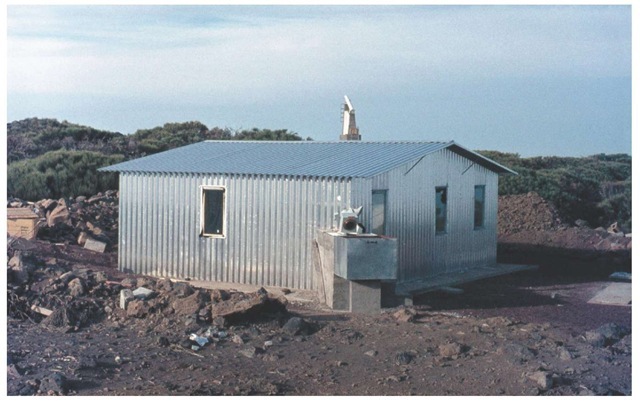
Figure 2.3 The hut viewed from the South, with coelostat assembly in open position.
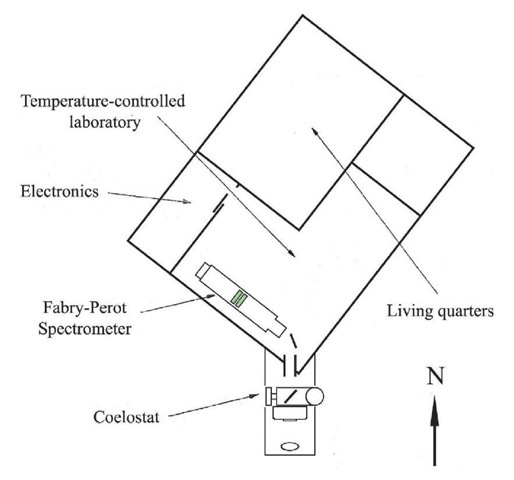
Figure 2.4 Layout of the ZL building and coelostat.
At various different times of the year, both the morning and evening Zodiacal cones stand almost perpendicular to the horizon. The observatory also had, and has, the advantage of being accessible directly by road from Santa Cruz and La Laguna, both less than an hour away. We were frequently able to observe the ZL with the naked eye, a conspicuous and splendid sight, comparable in brightness with the Milky Way. On nights of exceptional transparency the whole Zodiacal Band could be traced by eye as an extension of the morning and evening cones, a continuous faint band of light around the ecliptic, with a distinct brightening frequently discernible at the antisolar point, rendering the Gegenschein an unmistakeable though faint feature around midnight.
The ZL building
At the time of commencement of my experiment, the Observatorio del Teide consisted of just one Spanish ‘hut’, actually quite well appointed, built to facilitate ZL experiments mounted by the Universidad de La Laguna. It was decided to build a new hut to house the Imperial College observations. In collaboration with Professor Ring and Professor Sanchez, I designed and supervised (mainly from a distance, with the help of Carlos Sanchez on site) the building of a new ‘Coseley’ English hut to house our experiment (Figure 2.3). The building was modular, and specifically tailored for the ZL work, with a rudimentary living space, a thermally insulated laboratory, and a control and electronics room. The building was designed to withstand winds of up to 90 miles per hour, a necessary requirement for survival in Izana in the Winter months. The ZL Building was situated and oriented to give optimum sky coverage to East, South, and West, with a two-mirror coelostat mounted at the South corner as shown in Figure 2.4.
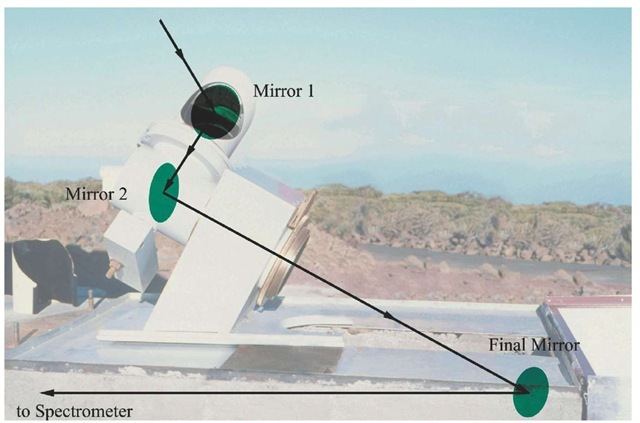
Figure 2.5a The coelostat, set on concrete plinth, showing positions of its mirrors.
Figure 2.5b Showing the path of light through the instrument into the hut.
Instrumental details
The coelostat, and sky area accessible
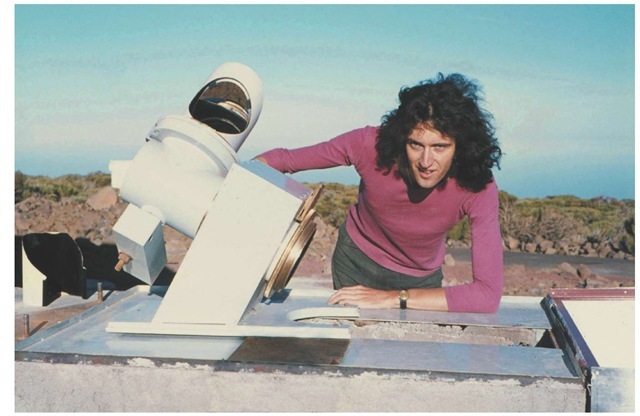
Our interferometer was highly sensitive to movement, and it would have been impractical to attach it to a moving telescope. So instead the device of a coelostat was used, a kind of adjustable periscope containing two 6-inch aperture mirrors, to channel light from any chosen area of the sky into the Fabry-Perot instrument, which remained static inside the hut.
The coelostat mount was equatorial; Declination and RA could be manually set to areas on the celestial sphere, pre-chosen to be free from obvious contamination by bright stars, the Galactic plane or nebulosity. The field of view was approximately one degree – and the sidereal drift over the length of our scans dictated that the instrument produced spectra from areas measuring about one degree by three degrees.
The coelostat was mounted on a concrete plinth (see Figure 2.5a) with a channel in the top, forming a square section tube leading into the hut at a height of about four feet. A cover was put on the outer end of the tube, hinged so as to be able to be swung aside, providing access for lining up. In the tube was an optical bench assembly supporting a third (final) mirror to direct light from the coelostat in a horizontal beam into the laboratory, and the final f/17 lens of the coelostat, both with kinematic mounts, to facilitate lining up (Figure 2.5b). The whole coelostat was equipped with a metal weather-proof housing, attached by means of a hinge, so it could be easily swung clear for observing.
An oblique mirror in the laboratory directed the incoming beam from the coelostat on to the entrance aperture of a gas-pressure scanned Fabry-Perot interferometer. The mirror was rigidly attached via a kinematic mount to the interferometer itself.
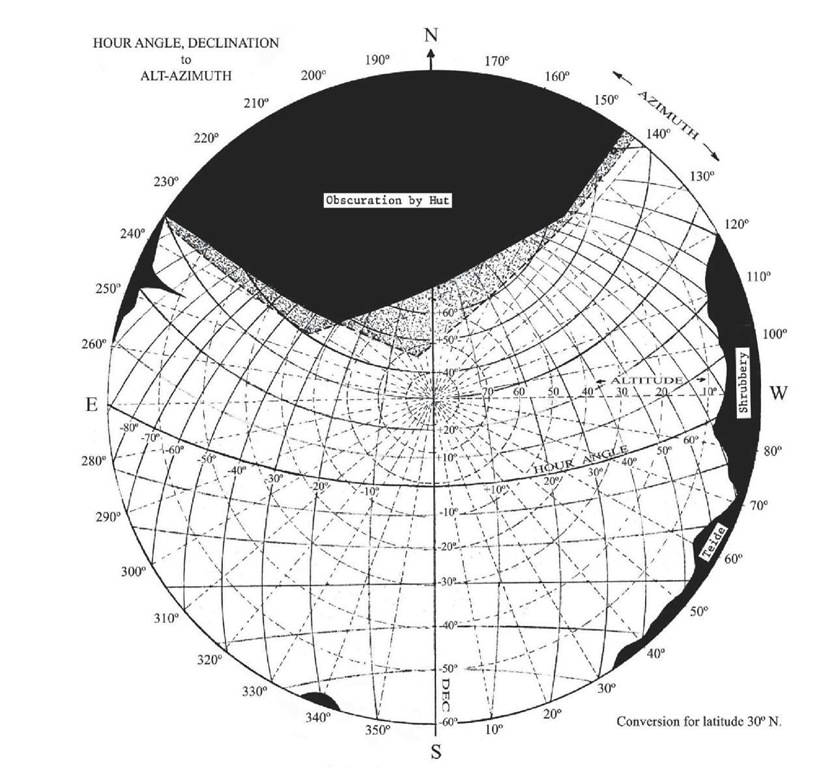
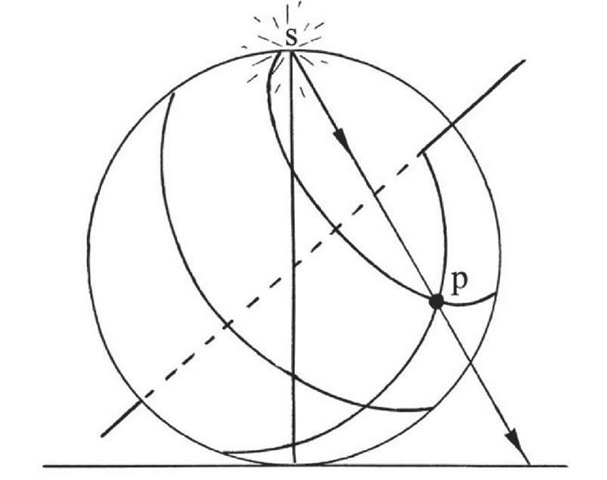
The resulting sky area accessible to our instrument is shown in Figure 2.6a (overleaf), and shows a superb horizon from East to South, especially favourable to good observations of the morning ZL, which had been less well covered by previous experiments. Accessibility to the entire visible length of the Zodiac at any time was excellent. In the diagram the effective horizon is drawn on a projection of the sky, marked with two different co-ordinate grid systems: Altitude/Azimuth, and Hour Angle/ Declination. This diagram is a smaller version of a chart I constructed to make quick conversions between the two coordinate systems on site. Such a "Stereographic" projection of a spherical surface is constructed by placing a plane surface to touch one point of the sphere, and a point source of light at the exact opposite point on the sphere; the shadows formed on the plane surface form the projection (Figure 2.6b). This projection is convenient for accurate geometrical work because it has the property that all circles on the sphere are represented by circles on the plane surface.
Figure 2.6a Sky accessible from coelostat marked on a coordinate conversion chart.
Figure 2.6b Illustrating the stereographic projection.
The Fabry-Perot Interferometer (F-P)
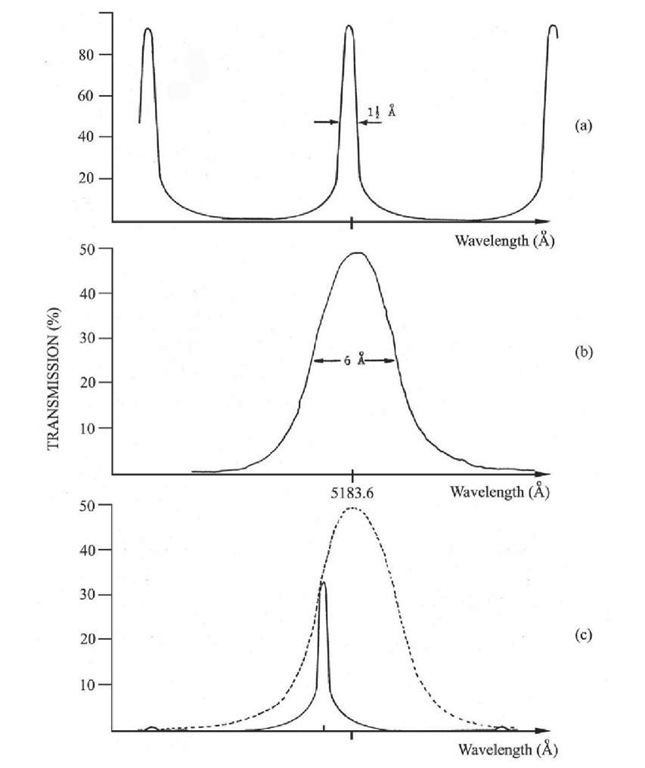
The essence of such an instrument is that light to be analysed is passed through two successive filters (see Figure 2.7). The Fabry-Perot etalon itself can be set up to allow a narrow band of wavelengths to pass through (one and a half angstroms, the chosen resolved width – see Figure 2.7a). However, as shown later, used alone, the F-P etalon would also pass a whole series of other pass-bands, separated by a wavelength interval known as the free spectral range. In order to suppress these unwanted wavelengths, a wider band filter (about 6 A) is used, known as a premonochromating filter. The pass-band of this filter is illustrated in Figure 2.7b. The result of placing the two filters in series is shown in Figure 2.7c. As the F-P peak is scanned over the range of wavelengths to be studied, all the other peaks are filtered out by the premonochromator. The height of the peak transmission varies according to where it stands with respect to the filter shape, and this effect has to be compensated for in the reduction of the data later. The parameters shown in Figure 2.7 are roughly those chosen for this instrument. The theory of the Fabry-Perot etalon is considered in more detail later, in section 2.6.5.
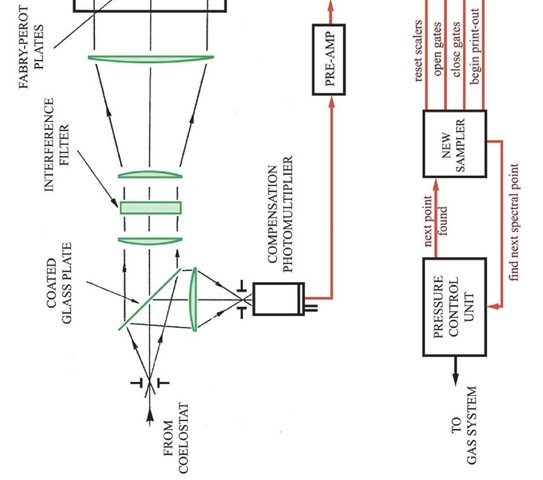
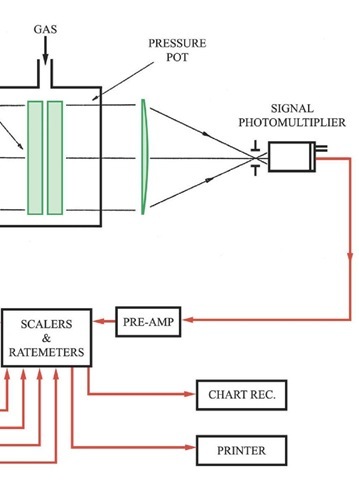
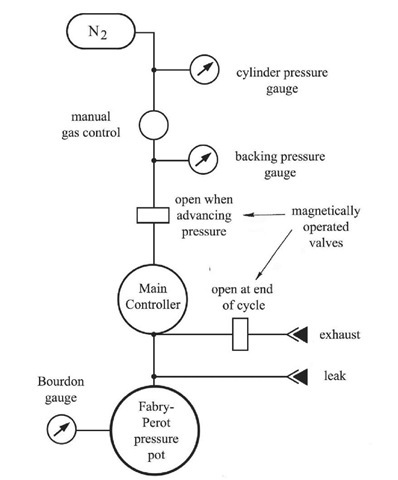
A schematic of the optical system and electronics is shown in Figure 2.8 (overleaf), and the gas pressure system in Figure 2.9.
Figure 2.7 Principle of the Fabry-Perot Interferometer.
Figure 2.8 Schematic of optics, and control and counting electronics.
The Fabry-Perot etalon was housed in a pressure pot into which Nitrogen gas was fed. To scan the instrument, Nitrogen pressure was varied over a range of 6 atmospheres, allowing the instrument to scan through a range of 9 A in wavelength. The equipment incorporated a fully automatic gas pressure stepping and cycling control, the ‘pressure controller’, with which the wavelength points to be sampled were selected on a programmable switchboard. Detection of the transmitted light was by a specially selected EMI 6256 photomultiplier, whose dark current was reduced to about one per second by cooling it to -30 degrees Celsius by means of a Peltier Effect cooler housing. This compares with a count rate of about 5 for the night sky. Pulses from the photomultiplier were amplified and counted by Nuclear Enterprises (Edinburgh series) scalers and ratemeters.
Compensation for sky transparency was provided by diverting a few per cent of the incident light through a gelatin filter with a 400 A wide wavelength pass-band, centred on 5200 A, into a second channel of pulse counting electronics. In operation, the pressure controller cycle was started by a pulse from the ‘Sampler’ (described below). The controller allowed the pressure to increase until a programmed point was reached, and then, after a stabilising period of 5 seconds, issued a pulse to instruct the Sampler to begin counting photons at this wavelength. The Sampler reset the scalers and allowed them to count for a predetermined time; it then closed the gates and initiated a print-out of the total count received in each channel.
Figure 2.9 The Nitrogen system.
When the print-out was complete, the pressure controller was automatically started off in search of the next sample point, and so on, until the end of the scan, when the controller returned the pressure pot to atmospheric pressure. Throughout the scan an analogue measure of the signal was produced by the ratemeter, which was attached to a chart reader, so a continuous visual check on signal levels was available while the scan was proceeding.
