By : James W Zubrick
Email: j.zubrick@hvcc.edu
Distillation is one of the more important operations you will perform in the organic chemistry laboratory. It is important that you understand some of the physical principles going on during a distillation. Different systems require different treatments; the explanations that follow parallel the classifications of distillations given earlier in the book.
CLASS 1: SIMPLE DISTILLATION
In a simple distillation, you recall, you separate liquids boiling BELOW 150 °C at one atmosphere from
1. Nonvolatile impurities.
2. Another liquid boiling at least 25 °C higher than the first. The liquids should dissolve in each other. The reason the liquids should dissolve in each other, is that if they do not, then you should treat the system like a steam distillation, and if you’re going to steam distill, be sure to look at the discussion for Class 4: Steam Distillations. The reason the boiling points should have a 25 °C difference, is so you may assume the higher boiling component doesn’t do anything but sit there during the distillation. Otherwise, you may have a two-component system, and you also need to look at the discussion for Class 3 Fractional Distillations, as well as here.
That said, let’s go on with our discussion of the distillation of one-component systems.
Suppose you prepared isobutyl alcohol by some means, and at the end of the reaction you wound up with a nice yellow-brown liquid. Checking any handbook, you find that isobutyl alcohol is a colorless liquid that boils at 108.1 ° C at 760 torr. On an STP day, the atmospheric pressure (P) is 760 torr and the boiling point is the normal boiling point. At that point, the single point when the vapor pressure of the liquid is the same as that of the atmosphere, the liquid boils.
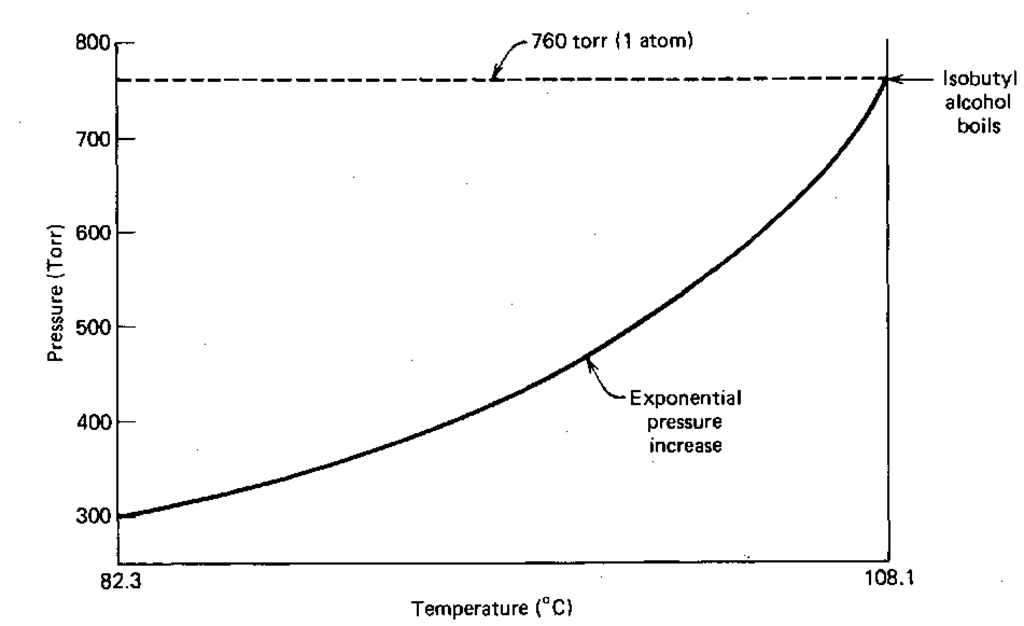
Fearing little, you set up a Class 1 Simple Distillation and begin to heat the mix. If you kept track of the temperature of the liquid (and you don’t; the thermometer bulb is up above the flask), and its vapor pressure, you’d get the temperature-vapor pressure data in columns 1 and 2 of Table 1.
At 82.3°C the vapor pressure of the liquid is 290.43 torr. Much lower than atmospheric pressure. The liquid doesn’t boil. Heat it to, say, 103.4 °C and the vapor pressure is 644.16 torr. Close to atmospheric pressure, but no prize. Finally, at 108.1 ° C we have 760.04 torr. The vapor pressure of the liquid equals that of the atmosphere, and the liquid boils.
Now, do you see an entry in the table for brown gunk? Of course not. The brown gunk must have a very low (or no) vapor pressure at any temperature you might hit during your distillation. Without a vapor pressure, there can be no vapor. No vapor and there’s nothing to condense. Nothing to condense, and there’s no distillation. So the isobutyl alcohol comes over clean and pure, and the brown gunk stays behind.
If you plot the temperature and vapor pressure data given in Table 1, you reconstruct the liquid-vapor equilibrium line in the phase diagram of that liquid (Fig. 139). The equation of this line, and you might remember this from your freshman chemistry course, is the Clausius-Clapyron equation:
Table 1 Temperature-Vapor Pressure Data for Isobutyl and Isopropyl Alcohols.
| Temperature
(°C) |
Isobutyl alcohol (torr) | Isopropyl alcohol (torr) |
| 82.3 | 290.43 | 760.00 |
| 83.2 | 301.05 | 786.31 |
| 85.4 | 328.41 | 853.90 |
| 86.9 | 348.27 | 902.76 |
| 88.7 | 373.46 | 964.52 |
| 90.9 | 406.34 | 1044.83 |
| 95.8 | 488.59 | 1244.30 |
| 99.9 | 567.96 | 1435.11 |
| 103.4 | 644.16 | 1616.99 |
| 106.2 | 711.23 | 1776.15 |
| 108.1 | 760.04 | 1891.49 |
Fig. 139 Vapor pressure vs. temperature curve for isobutyl alcohol.
Clausius & Clapyron
So if you want to know how the vapor pressure of a substance is going to vary with temperature, you can use the Clausius-Clapyron equation
where
p° is a known vapor pressure
T° is a known temperature (in K, not”C)
These are usually taken from the normal boiling point.
AH is the heat of vaporization of the liquid
R is the universal gas constant; (8.314 J/mole-K)
T is the temperature you want the vapor pressure for and p is the vapor pressure, that you calculate, for the temperature you want, T.
I’ve put this formula to two uses:
1. From the normal boiling point of isobutyl alcohol (T° = 108.1°C,381.2K; p°=760 torr), and one other vapor pressure measurement I found while doing research for this section (T=100°C, 373K; p=570 torr), I’ve gotten the heat of vaporization (AH), the heat needed to vaporize a mole of pure isobutyl alcohol itself. Using these two values in the Clausius-Clapyron equation, the AH for isobutyl alcohol is 10039.70 cal/mole.
2. Now, with this AH for isobutyl alcohol, I’ve calculated the field of pressures you see in Table 1 from temperatures of 82.3 to 108.1 °C. That’s why the last pressure at 108.1 is 760.04, and not 760.00. The 760.04 value has been back-calculated using the AH that we calculated from the two pressure-temperature points in the first place.
I’ve also listed the vapor pressure data for isopropyl alcohol in column 3 of
Table 1. Again, two steps were required to generate the data:
1. Two known vapor pressure-temperature points (T°=82.3°C, 355.4K, p°=760 torr; T=100°C, 373K, p=1440 torr) were used to calculate the AH: 9515.73 cal/mol.
2. Now that AH, and temperatures from 82.3 to 108.1 °C, were used to calculate a field of vapor pressures for isopropyl alcohol. These are in column 3 of Table 1.
I’ve done these things for a few good reasons:
1. To show you how to use the Clausius-Clapyron equation, and to show you how well the equation fits over small temperature ranges. The calculated boiling point pressure for isobutyl alcohol (760.04 torr) is not very different from the normal boiling point pressure of 760.00 torr (0.005%).
2. To show you that compounds with higher AH’s have lower vapor pressures. This means that it takes more energy to vaporize them.
3. To show you that you can calculate vapor pressures that are above the boiling point of the liquid. They have a slightly different meaning, however. There is no liquid isopropanol at 100 °C and 760 torr. The vapor pressure at 100° C is 1440 torr, almost twice the atmospheric pressure. But if we artificially increased the pressure over a sample of isopropyl alcohol (pumped up the flask with compressed air?) to 1440 torr, then heated the flask, the alcohol would no longer boil at 82.3 ° C. You’d have to go as high as—did someone say 100 °C?—before the vapor pressure of the liquid matched the now pumped-up atmospheric pressure, and the liquid would boil.
4. To show you the theory of the next topic, Class 3, Fractional Distillation. CLASS 3: FRACTIONAL DISTILLATION
In a fractional distillation, you remember, you are usually separating liquid mixtures, soluble in one another, that boil at less than 25 °C from each other at a pressure of one atmosphere.
Now I didn’t discuss both isopropyl and isobutyl alcohol in the last section for my health. Suppose you’re given a mixture of these two to separate. They are miscible in each other and their boiling points are just about 25 ° C apart. A textbook case, eh?
A Hint from Dalton
So you set up for a fractional distillation and begin to heat the liquid mixture. After a bit, it boils. And what does that mean? The vapor pressure of the solution now (not just one component), is equal to the atmospheric pressure, 760 torr. (We’re very lucky textbook-land has so many STP days.) Each component exerts its own vapor pressure, and when the total pressure reaches 760 torr, the solution boils.
This is Dalton’s Law of partial pressures. The total pressure of the gang is equal to the sum of their individual efforts. Here, A could be the isopropyl alcohol and B the isobutyl, (it doesn’t matter) but PTotai must be the atmospheric pressure, Patm. So a special version of Dalton’s Law of partial pressures for use in fractional distillation will be
Dalton and Raoult
If that’s all there were to it, we’d be talking about Class 4 Steam Distillations and the like, where the components aren’t soluble, and we could quit. Here, the two are soluble in each other. The individual vapor pressures of each component (PA, PB) depend not only on the temperature, but also on their mole fraction.
It makes sense, really. Molecules are the beasties escaping from solution during boiling, and, well, if the two liquids dissolve in each other perfectly, the more molecules (moles) of one component you have, the more the solution behaves like that one component, until it gets to be the same as a one-component liquid. This is Raoult’s Law
where
PA is the vapor pressure of A from the mixture.
XA is the mole fraction of liquid A.
P°K is the vapor pressure of the pure liquid A.
If we change the A’s to B’s, can you still follow me? It’s the same thing, only now with liquid B. If we combine the special case of Dalton’s Law with Raoult’s Law, we get
Look at this. If there is NO B, then the fraction of A is 1, and the pure liquid A boils when its vapor pressure equals the atmospheric pressure. Didn’t I say that? Similarly, for B without A, the mole fraction of B is 1, and it too boils when its vapor pressure equals the atmospheric pressure.
At this point, you’re usually given the temperature versus mole fraction diagram for two miscible liquids (Fig. 140), and you’re told it’s a consequence of Raoult’s Law. Well, yes. But not directly. Raoult’s Law is a relationship of pressure, not temperature, versus mole fraction; and Raoult’s Law is pretty much a straight line. You don’t need all your orbitals filled to see that you’ve been presented with a temperature versus mole fraction diagram, there are two lines (not one), and neither of them are very straight.
A Little Algebra
I want to convert the combined laws of Dalton and Raoult such that I can show the variation in mole fraction explicitly. First, you’ll agree that the mole fractions of A and B must add to 1 (or they wouldn’t be fractions, eh?), so
Now back with the Dalton and Raoult
and seeing that
substitute to get
Expand this expression with a multiplication:
Collect the terms with mole fraction in them:
And factor the mole fraction out to give:
To isolate the mole fraction XA subtract Pg from both sides:
to get and divide by
Clausius and Clapyron Meet Dalton and Raoult
We still have a formula that relates mole fraction to pressure. Note, however, that with the exception of the atmospheric pressure![]() all the other pressures are that of pure liquids
all the other pressures are that of pure liquids![]() . Now, how does the vapor
. Now, how does the vapor
The P°’s of Dalton – Raoult are vapor pressures taken at fixed temperatures. They are the p’s in the Clausius – Clapyron equation found with a variation in temperature. Don’t believe me? Pick a vapor pressure and temperature pair from Table 1 for either liquid, and let these be p° and T° (and don’t forget to use K, not °C). Now what happens when the “unknown” temperature (T) is the same as T°? The (1 /T — 1/T°) becomes zero, the entire exponent becomes zero, p° is multiplied by 1 (anything to the power zero is 1, eh?) .
The next part is messy, but somebody’s got to do it. I’m going to use the vapor pressure-temperature data for the normal boiling points of both liquids in the Clausius-Clapyron equation. Why? They’re convenient, known vapor pressure-temperature points. When I do this, though, I exercise my right to use different superscripts to impress upon you that these points are the normal boiling points. So for liquid A, we have p’K and if A is isobutyl alcohol,pX = 760 torr and T’A = 101.8°C. For liquid B, we havep£ and if B is isopropyl alcohol, p£ = 760 torr and = 82.3 °C.
Using the new letters, above, and substituting the Clausius-Clapyron equation for every P° you get
Phew!
The only variables in this beast are the mole fraction (X), and the temperature (T). Every other symbol is a constant. We finally have the equation for the bottom line of the temperature-mole fraction diagram, something that has eluded us for years.
Pressure of a pure liquid vary with temperature? Smite your forehead and say that you could have had a V-8. The Clausius-Clapyron equation:
Dalton Again
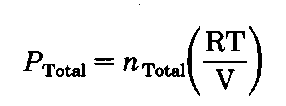
What about the upper curve? Glad you asked (sigh.). The composition in the vapor is also related to Dalton’s Law of Partial Pressures. For an ideal gas
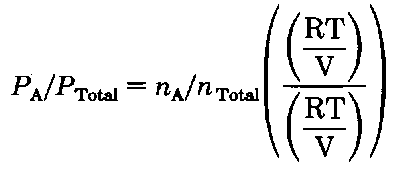
Now watch, as I divide the pressure of A by the total pressure:
Well the RT/V’s cancel giving
(and you thought you’d never see that again!) and for the vapors above the liquid,
Yet we know that the total pressure of Dalton’s gang is the sum of their individual efforts:
The ratio of the number of moles of A to the totaZ.number of moles is the mole fraction of component A in the vapor
PTotal for the ordinary distillation is the atmospheric pressure, 760 torr (P”s, eh?). PA is the vapor pressure of A, and again by Raoult’s Law,![]() Putting the two together, we get
Putting the two together, we get
We can make the same kind of substitution of Clausius-Clapyron here, and get a similarly curved function for the upper line in the temperature-mole fraction diagram.
To show you that all this really does work, I’ve listed the experimental composition data for the isopropyl/isobutyl alcohol system from Landolt-Bornstein (Landolt-Bornstein is to physical chemistry what Beilstein is to organic. And wouldn’t that make for a wild analogy question on the college board entrance exams?), along with my calculated data (Table 2) (That explains my choice of temperatures for Table 1.). I’ve also given the absolute and percent differences between the experimental data, and what I’ve calculated. These differences are on the order of 1% or less, a very good agreement, indeed.
So now, for any two liquids, if you have their normal boiling points and vapor pressures at any other temperature, you can generate the temperature-mole fraction diagram.


