By : James W Zubrick
Email: j.zubrick@hvcc.edu
Unlike the chromatographies, which physically separate materials, infrared (IR) spectroscopy is a method of determining what you have after you’ve separated it.
The IR spectrum is the name given to a band of frequencies between 4000 and 650 cm-1 beyond the red end of the visible spectrum. The units are called wave numbers or reciprocal centimeters (that’s what cm-1 means). This range is also expressed as wavelengths from 2.5 to 15 micrometers (jUm).
With your sample in the sample beam, the instrument scans the IR spectrum. Specific functional groups absorb specific energies. And because the spectrum is laid out on a piece of paper, these specific energies become specific places on the chart.
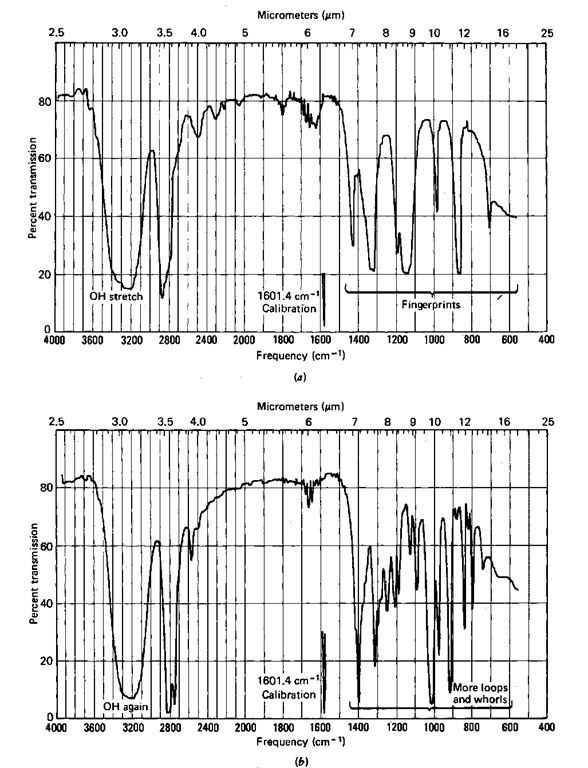
Look at Fig. 118. Here’s a fine example of a pair of alcohols if ever there was one. See the peak (some might call it trough) at about 3400 cm-1(2.9 [im)l That’s due to the OH group, specifically the stretch in the O—H bond, the OH stretch.
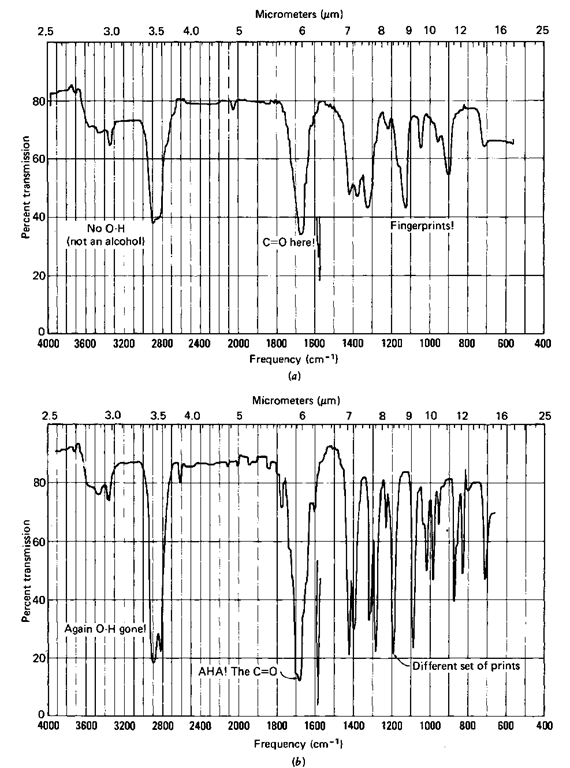
Now, consider a couple of ketones, 2-butanone and cyclohexanone (Fig. 119). There’s no OH peak about 3400 cm-1 (2.9/^m), is there? Should there be? Of course not. Is there an OH in 2-butanone? Of course not. But there is a C=0, and where’s that? The peak about 1700 cm-1 (5.9/^m). It’s not there for the alcohols and it is there for the ketones. Right. You’ve just correlated or interpreted four IRs.
Because the first two (Fig. 118) have the characteristic OH stretch of alo-chols, they might just be alcohols. And the other two (Fig. 119) might be ketones because of the characteristic C—O stretch at 1700 cm-1 (5.9/zm) in each.
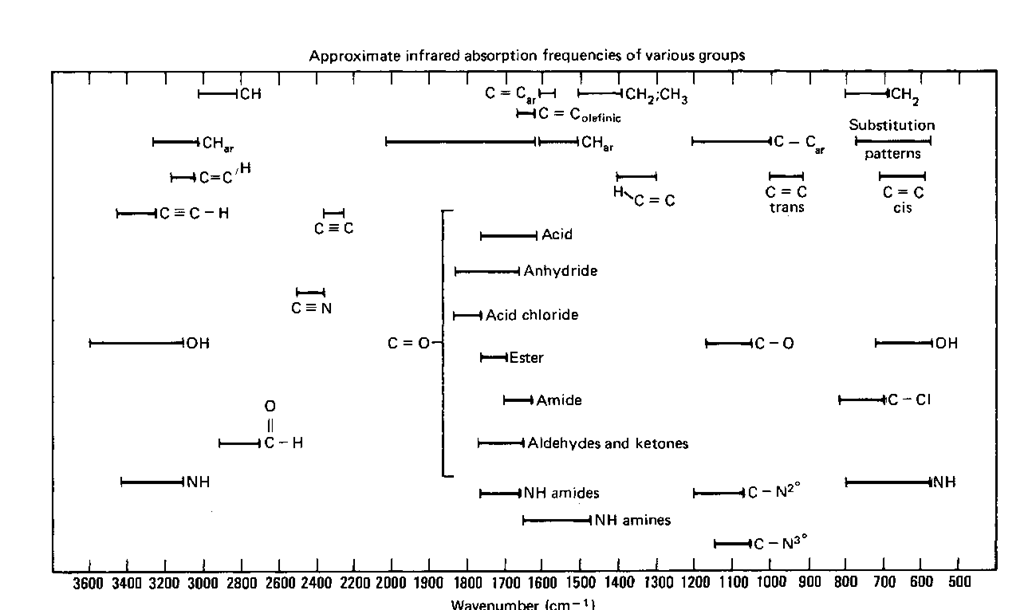
What about all the other peaks? You can ascribe some sort of meaning to each of them, but it can be very difficult. That’s why frequency correlation diagrams, or IR tables, exist (Fig. 120). They identify regions of the IR spectrum where peaks for various functional groups show up. They can get very complicated. Check to see if you can find the C—H stretch and the C—O stretch that are in all four spectra, using the correlation table. It can be fun.
For you Sherlock Holmes fans, the region from 1400 to 990 cm-1 (7.2 -11.1 fim) is known as the fingerprint region. The peaks are due to the entire molecule, its fingerprint, rather than being from independent functional groups. And, you guessed it, no two fingerprints are alike.
Take another look at the cyclohexanol and cyclohexanone spectra. Both have very different functional groups. Now look at the similarities, the simplicity, including the fingerprint region. Both are six-membered rings and have a high degree of symmetry. You should be able to see the similarities due to the similar structural features.
Fig. 118 IR spectra of a (a) t-butanol and (b) cyclohexanol.
Fig. 119 IR spectra of (a) 2-butanone and (b) cyclohexanone.
Fig. 120 The author’s only IR correlation chart.
Two more things. Watch your spelling and pronunciation. It’s not “in-fared,” OK? And most people I know use IR (pronounced “eye-are,” not “ear”) to refer to the technique, the instrument, and the chart recording of the spectrum:
“That’s a nice new IR you have there.” (the instrument)
“Take an IR of your sample.” (perform the technique)
“Let’s look at your IR and see (interpret the resulting what kind of compound you have.” spectrogram)
To take an IR, you need an IR. These are fairly expensive instruments; again, no one is typical, but you can get a feeling of how to run an IR as you go on.
INFRARED SAMPLE PREPARATION
You can prepare samples for IR spectroscopy easily, but you must strictly adhere to one rule:
No water!
In case you didn’t get that the first time:
No water!
Ordinarily, you put the sample between two salt plates. Yes. Common, ordinary water-soluble salt plates. Or mix it with potassium bromide (K Br), another water-soluble salt. So keep it dry, people.
Liquid Samples
1. Make sure the sample is DRY. NO WATER!
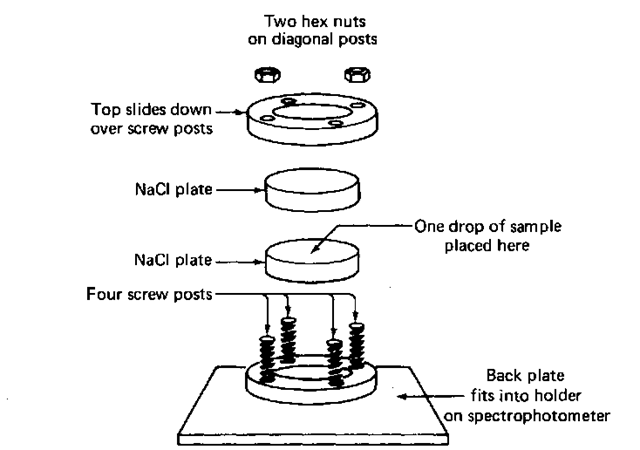
2. Put some of the dry sample (2-3 drops) on one plate, then cover it with another plate (Fig. 121). The sample should spread out to cover the entire plate. You don’t have to press. If it doesn’t cover well, try turning the top plate to spread the sample, or add more sample.
3. Place the sandwich in the IR salt plate holder and cover it with a hold-down plate.
4. Put at least two nuts on the posts of the holder (opposite corners) and spin them down GENTLY to hold the plates with an even pressure. Do not use force! You’ll crack the plates! Remember, these are called salt plate holders and not salt plate smashers.
5. Slide the holder and plate into the bracket on the instrument in the sample beam (closer to you, facing instrument).
6. Run the spectrum.
Since you don’t have any other solvents in there, just your liquid com-do not over tighten pound, you have just prepared a liquid sample, neat, meaning no solvent. This is the same as a neat liquid sample, which is a way of describing any liquid without a solvent in it. It is not to be confused with “really neat liquid sample,” which is a way of expressing your true feelings about your sample.
Fig. 121 IR salt plates and holder.
Solid Samples
A rapid, inexpensive way to get an IR of solids is to mix them with Nujol, a commercially available mineral oil. Traditionally this is called “making a Nujol mull,” and it is practically idiomatic among chemists. Though you won’t see Rexall or Johnson & Johnson mulls, the generic brand mineral oil mull is often used.
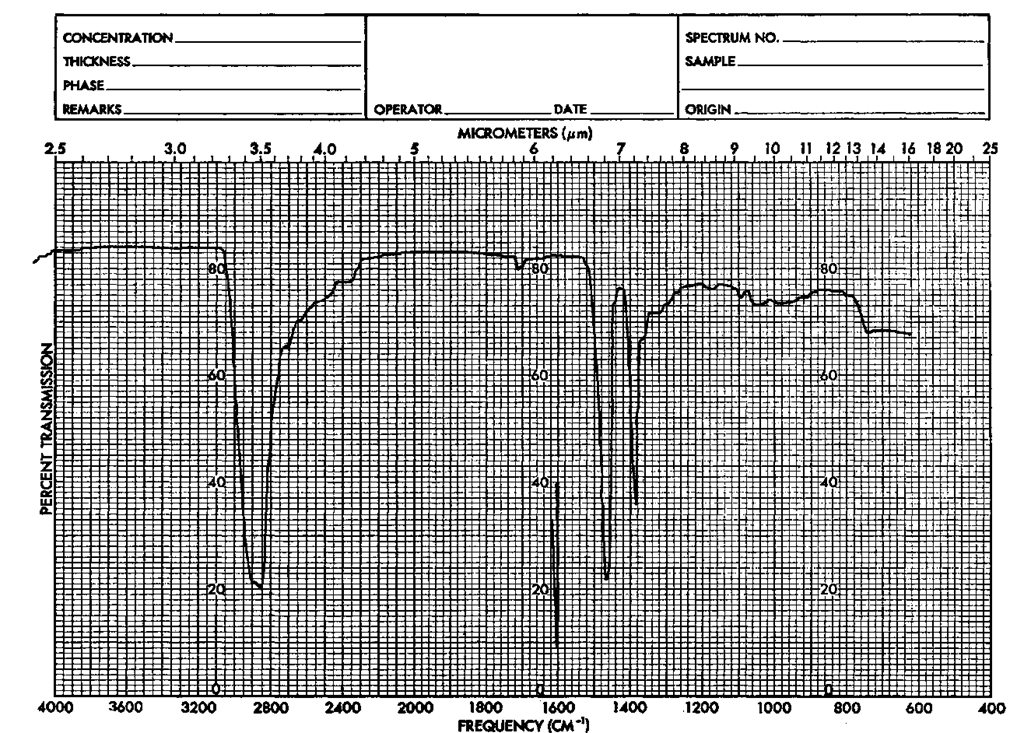
You want to disperse the solid throughout the oil, making the solid transparent enough to IR that the sample will give a usable spectrum. Since mineral oil is a saturated hydrocarbon, it has an IR spectrum all its own. You’ll find hydrocarbon bends, stretches, and push-ups in the spectrum, but you know where they are, and you ignore them. You can either look at a published reference Nujol spectrum (Fig. 122) or run your own if you’re not sure where to look.
1. Put a small amount of your solid into a tiny agate mortar and add a few drops of mineral oil.
2. Grind the oil and sample together until the solid is a fine powder dispersed throughout the oil.
3. Spread the mull on one salt plate and cover it with another plate. There should be no air bubbles, just an even film of the solid in the oil.
4. Proceed as if this were a liquid sample.
5. Clean the plates with anhydrous acetone or ethanol. NOT WATER! If you don’t have the tiny agate mortar and pestle, try a Witt spot plate and the rounded end of a thick glass rod. The spot plate is a piece of glazed porcelain with dimples in it. Use one as a tiny mortar; the other as a tiny pestle.
And remember to forget the peaks from the Nujol itself.
Fig. 122 A published reference Nujol spectrum.
Solid KBr Methods
KBr methods (hardly ever called potassium bromide methods) consist of making a mixture of your solid (dry again) with IR-quality KBr. Regular KBr off the shelf is likely to contain enough nitrate, as KN03, to give spurious peaks, so don’t use it. After you have opened a container of KBr, dry it and later store it in an oven, with the cap off, at about 110°C to keep the moisture out.
Preparing the Solid Solution
1. At least once in your life, weigh out 100 mg of KBr so you’ll know how much that is. If you can remember what 100 mg of KBr looks like, you won’t have to weigh it out every time you need it for IR.
2. Weigh out 1-2 mg of your dry, solid sample. You’ll have to weigh out each sample because different compounds take up different amounts of space.
3. Pregrind the KBr to a fine powder about the consistency of powdered sugar. Don’t take forever, since moisture from the air will be coming in. Add your compound. Grind together. Serves one.
Pressing a KBr Disk—The Mini-Press
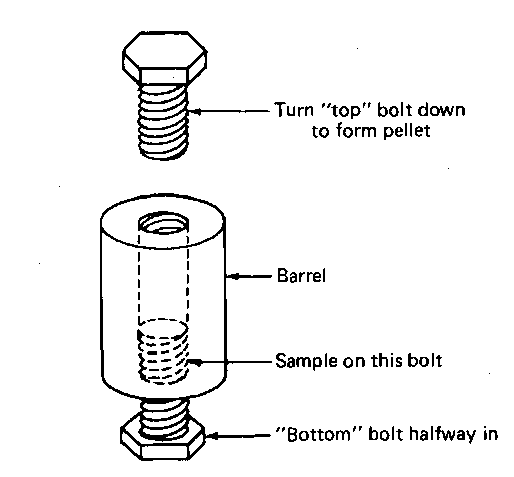
1. Get a clean, dry press and two bolts. Screw one of the bolts into the press about halfway and call that the bottom of the press.
Fig. 123 The Mini-Press.
2. Scrape a finely ground mixture of your compound (1-2 mg) and KBr (approx. 100 mg) into the press so that an even layer covers the bottom bolt.
3. Take the other bolt and turn it in from the top. Gently tighten and loosen this bolt at least once to spread the powder evenly on the face of the bottom bolt.
4. Hand tighten the press again, then use wrenches to tighten the bolts against each other. Don’t use so much force that you turn the heads right off the bolts.
5. Remove both bolts. A KBr pellet, containing your sample, should be in the press. Transparent is excellent. Translucent will work. If the sample is opaque, you can run the IR, but I don’t have much hope of your finding anything.
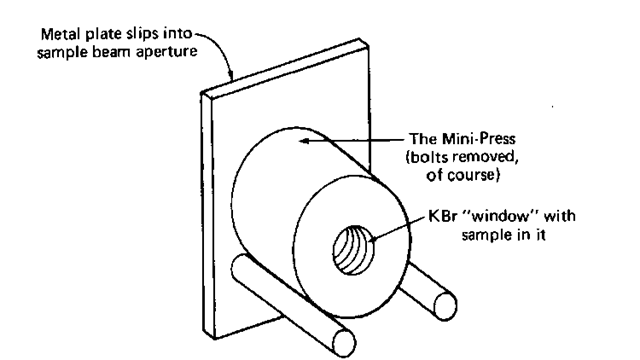
6. Put the entire press in a holder placed in the analyzing beam of the IR, as in Fig. 124. (Don’t worry about that yet, I’ll get to it in a moment. “Running the Spectrum,” is next.)
Pressing a KBr Disk—The Hydraulic Press
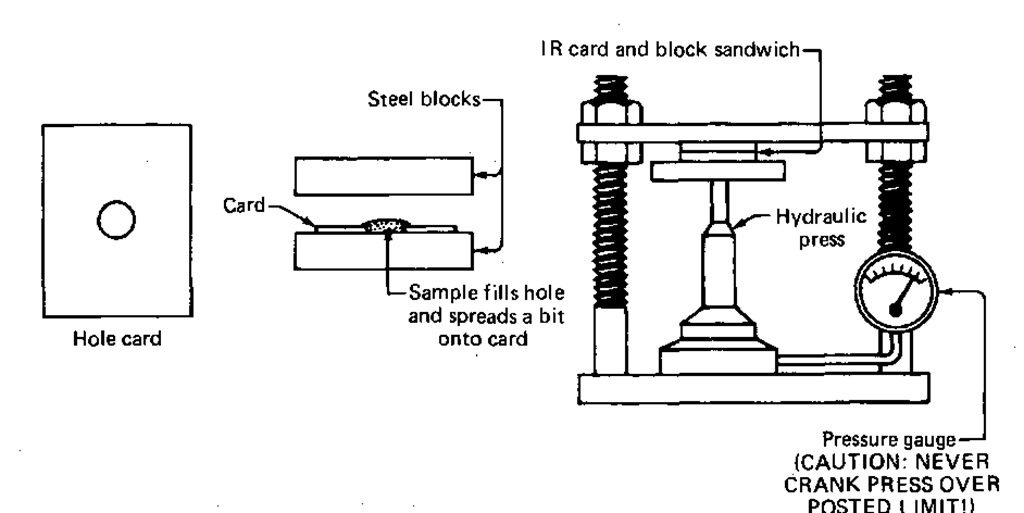
If you have a hydraulic press and two steel blocks available, there is another easy KBr method. It’s a card trick, and at no time do my fingers leave my hands. The only real trick is you’ll have to bring the card.
Fig. 124 The Mini-Press in its holder.
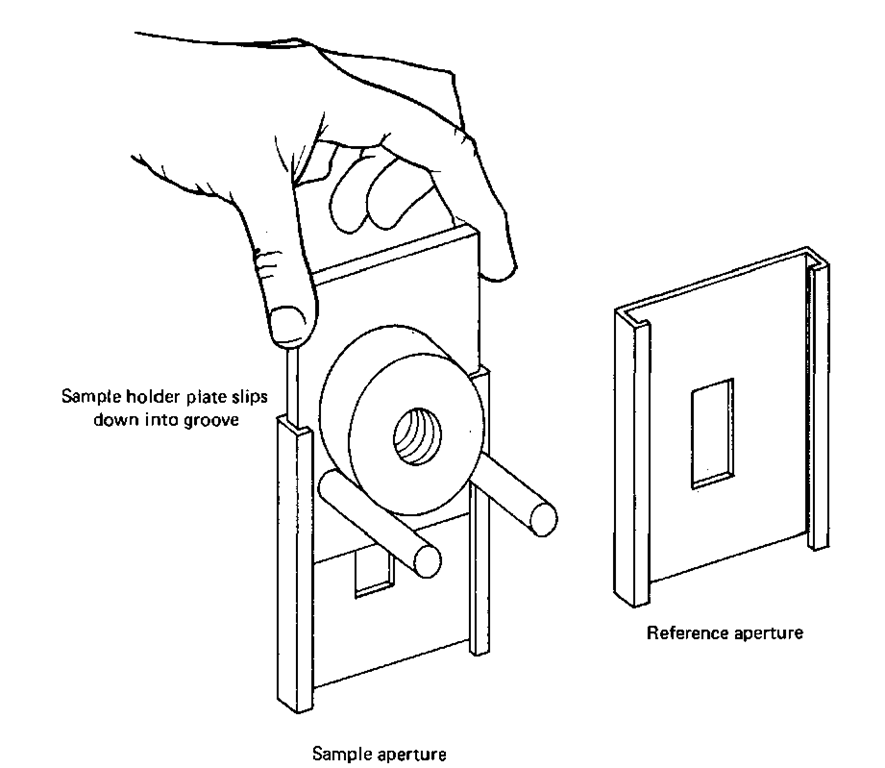
1. Cut and trim an index card so that it fits into the sample beam aperture (Fig. 129).
2. Punch a hole in the card with a paper punch. The hole should be centered in the sample beam when the card is in the sample beam aperture.
3. Place one of the two steel blocks on the bottom jaw of the press.
4. Put the card on the block.
5. Scrape your KBr-sample mixture onto the card, covering the hole and some of the card. Spread it out evenly.
6. Cover the card, which now has your sample on it, with the second metal block (Fig. 125).
7. Pump up the press to the indicated safe pressure.
8. Let this sit for a bit (1 min). If the pressure has dropped, bring it back up, slowly, carefully, to the safe pressure line, and wait another bit (1 min).
9. Release the pressure on the press. Push the jaws apart.
10. Open the metal sandwich. Inside will be a file card with a KBr window in it, just like in the Mini-Press.
CAUTION! The KBr window you form is rather fragile, so don’t beat on it.
11. Put the card in the sample beam aperture (Fig. 126). The KBr window should be centered in the sample beam if you’ve cut and punched the card correctly. Now you’re ready to run the spectrum.
Fig. 125 KBr disks by hydraulic press.
Fig. 126 Putting sample holders with samples into the beam.
