Mechanical properties of materials
Two series of experiments were performed to characterize the mechanical properties of the steels used for the beams and bolts. In the case of beams, ISO 6892 [9] and ISO 377 [10] standards were applied. The standard test, for rolled steel products, differentiates steel obtained from the web and flanges. Therefore, three specimens were tested from the web and three from the flanges and the average values obtained are shown in Table 3. In addition, five bolts were tested, and the average values obtained for the elastic limit and ultimate tensile strength were 824.5 N/mm2 and 936.5 N/mm2 respectively.
|
|
Young’s Modulus [N/mm2] |
Elastic Limit [N/mm ] |
Poisson’s ratio |
|
Flange’s steel |
204105 |
373.97 |
0.2882 |
|
Web’s steel |
212866 |
378.43 |
0.2945 |
Table 3 Average material properties of the beam
Finite Element Modeling of the T-Stub
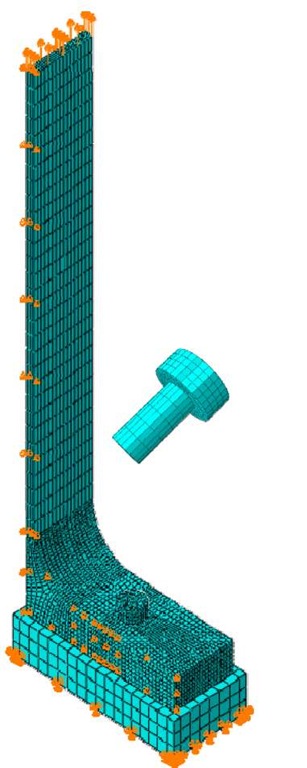
The finite element (FE) analyses were performed using ABAQUS® [11] and were based on those reported by Swanson et al [12], Girao et al [13] and Bursi et al [14] who have reported that 3D FE models incorporating contact with friction and full non-linear properties are essential to understand the complex phenomena in the T-stubs. The T-stub assembly was modeled utilizing the double symmetry with the flange-to-flange contact replaced by a flange-to-rigid foundation as reported by Swanson et al [12]. The bolt, stub and the base were created as three separate parts and surface-to-surface contact friction interactions were created to simulate the behavior of the interfaces. A coefficient of friction of 0.33 was used for the bolt-head/washer and flange interaction as reported in [12]. No friction was assumed between the flange and rigid base as described in [13]. Non-linear material properties obtained from experimental tests were used for the T-stubs. The material tests on the bolts are currently in progress, instead the non-linear bolt material properties were taken from literature [12]. The base was assumed to be a linear material with a Young’s modulus of 1015 MPa and a Poisson’s ratio of 0.45 as reported in [12].
Symmetric geometrical boundary conditions were used along the web. The base of the foundation was fixed in all directions. The bolt-to-flange and the-flange-to-rigid foundation surfaces were brought into contact prior to the application of load. The bottom surface of the bolt was fixed in the vertical direction such that it is in tension as the web is pulled. The simulation was performed using displacement control and a uniform displacement was applied to the top of the web until failure. All parts in the T-stub models were discretized using solid eight-noded elements with reduced integration (C3D8R). The degree of discretization was finer than reported in literature [12-14]. Fig. 9 shows the FE model used for the T-stub model-2 in this work.
Fig. 9 FE model
Validation of the model
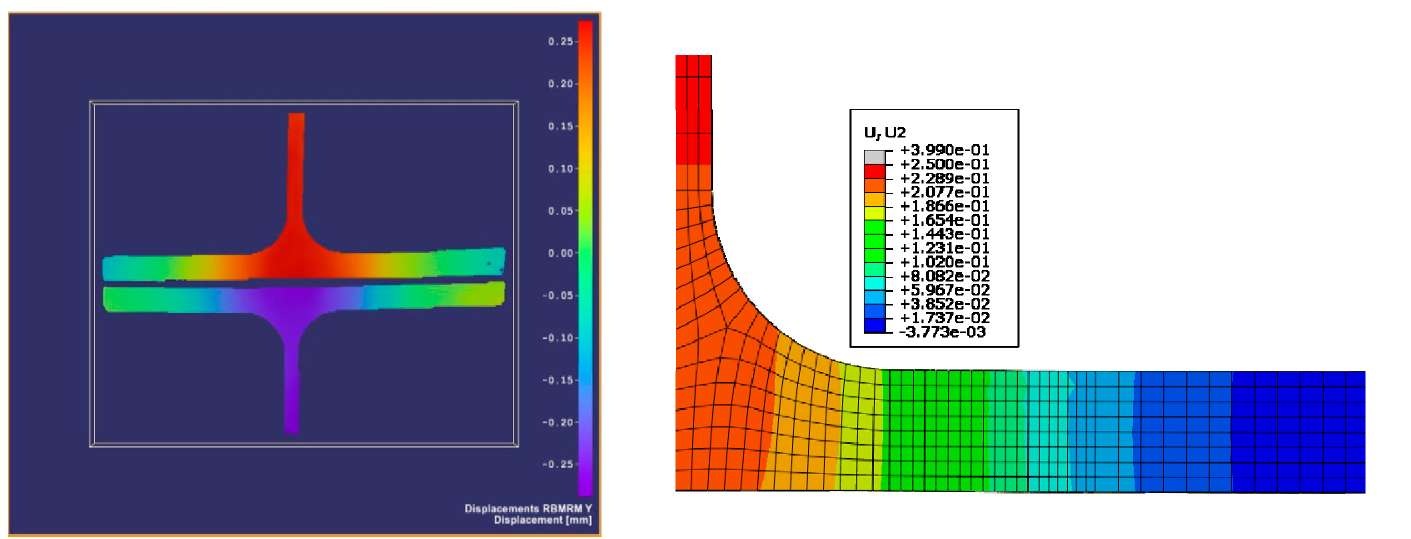
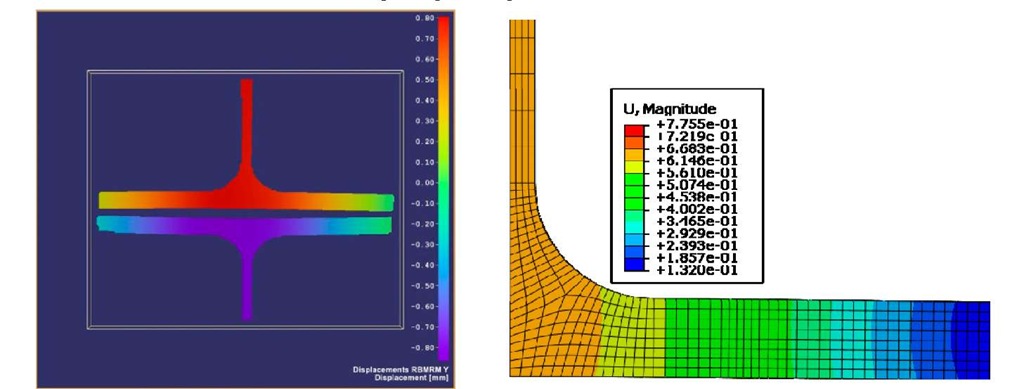
The FE models for the two T-stub models in this study were validated with experimental data by comparing the overall, behavior (load-deformation curves) and y-displacement maps of the frontal surface. Additionally, total displacement on the lateral surface and strain in the transverse direction was also compared. Fig. 10 shows the y-displacement map for the frontal surface as obtained from the experimental DIC analysis and FE model, respectively for loads in the elastic regime for model-1.
Fig. 10 Y-displacement on the frontal surface for model-1 from experimental DIC analysis (left) and FE predictions (right) corresponding to loading in the elastic regime
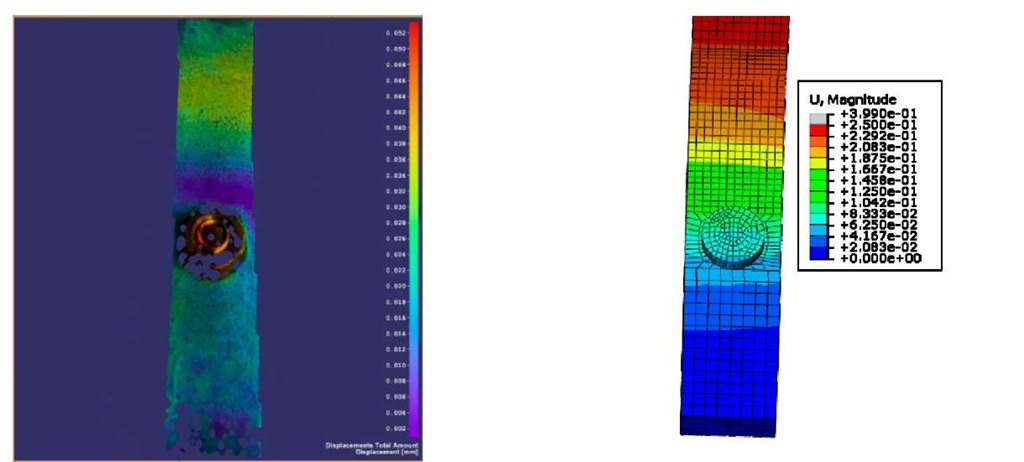
Fig. 11 Total displacement on lateral surface of model-1 from experimental DIC analysis (left) and FE predictions (right) corresponding to loading in the elastic regime
The FE predictions of displacement show excellent agreement with the experimental results from DIC. Also, the comparison of lateral surface displacement images (Fig. 11) from both FE predictions and DIC experiments reveal that the displacement is almost constant along the lef direction, suggesting that three-dimensional effects are minimal in these models.
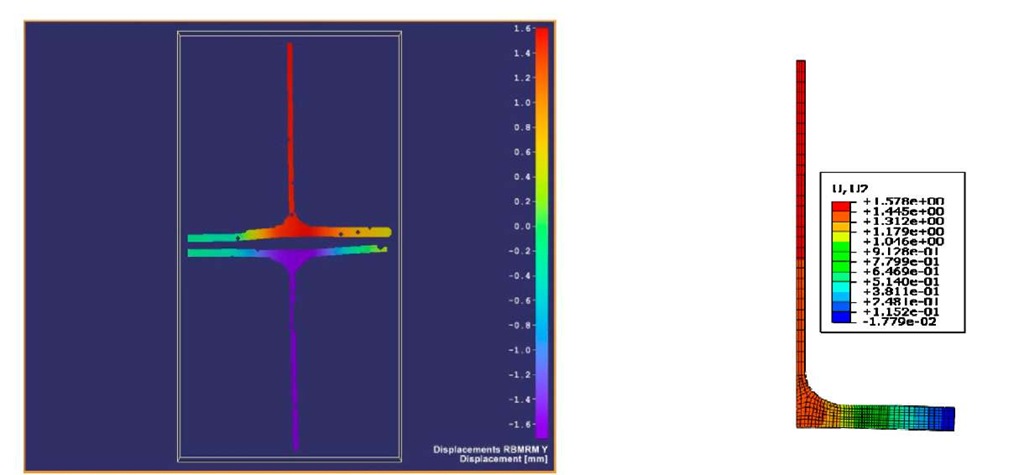
Similarly, Fig. 12 and Fig. 13 show maps of y-displacement from the experimental DIC analysis and FE modeling for the case of loading at failure for model-1 and model-2, respectively. As in the elastic case, the comparison of FE predictions with experiments revealed a good agreement in both the distribution and range of values. Another common way of validating the FE modeling is the comparison of the overall behavior (load-deformation curve) of the model with experimental response.
Fig. 12 Y-Displacement on frontal surface for model-1 from experimental DIC analysis (left) and FE predictions (right) during strength testing (load =19.0 kN).
Fig. 13 Y-Displacement on frontal surface of model-2 from experimental DIC analysis (left) and FE predictions (right) during strength testing (load=19.3 kN).
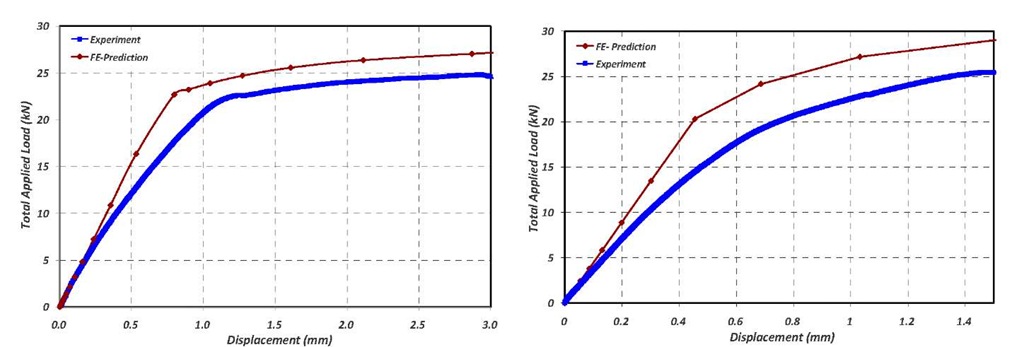
Fig. 14 and Fig. 15 provide the comparison of the force-displacement responses from FE simulations and experimental testing for models 1 and 2, respectively. It can be observed that the FE model yields stiffer results than the experiments. Similar results have been reported in the literature [12-14]. Also, the major discrepancy was observed at the onset of yielding, in which the actual plastification was found to be more gradual than those predicted by simulations. Bursi et al. [14] report similar results and attribute this phenomenon to the residual stress effects [14]. Overall, good agreement of FE models with experiments was observed.
The strength of the T-stubs as provided by the Eurocode [1] was compared with experimental results and is summarized in Table 4. The strength predictions from FE modeling is currently not reported due to the lack of detailed experimental characterization of the bolt, such work is in progress and will be included in the future communications. In the case of model-1 (lef=15mm), the difference between the Eurocode prediction [1] and the experimental value was found to be 2.1% while for model-2 (lef =25.2mm), this difference was substantially larger (16%).
|
Model |
Theoretical strength value [N] |
Experimental strength value [N] |
|
1 |
25,369 |
24,822 |
|
2 |
30,363 |
25,479 |
Table 4 Strength values obtained for both T-Stub models.
Fig. 14 Load-displacement behavior: Experimental (blue) and FE predictions (red) for model-1 (left) and model-2 (right).
Additional validation of the FE model was performed by comparing the strains in the transverse direction at the location as of the experimental strain gages. The location of the strain gages are provided in Table 2. Fig. 15 compares the strain responses from FE model with experiments in the elastic regime for both T-stubs model. A slight discrepancy, in the form of a non-linear behavior in the experiment response was observed in model 1. It should be noted that the strain gages are placed in the vicinity of the bolt and the fillet-curvature which is a region of complex phenomena and is governed by many factors. Additional experimental tests and accurate FE modeling is required to quantify such phenomena. In general, good agreement in strain predictions of simulations with experiments was observed.
Fig. 15 Comparison of strain at lateral surface from experiments (blue) and FE model (red) for model-1 (left) and model-2 (right) in the elastic regime.
Overall, the validation of the FE modeling with experimental tests and DIC analysis revealed good agreement of FE models with experimental data. Nevertheless, statistically significant number of experimental tests and accurate modeling of the phenomena with detailed material properties are essential to further increase the confidence of the FE models and to establish the quantitative uncertainties and confidence limits for the numerical models.
Conclusions
2D DIC has been used to study the complex strain field in a T-Stub joint. Good agreement between the results obtained for the displacement from T-surface using DIC and those obtained from an FE analysis reveals the utility of the latter in the study of real engineering problems. Further confirmation of the reliability of the FE model was achieved by using strain gages on the flange surfaces. The use of accurate material properties and the detailed modeling of complex interactions between the bolt-flange and flange-flange connections can further improve the FE model performance.
The use of optical methods for stress and strain analysis, such DIC, is a great utility for validating finite element models. FE models developed with the confidence of experimental validation provide a valuable tool for optimizing dimensions or improving safety in complex problems, such T-Stub joints.
